Audit the construction of auction profiles · 2 / 5
Volume profile value area: calculate VAH, VAL and coverage
A value-area percentage is an input to a selection procedure. With indivisible price rows, the included fraction need not equal that input. Check the selected rows and their volume before interpreting the boundaries.
Athenum8 minUpdated:
Specify the expansion rule
Use exact-price rows and begin at the unique highest-volume row. At each step compare the adjacent row above the current included region with the adjacent row below it, then prefer the larger volume. Advance only the selected side. Our dataset has no equal-volume candidate comparisons, so a tie rule cannot explain the difference being tested.
Compare two explicit stopping rules. Rule A rejects the next preferred row if it would exceed the target and stops immediately. Rule B includes preferred rows until accumulated volume reaches or exceeds the target. The retrieved TradingView and Sierra Chart documentation describe different stopping conventions. This example applies the stated rules; it is not a live conformance test of either product.
Report included volume and boundaries together
Sum the complete profile first, then multiply by the selected percentage. After expansion, divide included volume by that same complete total to obtain actual coverage. Here VAL and VAH mean the lowest and highest included exact-price rows. If a real chart uses interval buckets, additionally record whether its displayed boundary denotes a bucket edge or representative price.
Neither the target nor actual coverage is a forecast probability. Historical volume inside an algorithmically selected region is not a confidence interval for the next price. Keep sample, method and coverage visible when comparing screenshots; matching percentage inputs alone is insufficient.
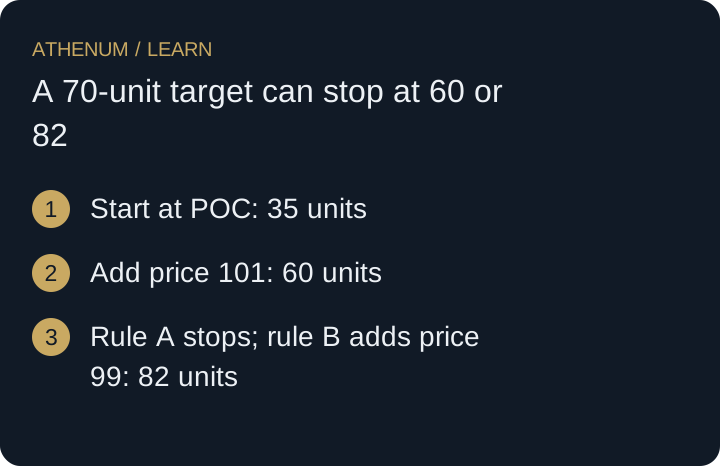
A 70-unit target can stop at 60 or 82
The invented profile totals 100 units, so a 70% target is 70 units. Start with 35 at price 100. Of the adjacent candidates, 25 at 101 exceeds 22 at 99; add 101 and reach 60. Next compare 22 at 99 with 10 at 102. The preferred candidate is 99.
Rule A stops before adding those 22 units: actual coverage is 60%, VAL 100 and VAH 101. Rule B adds them and stops at 82%: VAL 99 and VAH 101. Neither result equals exactly 70%, despite the identical target and input histogram.
| Price USD/unit | Volume, units |
|---|---|
| 98 | 8 |
| 99 | 22 |
| 100 | 35 |
| 101 | 25 |
| 102 | 10 |
 Open full-size diagram
- Start at POC: 35 units
- Add price 101: 60 units
- Rule A stops; rule B adds price 99: 82 units
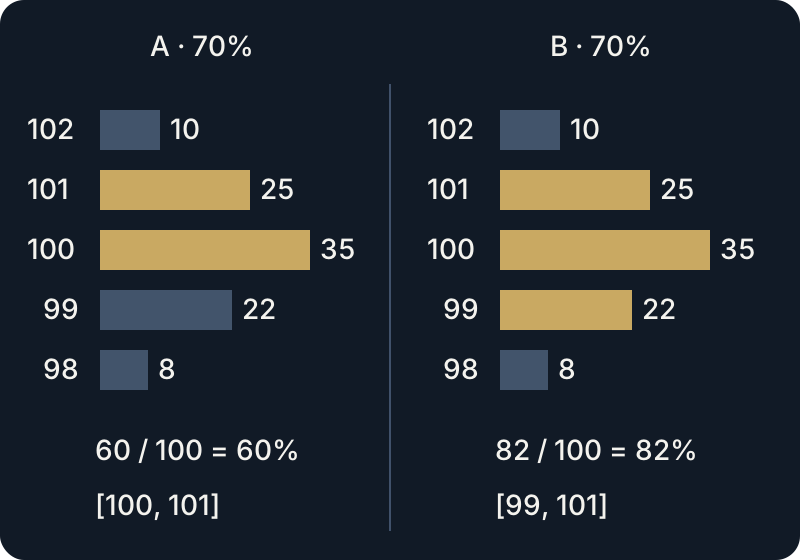
Cumulative included volume, not a price path: rule A stops at 60; rule B includes the next preferred row and stops at 82.
Do not change the algorithm to hit a prettier percentage
Trimming part of a row, skipping the preferred candidate or selecting the highest-volume rows without maintaining contiguity creates a different procedure. Such alternatives require their own definitions. Do not apply one during a calculation while citing documentation for another.
Before acting
- Verify total profile volume and target units.
- State expansion, tie and stopping rules separately.
- Record the complete sequence of included rows.
- Report actual coverage alongside VAL and VAH.
- Do not turn historical coverage into a return probability.
Check your understanding
Change only the target to 90%. Where do rules A and B stop? Why not select the 8-unit row to reach exactly 90?
Show the explained answer
Both reach 82 after including price 99. The next comparison is 8 units at 98 versus 10 at 102, so 102 is preferred. Rule A stops at 82%, with VAL 99 and VAH 101. Rule B adds 10 and stops at 92%, with VAL 99 and VAH 102. Choosing the 8-unit row to force exactly 90 would violate the stated larger-adjacent-candidate rule.