Liquidity, order books and liquidations · 1 / 5
Distinguish order-book liquidity from liquidation heatmaps
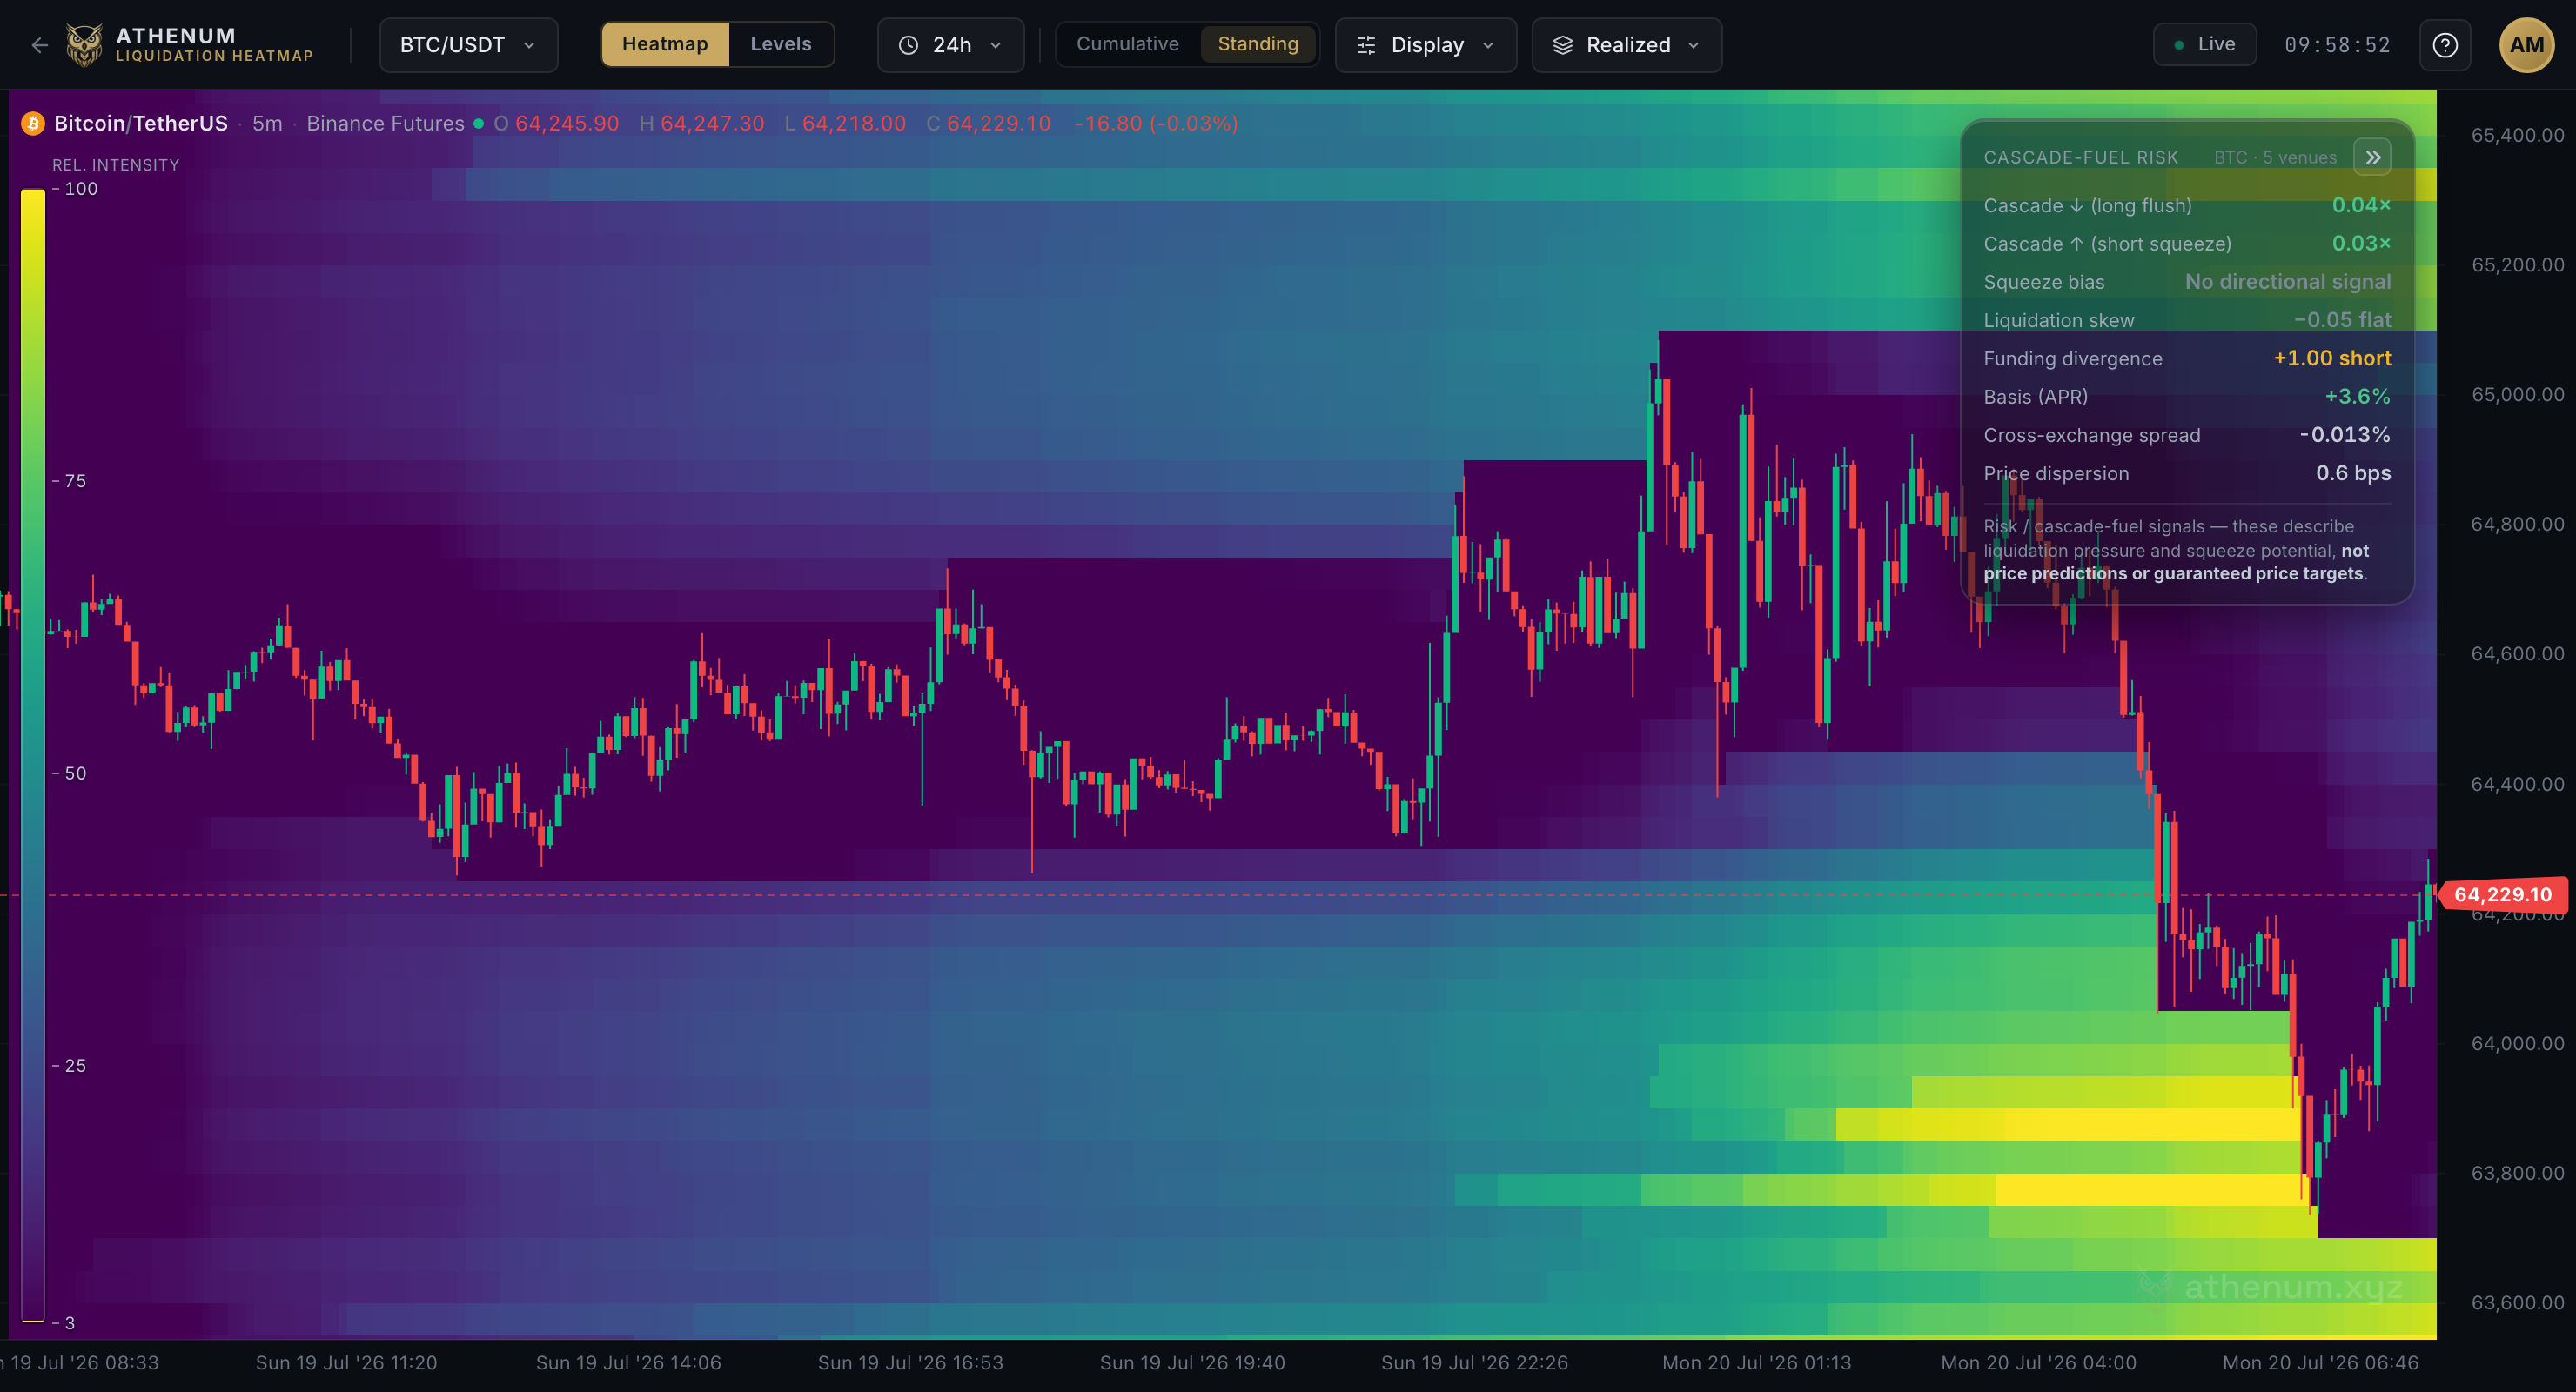
A bright horizontal band can represent an order that exists now, a modelled level where a position might liquidate or an event already reported. Those are three different claims. Colour and chart layout do not tell you which claim the data supports.
Athenum8 minUpdated:
Ask what the cell contains
An order-book heatmap visualises displayed resting liquidity over time. Those orders can be executed, amended or cancelled before price reaches them. Hidden liquidity and excluded order categories may not appear. A large visible bid is therefore an observation about the displayed book, not a promise that the size will remain available.
An estimated liquidation map projects potential levels from assumptions about entries, leverage and margin. Public aggregate data does not reveal all private collateral decisions, hedges or stop orders. A realised liquidation layer instead aggregates reported forced-close events. Its completeness and price meaning depend on the exchange feed; a reported bankruptcy price, for example, is not necessarily the execution price.
Read the legend before reading the market
Check whether intensity is in asset units, quote currency or a relative scale. A relative value of 90 does not mean 90 million dollars, a 90% probability or that 90% of traders share the same liquidation threshold. Rescaling the displayed window can change brightness without changing the underlying event.
In Athenum, use the layer and display controls together with the product documentation. Estimated intensity and reported liquidation amounts answer different questions and should not be added. Compare the position of features only after checking their units, retention and venue coverage. A saved screenshot illustrates the controls but cannot establish current liquidity.
Three observations at approximately the same price
Imagine a displayed bid of 50 BTC near 60,000, a modelled liquidation band with relative intensity 80 near 59,800, and reported liquidations worth 2 million USDT during the previous minute. It is tempting to combine these into one “liquidity pool,” but doing so mixes current orders, model output and past events.
A valid investigation keeps them separate: does the bid persist through trades, what assumptions create the estimated band, and what reported forced flow actually occurred? The first can inform an execution scenario, the second a conditional risk scenario, and the third a description of observed events.
| Layer | Example value | What it establishes | What it does not |
|---|---|---|---|
| Displayed order book | 50 BTC bid | Visible resting size | Future fill availability |
| Estimated liquidations | Intensity 80 | Relative model output | Exact position inventory |
| Reported liquidations | 2m USDT | Covered forced-close events | Complete market-wide losses |
- 1Identify the layer
- 2Read units
- 3Check coverage
- 4Form a conditional scenario
A band disappearing is not proof of liquidations
A model may remove a projected level when price crosses it. A displayed order may be cancelled. A historical cell may fall outside retention or the selected range. These are different reasons for a visual change. Verify actual event data and the display's rules before saying that a visible pool was executed or that a known amount of traders lost money.
Before acting
- Identify displayed orders, estimated levels or reported events.
- Read units and relative-scale settings.
- Check venue coverage, timestamps and retention.
- Inspect the meaning of the exchange's reported liquidation price.
- Use the map as scenario context with a separate execution plan.
Check your understanding
An estimated band has intensity 95, while reported liquidations in the area total 1 million USDT. Can those values be added or used to calculate the remaining dollars at risk?
Show the explained answer
No. Relative intensity and reported currency amounts are different units. The model is not a ledger of private positions, and reported events may have limited coverage. Keep the observations separate and inspect the model and feed definitions.