Liquidity, order books and liquidations · 2 / 5
Track whether an order-book wall traded or disappeared
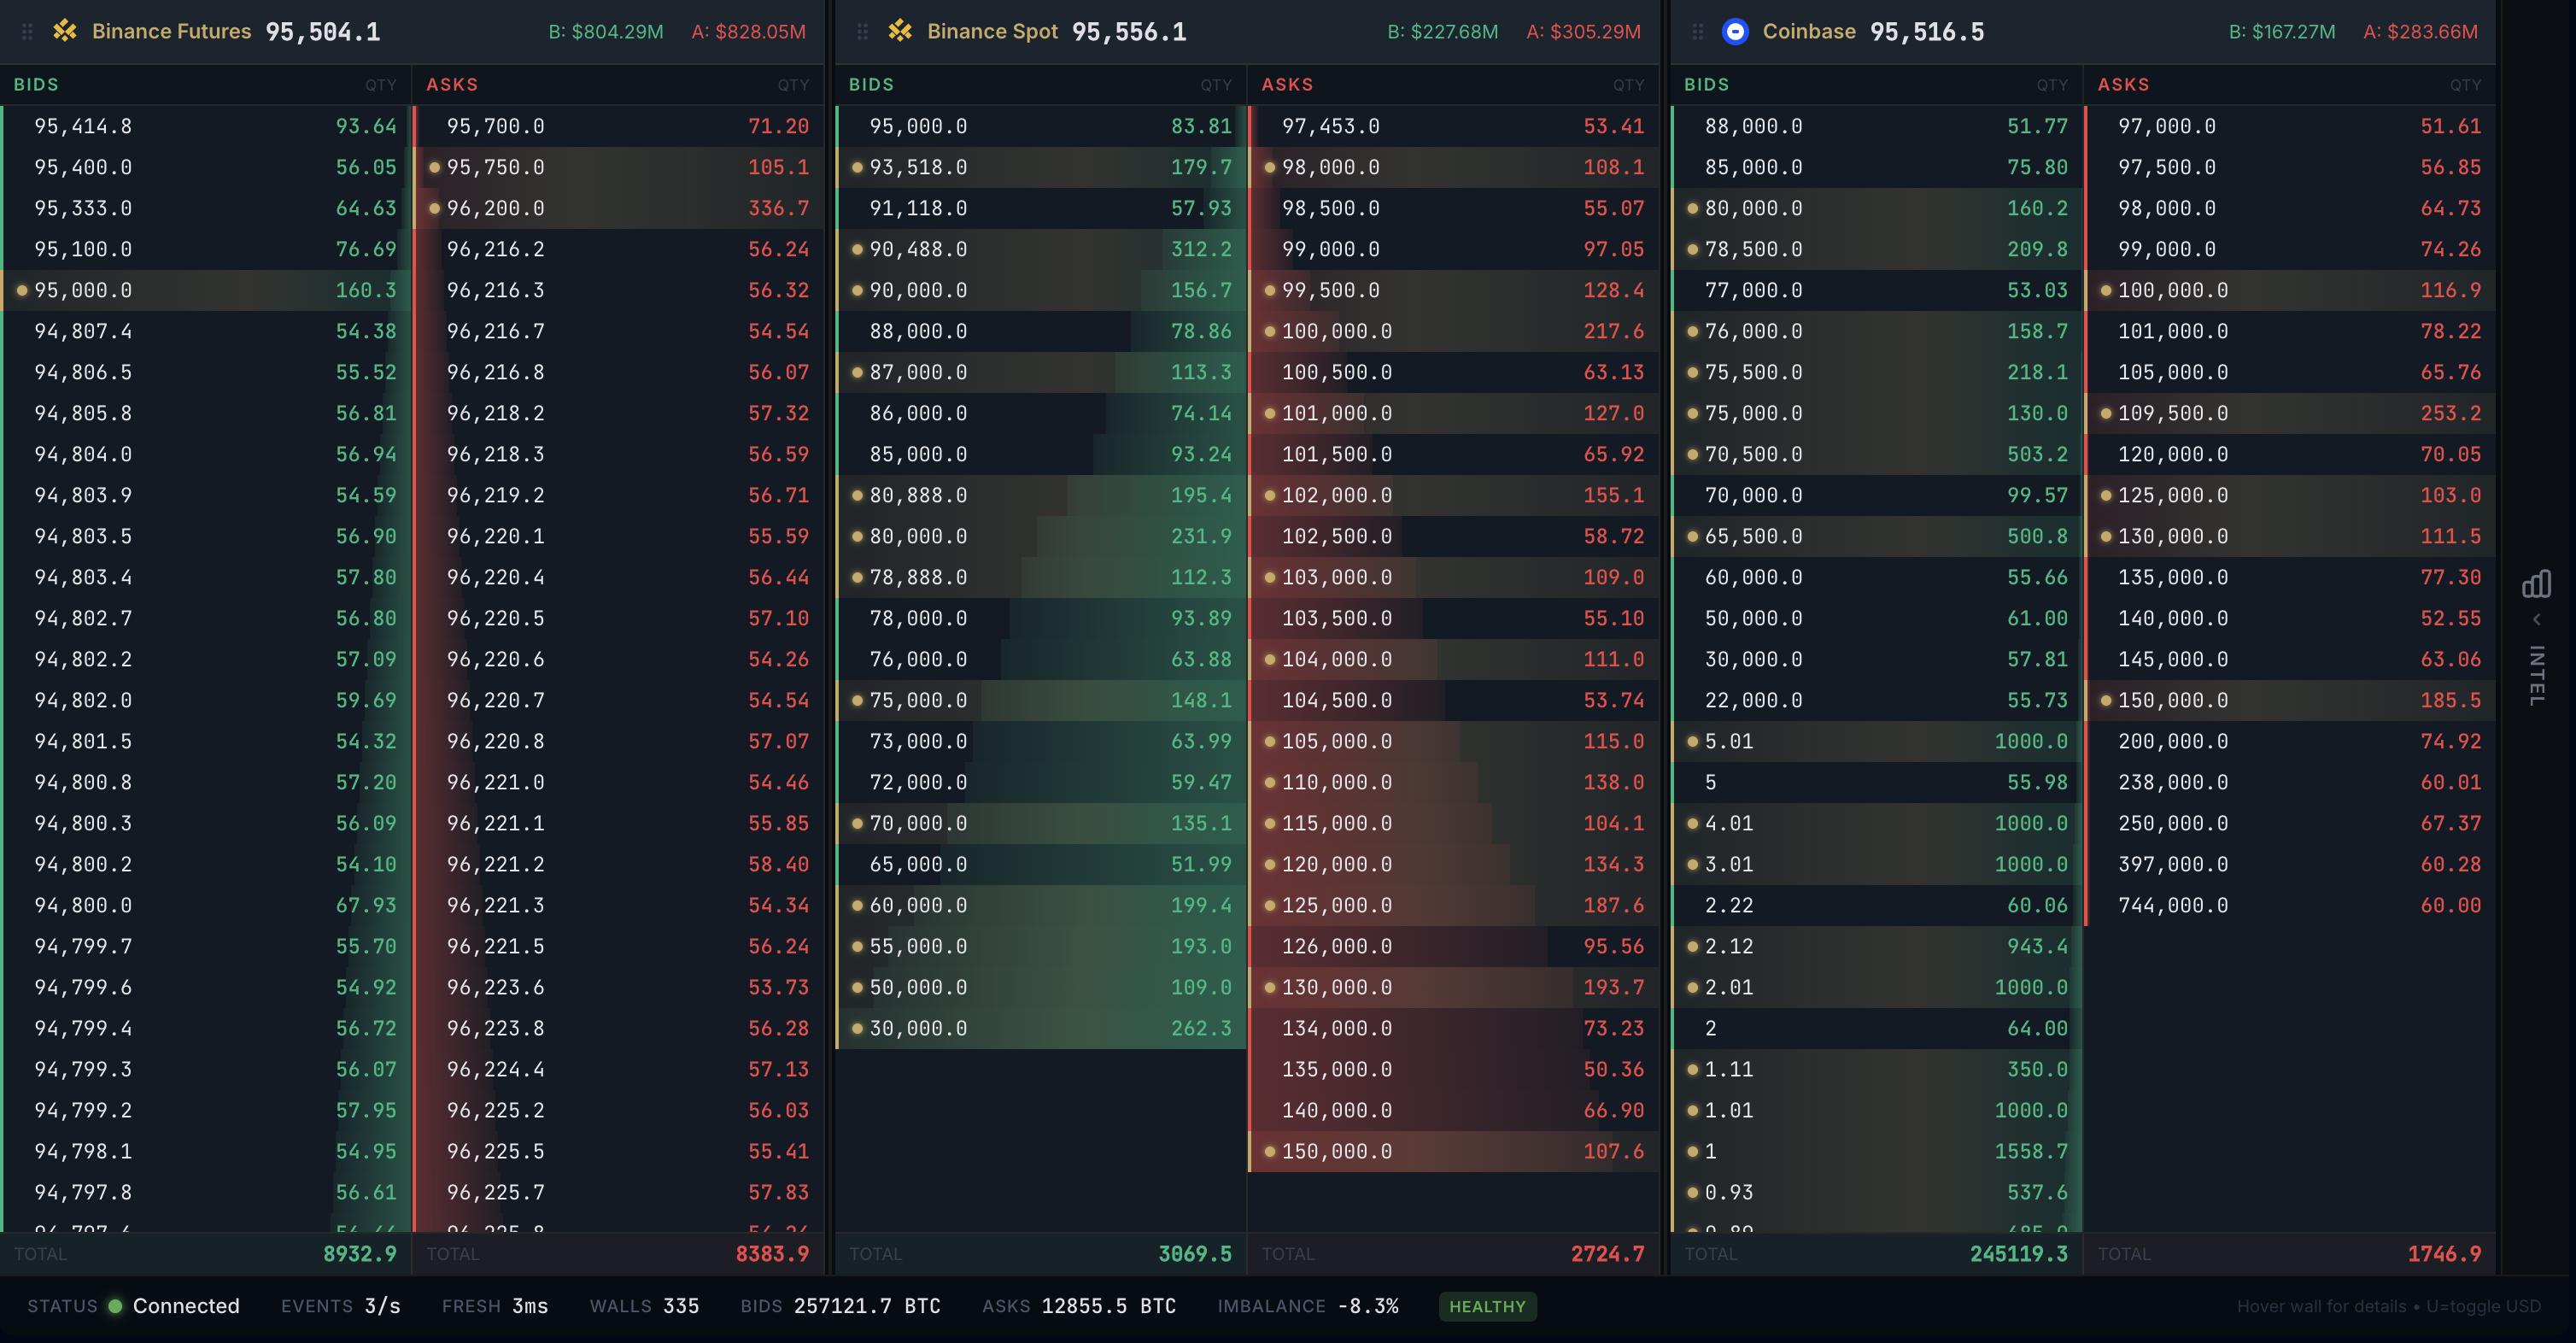
A wall is visible size at a price or grouped price bucket. Its disappearance can reflect trades, cancellations, repricing or a data update. To learn from the event, compare the book change with the executions instead of treating every reduction as buying or selling pressure.
Athenum8 minUpdated:
Use a conservation equation with explicit limits
For a fixed visible price level over an aligned interval, ending displayed size = starting size + additions − cancellations − executions against displayed size. Real feeds may not expose every component cleanly. Hidden quantity, aggregation, message ordering and missed deltas complicate the reconciliation. Use the equation as an audit model and state its assumptions.
An order-book update showing less size is not itself a trade. Check the execution feed for matching price, direction, size and timing. If the price bucket changes or the book is rebuilt from a snapshot, do not compare the old and new cell as though the same order population were continuously observed.
Persistence through execution is different from a large snapshot
A level that remains large after substantial executions may be replenishing. That can help describe available demand or supply, but public aggregated data rarely identifies a single owner. Several participants can add orders at the same price, and a displayed iceberg component can refresh.
Repeated cancellations near the touch may justify closer inspection, but they do not establish unlawful intent or a specific manipulation scheme by themselves. Market makers update quotes when risk, prices or inventory change. Describe the measurable behaviour—placement, cancellation, distance and executed quantity—before assigning a motive.
An 800-unit reduction is not 800 units of execution
A displayed ask begins with 1,000 units and ends with 200. The aligned tape shows 100 units of buyer-initiated executions against that level. Under the simplified complete-visible-book assumptions, cancellations minus additions must equal 700: 200 = 1,000 + additions − cancellations − 100.
You can call that a net displayed withdrawal of 700 units. You cannot know gross cancellations without also knowing additions. In a second interval, size stays at 1,000 despite 500 units executing. The same equation implies net additions of 500. That is evidence of replenishment at the aggregate level, not proof that one trader owns the wall.
| Measure | Shrinking wall | Replenishing level |
|---|---|---|
| Starting displayed size | 1,000 | 1,000 |
| Executed against level | 100 | 500 |
| Ending displayed size | 200 | 1,000 |
| Additions minus cancellations | −700 | +500 |
- Net change from orders: A
- -700 units
- Net change from orders: B
- 500 units
A wall far from price may be irrelevant to your execution
Large distant size attracts attention, but an order executing near the current market consumes nearby depth first. A wall several percent away may cancel long before it matters. Analyse distance, persistence and the path to the level. Do not infer a narrow spread or a safe stop from a filtered list of large orders.
Before acting
- Fix venue, side, price bucket and observation window.
- Align book messages with actual executions.
- Distinguish net order changes from gross cancellations.
- Check snapshot resets, hidden-size limitations and missing updates.
- Describe behaviour without asserting an unobservable owner or motive.
Check your understanding
Size starts at 600, 250 units execute and size ends at 500. What net additions-minus-cancellations does the simplified model imply?
Show the explained answer
500 = 600 + net additions − 250, so net additions are +150 units. Gross additions could be larger if cancellations also occurred. This conclusion assumes complete, aligned observations of the same visible level.