Order flow and CVD: absorption, footprints and data quality · 2 / 5
Distinguish absorption from exhaustion in order flow
A price that stops falling can reflect substantial buying against aggressive sellers, or simply a decline in selling activity. Those are different mechanisms. The chart's shape alone cannot tell you which one occurred.
Athenum8 minUpdated:
What absorption and exhaustion mean in executed flow
A candidate sell-side absorption event has substantial seller-initiated trading but limited downward progress over a stated window. Passive bids, including replenishing orders, may be meeting the selling. The useful observation is large executed pressure with a muted price response, not the assumption that a particular institution is defending a level.
Exhaustion instead describes fading aggressive participation. Price may stop declining because fewer sellers continue to cross the spread. Low activity can precede a reversal, a pause or another leg down once sellers return. Absorption and exhaustion can occur in sequence, but neither label by itself establishes a profitable entry.
Measure volume, delta and price response in one window
Compare flow and price over the same duration, instrument and venue set. A 300-unit trade burst is not large merely because the number looks large; compare it with normal activity for that market and session. Record total volume as well as delta. A small net delta can hide very active two-way trading.
Watch what happens after the pressure meets the level. Does price regain a predefined boundary? Do bids replenish after actual executions, or does displayed liquidity disappear? Can sellers push through on the next attempt? These observations help reject the hypothesis, whereas naming an invisible “whale” adds no testable information.
Example: 100 to 99.95 on 300 vs 30 units of volume
Prices in this example are USD per asset unit; all volumes are asset units. In two hypothetical one-minute windows, price moves from 100 to 99.95. Window A contains 270 units of aggressive selling and 30 of aggressive buying: total volume 300, delta −240. Window B contains 19 units of selling and 11 of buying: total volume 30, delta −8.
Window A is compatible with absorption if that selling is unusually large and bids hold through executions. Window B is compatible with exhaustion if activity has faded from the preceding decline. The equal price change does not make the mechanisms equal. For either case, require a separately specified price response before testing a reversal trade.
| Measure | Window A | Window B |
|---|---|---|
| Price change | −0.05 | −0.05 |
| Aggressive sell volume | 270 | 19 |
| Aggressive buy volume | 30 | 11 |
| Total volume | 300 | 30 |
| Delta | −240 | −8 |
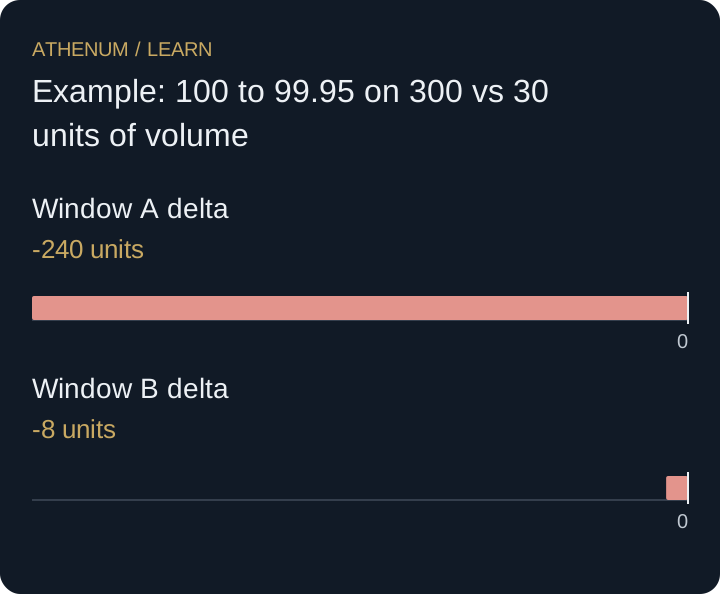 Open full-size diagram
- Window A delta: -240 units
- Window B delta: -8 units
Absorption can fail when replenishment stops
Repeated heavy selling at a stable price may consume available demand. If bids stop replenishing, the next sell wave can move price sharply lower. The earlier absorption observation was not necessarily false; the condition changed. A trade plan needs invalidation and executable risk controls rather than a belief that a defended level must hold forever.
Before acting
- Measure price response and executed flow over the same interval.
- Compare volume and delta with a relevant activity baseline.
- Distinguish executed liquidity from displayed size alone.
- Specify a reclaim or continuation test and its failure level.
- Reassess when replenishment or feed coverage changes.
Check your understanding
Price is flat, total volume is high and delta is nearly zero. Is this proof of sell-side absorption?
Show the explained answer
No. Heavy two-way trading can produce near-zero net delta without a one-sided selling-pressure event. Inspect the sequence, level-specific trades and price response. Absorption is a contextual hypothesis; high volume plus a flat candle is insufficient by itself.
Sources and further reading
Continue with Athenum
From the Athenum blog
Taker vs Maker Flow: Reading Aggressive Order Flow and CVD in Crypto
Related lessons
- Define breakout acceptance before the breakout happens
Write a close-and-retest rule before the breakout, such as two five-minute closes and a retest. Account for the delay and keep failed breakouts in the sample.
- Volume delta: compare candle estimates with taker-side trades
Two tools called volume delta can disagree: +10 estimated from candles versus −2 from taker-side trades. Compare both on the same trades first.