Order book liquidity and liquidation heatmaps · 5 / 5
Plan a liquidity sweep and reclaim as a testable setup
A wick beyond an old high or low is easy to label after the fact. A useful sweep study specifies the reference level and the required return before the wick forms. That turns a visually appealing pattern into a rule that can be evaluated, including the times it fails.
Athenum8 minUpdated:
Define the sweep and reclaim from price, not hidden stops
For a downside sweep, choose a previously established low or range boundary. State how far or by what price rule the market must trade below it, then define what counts as a reclaim. A completed close, a minimum time above the level and a successful retest are different conditions; choose one coherent version before collecting results.
The term sweep does not prove that stop orders were present or that one actor intentionally hunted them. Public price and trade data establish where trading occurred. Reported liquidations or a burst of aggressive flow can add context, but private stops remain unknown. Use precise price behaviour in the entry rule so the study does not depend on an unobservable story.
Set an executable invalidation, target and holding period
For a long reclaim hypothesis, a return below the defended area may invalidate the idea. Translate that into an order plan, allowing for trigger differences and slippage. If the invalidation is so close that normal spread consumes most of the risk budget, the apparent reward/risk ratio is fragile.
Define the target from an observable opposing area and record the maximum holding period. A setup should not become a long-term investment because its expected short-term response failed. Check event timing, correlated positions and nearby depth before entry. Skipping a reclaim that cannot be executed within the risk budget is a valid outcome.
Example: reward/risk falls from 2 to 1.5 after costs
Use linear price P&L in USDT per asset unit, with zero funding and borrowing costs in this illustration. Entry, invalidation and target are reference prices before execution costs. If you calculate P&L from actual fills instead, their spread and slippage effects are already included; do not subtract those effects again.
Use a hypothetical prior low at 100. Price trades to 99.40 and then meets your completed-close reclaim condition. Assume entry at 100.20, invalidation at 99.20 and target at 102.20. Gross risk is 1.00 per unit and gross reward is 2.00.
If round-trip fees and adverse execution total 0.20 per unit in either outcome, a winner nets 1.80 and a loser costs 1.20. Net reward/risk is 1.80 ÷ 1.20 = 1.5, not 2. A separate failed path that remains below 100 never triggers this reclaim version, even if it later rallies. Record it as nonqualifying rather than retroactively moving the entry.
| Outcome | Gross P&L | Costs | Net P&L |
|---|---|---|---|
| Target at 102.20 | +2.00 | 0.20 | +1.80 |
| Exit at 99.20 | −1.00 | 0.20 | −1.20 |
| No reclaim | No entry | No assumed trade | Not a win or loss |
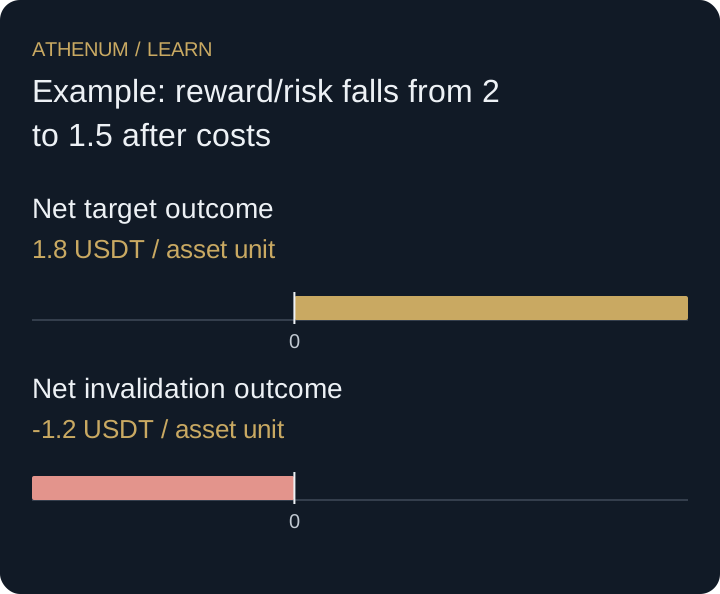 Open full-size diagram
- Net target outcome: 1.8 USDT / asset unit
- Net invalidation outcome: -1.2 USDT / asset unit
Mistake: mistaking a real breakdown for a reclaim attempt
If price spends sustained time below the old low, calling every small bounce a reclaim attempt can produce repeated losses. A genuine breakdown and a brief excursion initially look similar. Your acceptance rule and maximum number of attempts should separate them. Re-entry is a new decision with new costs, not a free continuation of the first idea.
Before acting
- Choose the reference level before the excursion.
- Specify the sweep and reclaim conditions in observable terms.
- Set invalidation, target, holding period and permitted attempts.
- Recalculate outcomes after fees, spread and stressed slippage.
- Log failed and nonqualifying paths as well as attractive reversals.
Check your understanding
Keep gross reward of 2.00 and gross risk of 1.00, but costs rise to 0.40 per unit. What is net reward/risk?
Show the explained answer
The winner nets 1.60 and the loser costs 1.40. Net reward/risk is 1.60 ÷ 1.40 ≈ 1.14. A visually unchanged chart setup can become much less attractive when execution deteriorates; its win rate must still be measured independently.
Sources and further reading
Continue with Athenum
From the Athenum blog
Liquidity Sweeps and Stop Hunts: Reading Them in the Liquidation Heatmap and Order Book
Related lessons
- Test a trapped-trader hypothesis without inventing positions
Frame a trapped-trader hypothesis with a fixed range, normalised open interest and price response. Separate supporting evidence from proof of entries or stops.
- Measure what an extra trading confirmation adds
Compare a fixed signal with and without a filter. Keep rejected opportunities and costs instead of counting correlated indicators as independent votes.