Position sizing and leverage: risk, stops and fees · 3 / 5
Calculate trading expectancy after fees and slippage
A target twice as far away as the stop does not establish a profitable strategy. You also need the frequency of wins, actual average outcomes and the cost of taking every trade. Expectancy brings those quantities into one calculation.
Athenum7 minUpdated:
Trading expectancy formula in R, including costs
Let 1R mean the planned price-risk amount at entry in this example, before costs. Other journals define R after costs; either convention can work, but mixing them cannot. Measure realised winners and losers in the same units. A nominal 2R target may produce only a 1.4R average winner after partial exits and early closes.
If p is win probability, W the average winning amount, L the positive magnitude of an average loss and C the average cost per trade, net expectancy is p × W − (1 − p) × L − C. If recorded P&L already includes fees, do not subtract those fees again. Funding can be a payment or receipt; use the signed realised contribution. In this example W and L are outcomes at reference prices before execution costs, and every observation is a filled win or loss. With actual fill prices, spread and slippage are already in gross price P&L: subtract only fees and other cash costs not yet included. Keep zero outcomes and unfilled opportunities in a separate opportunity-level average; they cannot all be counted as losses with magnitude L.
Estimate win rate and costs from executable trades
Estimate the inputs from a clearly defined sample. Include stopped trades, missed fills and the cost of cancelled attempts where applicable. A backtest that buys at a candle's exact low and exits at its exact high without an executable order sequence overstates the outcomes before expectancy is even calculated.
A positive sample average is an estimate, not a promise. Results can depend on a handful of outliers, one volatility regime or one exchange's execution quality. Examine the distribution, consecutive losses and separate time periods. A strategy with a small positive mean may still have a drawdown larger than the account can tolerate.
Example: 40% win rate, 2R winners, 0.25R costs
Assume 1R = 100 USDT, 40 wins of 2R and 60 losses of 1R across 100 hypothetical trades. Gross expectancy is 0.4 × 2 − 0.6 × 1 = 0.2R. Average round-trip fees of 10 USDT, adverse execution of 10 and funding payments of 5 sum to 25 USDT, or 0.25R, per trade.
Net expectancy is therefore −0.05R, equivalent to −5 USDT per trade or −500 across the sample. For fixed W, L and C, the break-even win rate is (L + C) ÷ (W + L). Here it is 1.25 ÷ 3 = 41.67%. Changing the holding period or order style can change both costs and the win rate, so optimise the whole process rather than one input in isolation.
| Component | R | USDT |
|---|---|---|
| Winning contribution | +0.80 | +80 |
| Losing contribution | −0.60 | −60 |
| Trading costs | −0.25 | −25 |
| Net expectancy | −0.05 | −5 |
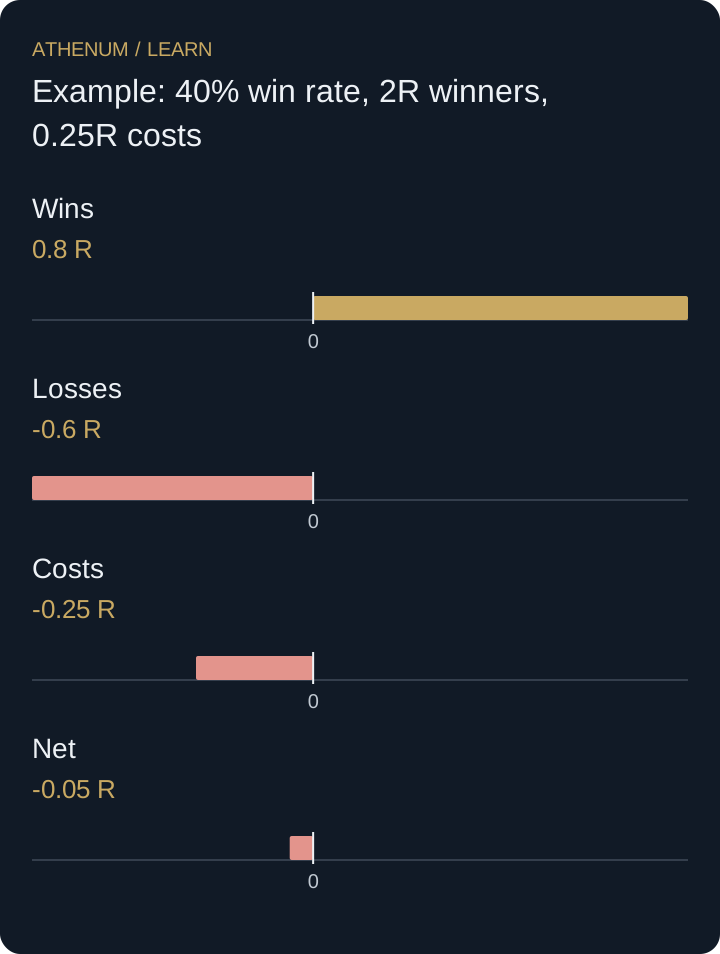 Open full-size diagram
- Wins: 0.8 R
- Losses: -0.6 R
- Costs: -0.25 R
- Net: -0.05 R
Why lower maker fees can reduce expectancy
Replacing market entries with limit orders can reduce fees but introduce missed fills and adverse selection. Your order may fill most often just before price moves against it. If average winners shrink or losing fills become more common, the lower fee may not improve net expectancy. Compare executable variants on the same opportunities, including those that do not fill.
Before acting
- Keep gross and net outcomes separate and avoid double-counting costs.
- Use average realised winners and losses rather than advertised targets.
- Include all eligible attempts, with a documented fill rule.
- Check whether a few trades or a single market regime drive the result.
Check your understanding
Keep the 40% win rate, 2R winner and 1R loser, but reduce average costs to 0.10R. What is net expectancy and the break-even win rate?
Show the explained answer
Net expectancy becomes 0.80 − 0.60 − 0.10 = +0.10R. Break-even is (1 + 0.10) ÷ (2 + 1) = 36.67%. This is a conditional calculation; the improvement is credible only if the execution change preserves the assumed outcome distribution.
Sources and further reading
Continue with Athenum
From the Athenum blog
How to Calculate Crypto Futures PnL: Entry, Exit, Funding, and Fees
Related lessons
- Profit factor: check whether one winner carries the result
A profit factor of 2 can depend on a single winner. Calculate profit factor from net trade outcomes, then inspect concentration without deleting real trades.
- Map cost-adjusted break-even zones without inventing stops
Calculate long and short break-even zones from a hypothetical entry range. Include trading fees and funding while keeping the uncertainty about actual entries.