Order flow and data quality · 3 / 5
Compare spot CVD with perpetual flow correctly
Spot and perpetual markets can show different aggressive flows during the same price move. That difference can be useful context, but a larger number in the perpetual panel does not automatically make derivatives the dominant force. First make the measurements comparable.
Athenum8 minUpdated:
Match the basis of comparison
Choose the same time window, quote-currency convention and classification method. Convert each trade to quote notional at its execution price if that is your chosen unit. Document the spot and perpetual venue sets separately. If one important venue is unavailable, the aggregate has changed even if its label has not.
Compare both net delta and total traded notional. Delta divided by total classified volume gives a signed imbalance fraction between −1 and +1, provided the same trades contribute to numerator and denominator. It describes relative aggressor imbalance, not capital inflow, unique buyers or the amount of new leverage entering.
Divergence generates questions, not a ranking of smart money
Spot buying with perpetual selling can reflect hedging, basis trading, short entry or long exit. Perpetual buying with weak spot flow can reflect speculative demand, short covering or activity on omitted spot venues. Calling one group informed and another uninformed is not justified by the instrument type.
Follow the price response and examine OI, basis and funding as separate observations. A move that persists across several spot venues while derivatives positions contract supports a different hypothesis from a move concentrated in one perpetual market. These are ways to investigate the structure, not rules that guarantee a reversal or continuation.
Different raw deltas, different activity scales
Over the same ten minutes, the selected spot venues record 12 million USDT of aggressive buys and 9 million of sells. Delta is +3 million on 21 million total volume, or +14.29%. Perpetual venues record 40 million of buys and 50 million of sells: delta −10 million on 90 million volume, or −11.11%.
The perpetual net figure is larger in absolute money terms, but spot has the larger signed imbalance magnitude relative to its own activity. Neither comparison alone identifies price leadership. If a spot venue drops out halfway through, mark the interval incomplete rather than comparing the resulting smaller aggregate as if coverage were unchanged.
| Measure | Spot | Perpetuals |
|---|---|---|
| Aggressive buys | 12 | 40 |
| Aggressive sells | 9 | 50 |
| Net delta | +3 | −10 |
| Total volume | 21 | 90 |
| Delta / volume | +14.29% | −11.11% |
- Spot imbalance
- 14.29 %
- Perpetual imbalance
- -11.11 %
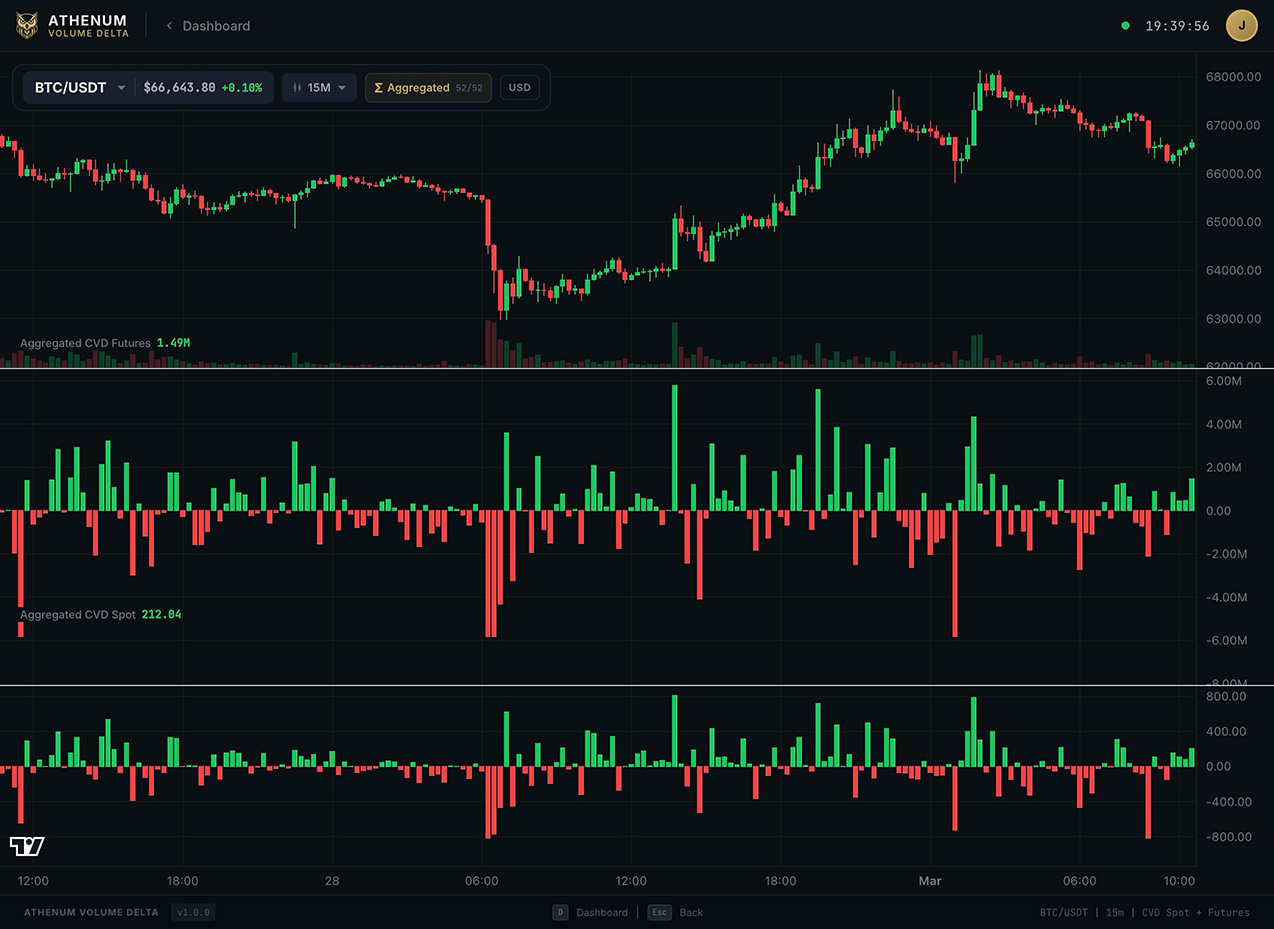
Auto-scaled panels can exaggerate agreement
Two plots may occupy the same height on screen while representing very different amounts. A small spot fluctuation can visually match a much larger perpetual fluctuation if each axis rescales independently. Read units and axis values, and compare changes numerically over the same interval rather than matching shapes by eye.
Before acting
- Match timestamps, quote units and trade-classification conventions.
- List the included and unavailable venues for each product.
- Read total volume alongside net delta.
- Check independent chart scales and reset points.
- Use OI and price response to test alternative explanations.
Check your understanding
Spot delta is +2 million on 10 million total volume; perpetual delta is +8 million on 100 million. Which has the larger raw delta and which has the stronger relative imbalance?
Show the explained answer
Perpetuals have the larger raw delta: +8 million. Spot has the stronger relative imbalance: 2 ÷ 10 = 20%, versus 8 ÷ 100 = 8%. Neither result alone proves price leadership or new unhedged buying.