Table of Contents6 sections
- How often is a perpetual's funding actually charged?
- Why does the same Bitcoin perp show a different funding rate on each exchange?
- How do you compare funding rates across exchanges fairly?
- What did the cross-exchange funding spread look like on 2026-07-19?
- Which venue should you weigh for a long or a short?
- The short version
Practise with worked lessons
- Compare hourly and eight-hour funding on equal terms
A 0.005% hourly rate costs twice as much as 0.02% every eight hours. Normalise funding to one horizon and keep snapshot APR apart from account returns.
TLDR. Funding rate intervals are the schedule on which a perpetual charges funding, and they are not the same on every exchange. Most venues settle funding every 8 hours, three times a day at 00:00, 08:00 and 16:00 UTC, but some charge it every 1 hour, so the raw number on the screen is not comparable across venues until you annualize it. As of 2026-07-19 08:00 UTC, with BTC near $64,651, Athenum's cross-exchange feed showed live Bitcoin perpetual funding running from 0.00100% per 8h on Bitget to 0.01000% per 8h on Bybit, while Hyperliquid printed 0.00125% per 1h. Normalized to an annual rate, that is roughly +1.1% APR on the calmest venue to about +11.0% APR on the richest, even though Hyperliquid's raw number looks like one of the smallest on the board. The cross-exchange composite sat near +6.5% APR. The rule: compare the annualized rate, never the raw per-interval number.
How often is a perpetual's funding actually charged?
Funding is exchanged directly between longs and shorts on a fixed schedule called the funding interval, and the market standard is every 8 hours, settled at 00:00, 08:00 and 16:00 UTC, so an open position is charged three times a day. That standard is not universal. Some venues run a 4-hour interval on faster-moving contracts, and Hyperliquid charges funding every single hour, which is 24 times a day. If you are new to perpetuals, the Athenum guide to how perpetual futures work covers how funding keeps the perp pinned to spot. The interval matters because the rate you see quoted is the rate for one interval, not for a day and not for a year.

How often funding is charged: the fixed-clock venues stamp it 3 times a day, Hyperliquid every hour, 24 times a day.
Why does the same Bitcoin perp show a different funding rate on each exchange?
Two reasons. First, positioning differs: funding is set by how crowded longs are versus shorts on that specific venue, so a venue whose traders lean more aggressively long prints a higher rate. Second, and more easily missed, the interval differs, so two venues can charge the same annual cost while showing very different headline numbers. As of 2026-07-19 08:00 UTC, Athenum's cross-exchange feed read live Bitcoin perpetual funding of 0.00100% on Bitget, 0.00669% on OKX, 0.00707% on Binance and 0.01000% on Bybit, all quoted per 8 hours, while Hyperliquid printed 0.00125% per 1 hour. Read raw, Hyperliquid looks like nearly the cheapest venue on which to hold a long. That reading is wrong.
How do you compare funding rates across exchanges fairly?
Convert every rate to an annual percentage rate with one formula: APR = rate per interval x intervals per day x 365. An 8-hour venue has three intervals a day, so you multiply its rate by 1,095; a 1-hour venue has 24, so you multiply by 8,760. Applied to the 2026-07-19 snapshot, the picture reorders.
Venue | Raw funding (2026-07-19) | Funding interval | Payments per day | Annualized (APR) |
|---|---|---|---|---|
Bitget | 0.00100% | 8 hours | 3 | +1.10% |
OKX | 0.00669% | 8 hours | 3 | +7.33% |
Binance | 0.00707% | 8 hours | 3 | +7.74% |
Bybit | 0.01000% | 8 hours | 3 | +10.95% |
Hyperliquid | 0.00125% | 1 hour | 24 | +10.95% |
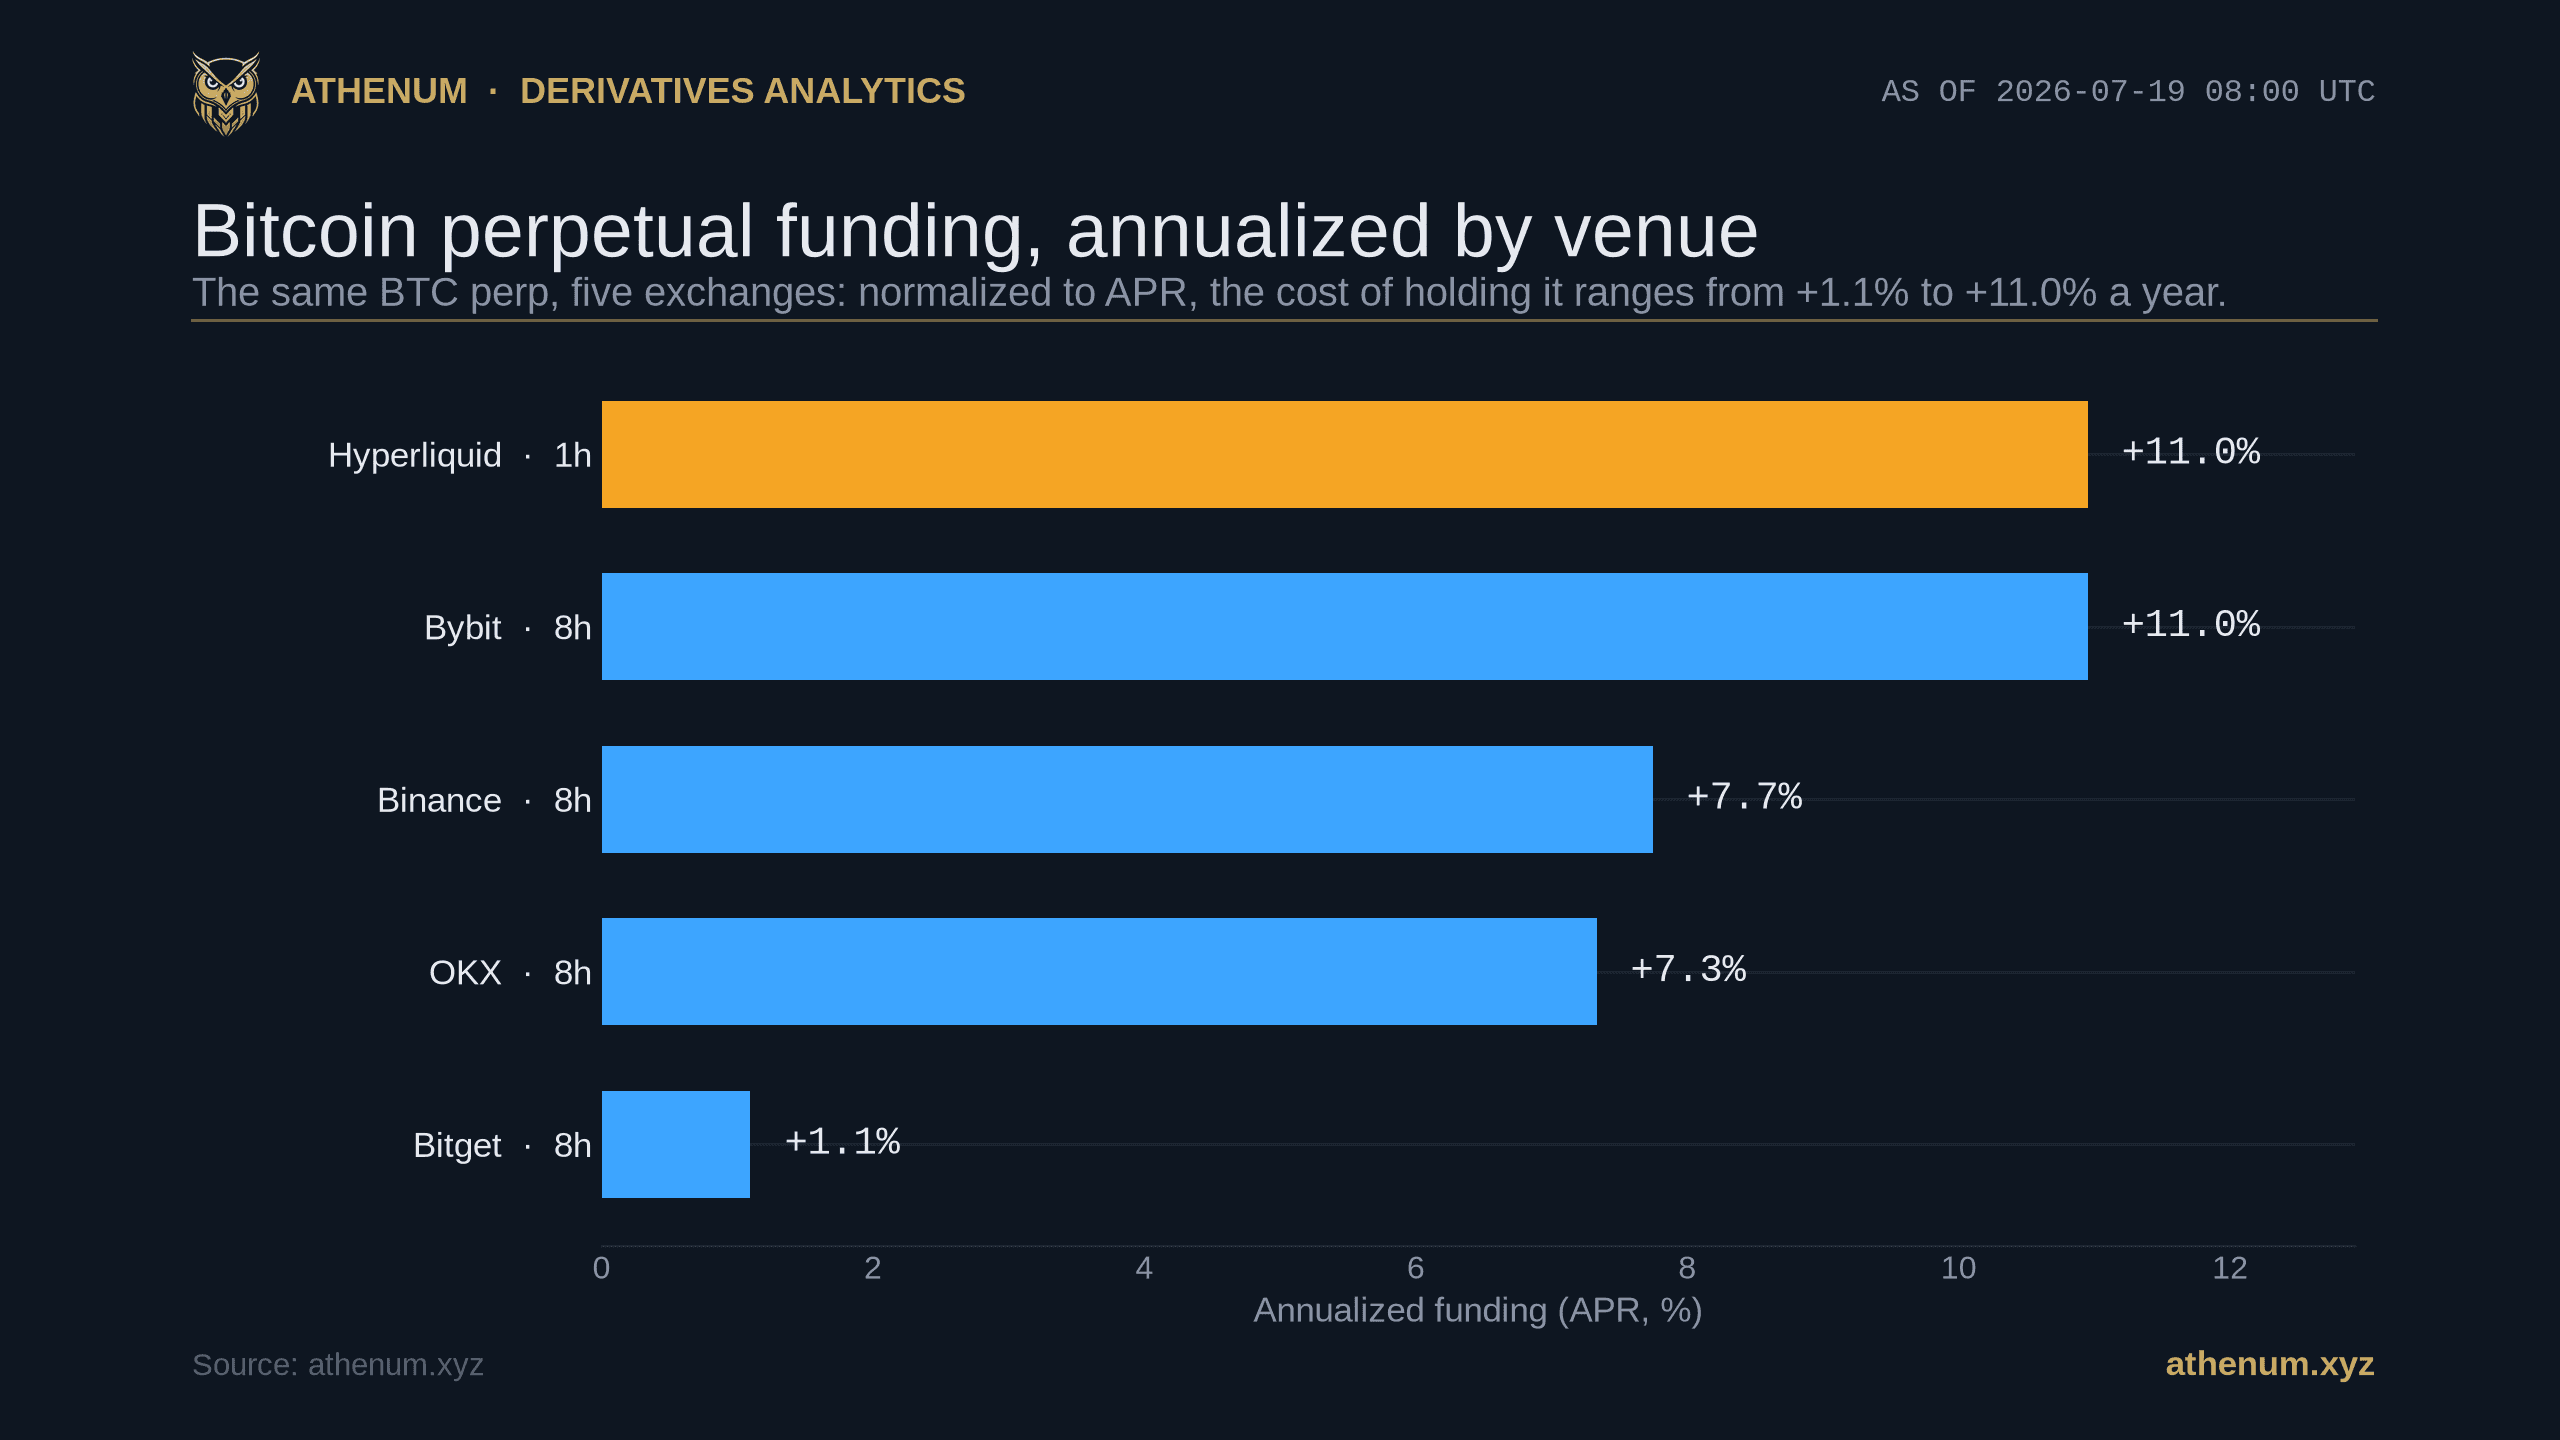
Bitget's 0.00100% per 8h becomes about +1.10% APR, Binance's 0.00707% becomes +7.74%, and Bybit's 0.01000% becomes +10.95%. Hyperliquid's tiny-looking 0.00125% per 1h becomes +10.95% too, tied with Bybit, because it is charged eight times as often. The venue that looked cheapest on the raw board on 2026-07-19 is actually tied for the most expensive to hold.

Raw rate versus annualized APR: Hyperliquid's small 0.00125% per 1h annualizes to +10.95%, tied with Bybit for the highest.
For the mirror-image question, how to collapse all of these venues into one honest number weighted by open interest, see our OI-weighted funding rate post. You can price the annual carry of any position yourself in the free funding rate calculator.
What did the cross-exchange funding spread look like on 2026-07-19?
On 2026-07-19, normalized to APR, Bitcoin perpetual funding ranged from about +1.1% a year on the calmest venue to about +11.0% on the richest, a spread of roughly ten percentage points across venues that all track the same asset. The cross-exchange composite, the market's blended cost of leverage, sat near +6.5% APR: comfortably positive, but nowhere near the 20% to 40% annualized readings that mark a euphoric, crowded long. A wide venue-to-venue spread like this is itself a signal. It is where funding-rate arbitrage lives, and it tells you positioning is not uniform across the market.

Aggregate Bitcoin perp funding annualized over the last 7 days to 2026-07-19, ending near +6.5% APR.
Which venue should you weigh for a long or a short?
Once every rate is on an APR basis, the practical question is where the same position costs the least, or earns the most. If you are paying funding, which a long does while funding is positive, you want the venue with the lowest annualized rate on your side after fees. On 2026-07-19 a long paid the least on Bitget at about +1.1% a year and the most on Bybit or Hyperliquid at roughly +11.0%, a real gap in carrying cost for the identical exposure. If you are collecting funding, which a short does while funding is positive, the logic inverts and the richest venue pays best. Two cautions keep this honest. First, funding is only one leg of the cost: taker fees, spreads and available liquidity matter too, and a thin venue can erase a funding edge on the way in and out. Second, funding is not fixed. It resets every interval and can flip sign, so a venue that looks cheap now may not be in eight hours, and Hyperliquid re-prices every hour. Anchor the decision to the annualized rate and re-check it each interval rather than trusting a single snapshot.
The short version
The funding rate on your screen is priced per interval, and the interval is not the same everywhere: 8 hours on most venues, 1 hour on Hyperliquid. Never compare the raw numbers side by side. Annualize each one, rate per interval times intervals per day times 365, and compare APR instead, and the ranking can flip: on 2026-07-19, Hyperliquid's 0.00125% per hour was one of the most expensive perps to hold at +10.95% APR, not one of the cheapest.
You can pull every funding figure in this post yourself from one screen: Athenum streams live derivatives data across 14 exchanges into a single normalized terminal and keeps all 34 calculators free, with no account, no email and no usage limits. Price a position's annual carry in the free funding rate calculator, then open the live Athenum terminal to watch funding move across venues in real time.
One terminal. All the data.
Liquidations, orderbook depth, whale walls & open interest from 4 exchanges, all real-time, in one place.
No credit card required

Athenum Analytics
Athenum Analytics is our three-person editorial team covering crypto derivatives, market data and macroeconomic context.