Audit the construction of auction profiles · 4 / 5
TPO vs volume profile: compare time counts and traded size
Repeated participation across time blocks and concentrated traded size answer different questions. Construct both measurements from a shared ledger before calling one profile more accurate than the other.
Athenum7 minUpdated:
Define exactly what one cell counts
Assume three fixed, equal-duration blocks A, B and C. Each table cell contains the complete base-unit quantity traded at one exact price within that block. A positive cell contributes one time-price opportunity, or TPO, under this teaching model. Zero means no trade occurred. We do not interpolate activity across a candle's high-low range or assume intermediate prices traded.
For the volume profile, add the quantities across each price row. For the TPO profile, count its occupied blocks instead. Those operations share the same input population but use different weights. A real platform's sampling and price-row rules still need checking before comparing its output to this exact-price occupancy model.
Do not interpret block participation as exact duration
A brief visit and many repeated trades inside the same block both occupy one cell in this model. TPO count therefore does not measure exact seconds at price. Changing the block length or alignment can change occupancy, so record those settings together with the profile window and price grid.
Volume measures quantity, not a count of distinct traders or surviving positions. Neither profile supplies that missing account-level information. A disagreement between their maxima can be entirely consistent with the same ledger; it is not automatically evidence that one feed is wrong or that price should move toward one of the two levels.
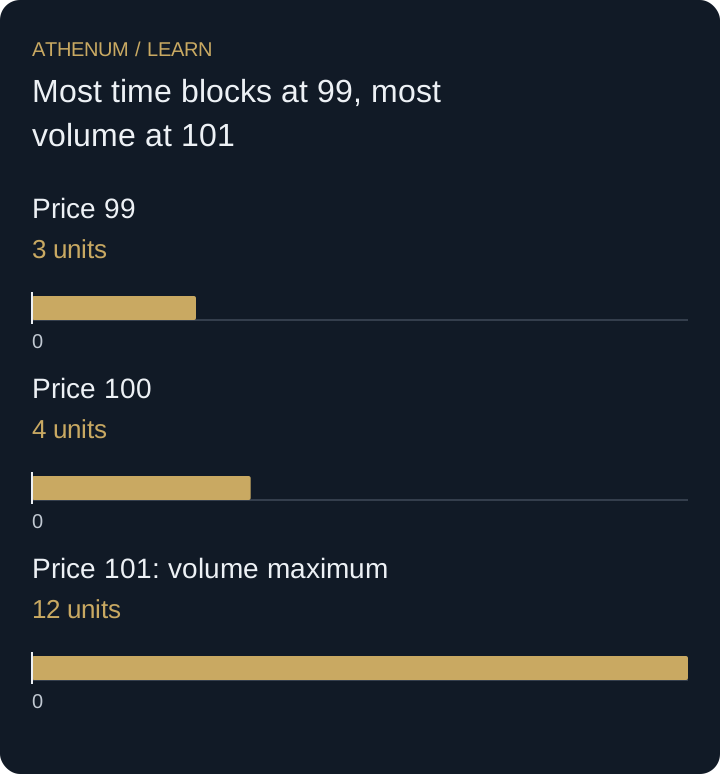
Most time blocks at 99, most volume at 101
Price 99 is occupied in A, B and C, giving 3 TPOs and 3 units. Price 100 appears in A and B, giving 2 TPOs and 4 units. Price 101 appears only in C, giving 1 TPO but 12 units. The TPO maximum is therefore 99, while the volume maximum is 101.
Total TPO count is 6 and total volume is 19 units. Keep those denominators separate. There is no meaningful combined total of 25 units of activity. Compare the occupancy pattern with traded size without placing both measures on an unlabelled common scale.
| Price USD/unit | A volume | B volume | C volume | TPO count | Total volume |
|---|---|---|---|---|---|
| 99 | 1 | 1 | 1 | 3 | 3 |
| 100 | 2 | 2 | 0 | 2 | 4 |
| 101 | 0 | 0 | 12 | 1 | 12 |
 Open full-size diagram
- Price 99: 3 units
- Price 100: 4 units
- Price 101: volume maximum: 12 units
Unknown is not an empty cell
Our zeros are explicit statements about a complete hypothetical ledger. A gap in real historical data cannot safely be replaced by zero. That substitution could remove a TPO as well as volume and make an apparent difference between profiles into a collection error. Establish completeness before interpreting occupancy.
Before acting
- Fix time-block duration, alignment and price rows.
- Distinguish a known zero from missing data.
- Count each occupied price/block cell once for TPO.
- Sum actual quantities separately for volume.
- Avoid trader-count, position-inventory and forecast claims.
Check your understanding
Add 9 more units at price 101 within its already occupied block C. What changes in the two profiles?
Show the explained answer
Volume at 101 rises from 12 to 21 and total volume from 19 to 28. Its TPO count stays at 1, and total TPO count stays at 6 because no new price/block cell is occupied. The TPO maximum remains 99 and the volume maximum remains 101. More quantity within an existing occupied cell need not change time-block participation.