Audit the construction of auction profiles · 5 / 5
Volume profile row size: test how price bins change the chart
A moving POC line can reflect a different grouping of unchanged trades. Test bin width and grid origin separately, and distinguish a maximum interval from the coordinate used to draw it.
Athenum8 minUpdated:
Fix the ledger, then vary the measurement
Use a complete hypothetical ledger of 4 units at 100, 7 at 101, 8 at 102 and 2 at 103, with prices in USD per unit. It contains 21 units and an actual price-times-volume sum of 2,129 USD. Hold those trades, their source and their observation window fixed throughout the comparison. Only the price grid changes.
Specify both bucket width and origin. Every interval here includes its left endpoint and excludes its right endpoint: a trade at 102 belongs to [102,104), not [100,102). Changing width changes how many prices combine. Shifting the origin at fixed width changes which neighbouring prices combine. Both can alter the largest bucket while conserving total volume.
Separate an interval from its displayed coordinate
Report the maximum bucket with its full interval and volume. If a chart draws a line at that bucket's midpoint, also state that convention. A midpoint can be a price at which no trade occurred. It is a representative drawing coordinate, not proof that all volume in the interval transacted there.
Actual trade-level VWAP remains 2,129 ÷ 21 ≈ 101.380952 for every grid in this exercise. Replacing each trade price with its bucket midpoint creates a grouped approximation instead. Retaining the actual price-times-volume sum within each bucket, as well as its volume, preserves the original VWAP when buckets are merged.
Three grids, the same 21 units
At width 1 and origin 100, the maximum interval is [102,103) with 8 units. At width 2 and the same origin, volumes at 100 and 101 combine to 11, exceeding the 10 units in [102,104). The maximum interval is now [100,102), despite no change in trades.
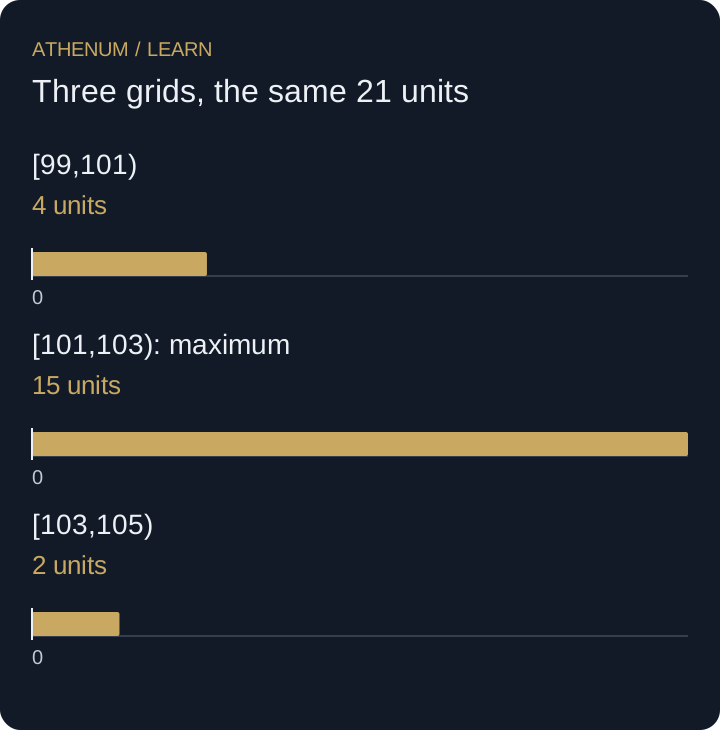
Keep width 2 but shift the origin to 99. The intervals hold 4, 15 and 2 units; [101,103) is now the maximum. Midpoint display coordinates for the three maximum buckets are 102.5, 101 and 102 respectively. The first coordinate was not an executed price in this ledger.
| Width | Origin | Occupied buckets: volume | Maximum interval | Maximum volume |
|---|---|---|---|---|
| 1 | 100 | [100,101): 4; [101,102): 7; [102,103): 8; [103,104): 2 | [102,103) | 8 |
| 2 | 100 | [100,102): 11; [102,104): 10 | [100,102) | 11 |
| 2 | 99 | [99,101): 4; [101,103): 15; [103,105): 2 | [101,103) | 15 |
 Open full-size diagram
- [99,101): 4 units
- [101,103): maximum: 15 units
- [103,105): 2 units
Do not pick the grid that best fits the later reversal
Changing settings until a peak aligns with an already observed turning point is not evidence that the selected peak predicted it. Record the grid and window before evaluating the next observation. A sensitivity check can reveal dependence on arbitrary settings, but it does not itself establish a profitable strategy.
Before acting
- Keep the trade population fixed for a grid comparison.
- Record width, origin and endpoint inclusion.
- Reconcile total volume under every grid.
- Distinguish the maximum interval from its display coordinate.
- Label midpoint-weighted results as approximations.
Check your understanding
Estimate VWAP using each bucket's midpoint for the two width-2 grids. Do those estimates replace the actual trade-level VWAP?
Show the explained answer
At origin 100, (11 × 101 + 10 × 103) ÷ 21 = 2,141 ÷ 21 ≈ 101.952381. At origin 99, (4 × 100 + 15 × 102 + 2 × 10⁴) ÷ 21 = 2,138 ÷ 21 ≈ 101.809524. Both are grouped approximations. The actual ledger still gives 2,129 ÷ 21 ≈ 101.380952; changing the drawing grid did not change its trades.