Athenum Research · Version 1 · 24 September 2026
Bitcoin or Ethereum: which looks stronger?
A market screen can show Bitcoin ahead of Ethereum over the last 24 hours, while Ethereum leads since midnight. We measured how often the apparent leader changes when the same pair of prices is compared using those two different starting points.
27.15 %
of hourly comparisons named a different leader
2,378 / 8,760 · The timestamp stays the same; only the return baseline changes. This counts disagreement between two measurements, not a reversal that happened in the next hour.
Binance BTCUSDT and ETHUSDT perpetuals · 22 September 2025, 09:00 UTC–22 September 2026, 08:00 UTC. Both instruments use the same hourly close boundaries.
Why the winner can change
Illustrative example, not market data: BTC is up 2% and ETH up 4% over 24 hours, so ETH leads by 2 percentage points. Since midnight, BTC is up 1% and ETH down 1%, so BTC leads by 2 points. Neither reading is wrong: they describe different periods. This study asks how often that difference changes the ranking.
The time of day matters
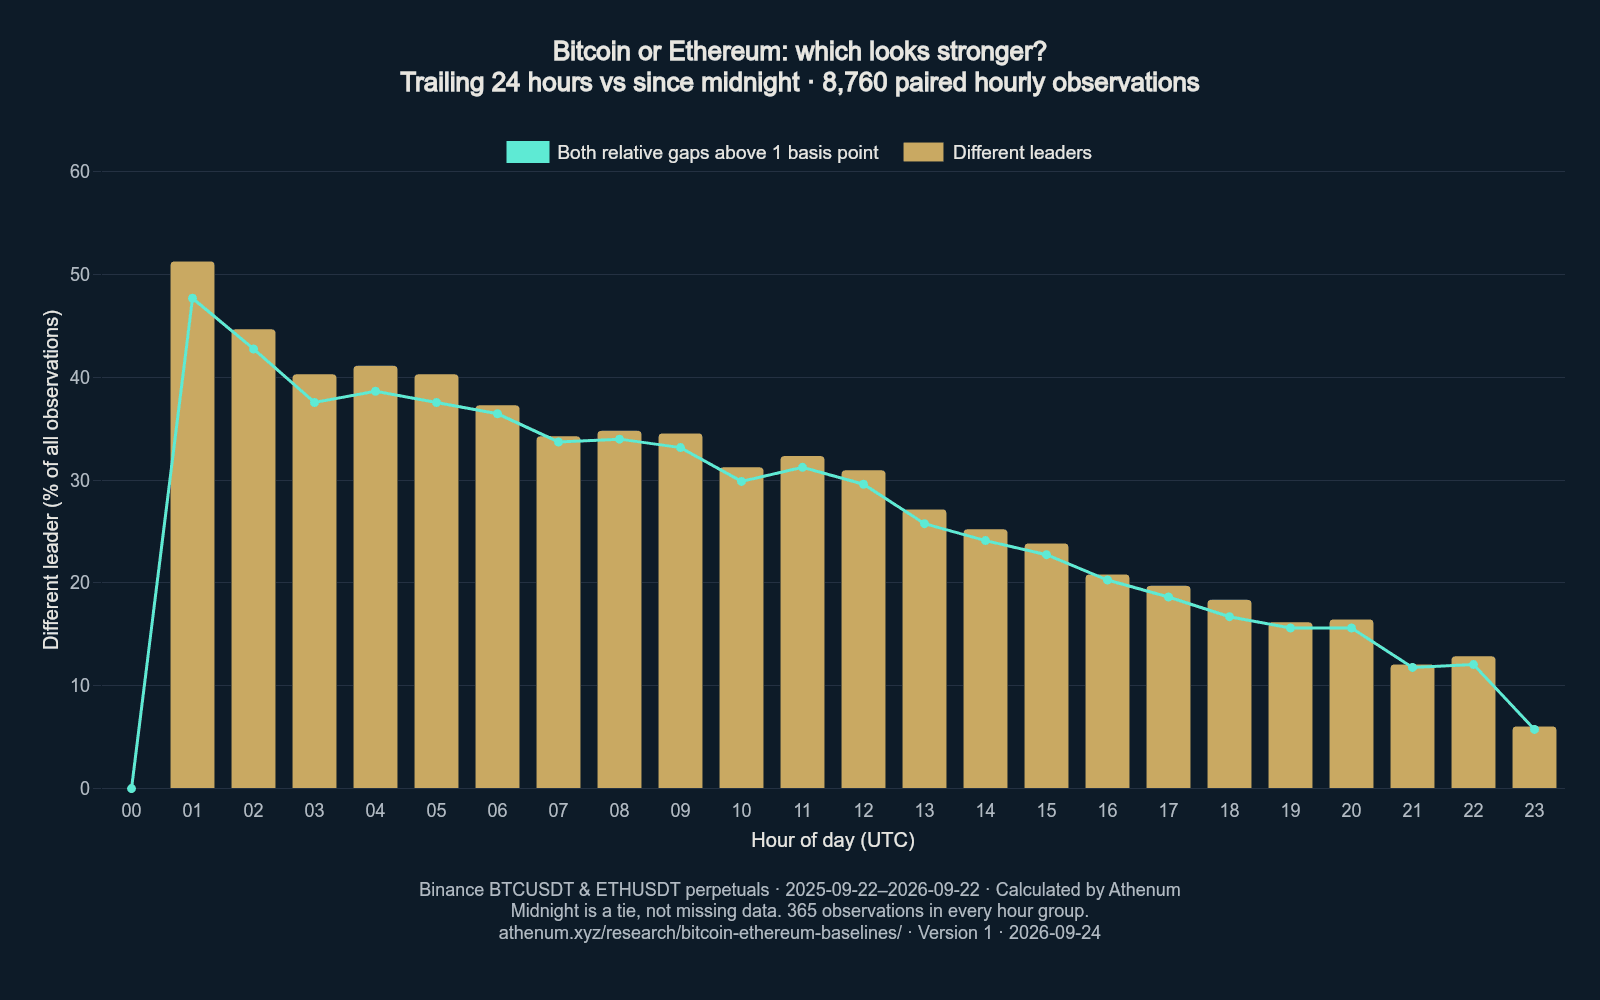
Each bar divides the disagreement count by all 365 observations at that UTC hour. The midnight bar is zero because both calendar returns are zero: it is a tie, not missing data.
Read the chart as a table
| UTC hour | Observations | Different leaders | Share of all observations |
|---|---|---|---|
| 00:00 | 365 | 0 | 0.00 % |
| 01:00 | 365 | 187 | 51.23 % |
| 02:00 | 365 | 163 | 44.66 % |
| 03:00 | 365 | 147 | 40.27 % |
| 04:00 | 365 | 150 | 41.10 % |
| 05:00 | 365 | 147 | 40.27 % |
| 06:00 | 365 | 136 | 37.26 % |
| 07:00 | 365 | 125 | 34.25 % |
| 08:00 | 365 | 127 | 34.79 % |
| 09:00 | 365 | 126 | 34.52 % |
| 10:00 | 365 | 114 | 31.23 % |
| 11:00 | 365 | 118 | 32.33 % |
| 12:00 | 365 | 113 | 30.96 % |
| 13:00 | 365 | 99 | 27.12 % |
| 14:00 | 365 | 92 | 25.21 % |
| 15:00 | 365 | 87 | 23.84 % |
| 16:00 | 365 | 76 | 20.82 % |
| 17:00 | 365 | 72 | 19.73 % |
| 18:00 | 365 | 67 | 18.36 % |
| 19:00 | 365 | 59 | 16.16 % |
| 20:00 | 365 | 60 | 16.44 % |
| 21:00 | 365 | 44 | 12.05 % |
| 22:00 | 365 | 47 | 12.88 % |
| 23:00 | 365 | 22 | 6.03 % |
A separate question: does the return itself change sign?
For each instrument separately, we also count whether its trailing-24-hour and since-midnight returns have opposite signs. This differs from the BTC-versus-ETH ranking above. The Bitcoin count reproduces the earlier study; the small difference between assets is not a claim of statistical significance.
- Bitcoin: 2,240 / 8,760 (25.57 %)
- Ethereum: 2,302 / 8,760 (26.28 %)
Download, verify and cite
- CSV: 24 hourly statistical groups
- JSON: findings, source requests and SHA-256 hashes
- ZIP: reproducibility code and instructions
- PNG: chart for citation
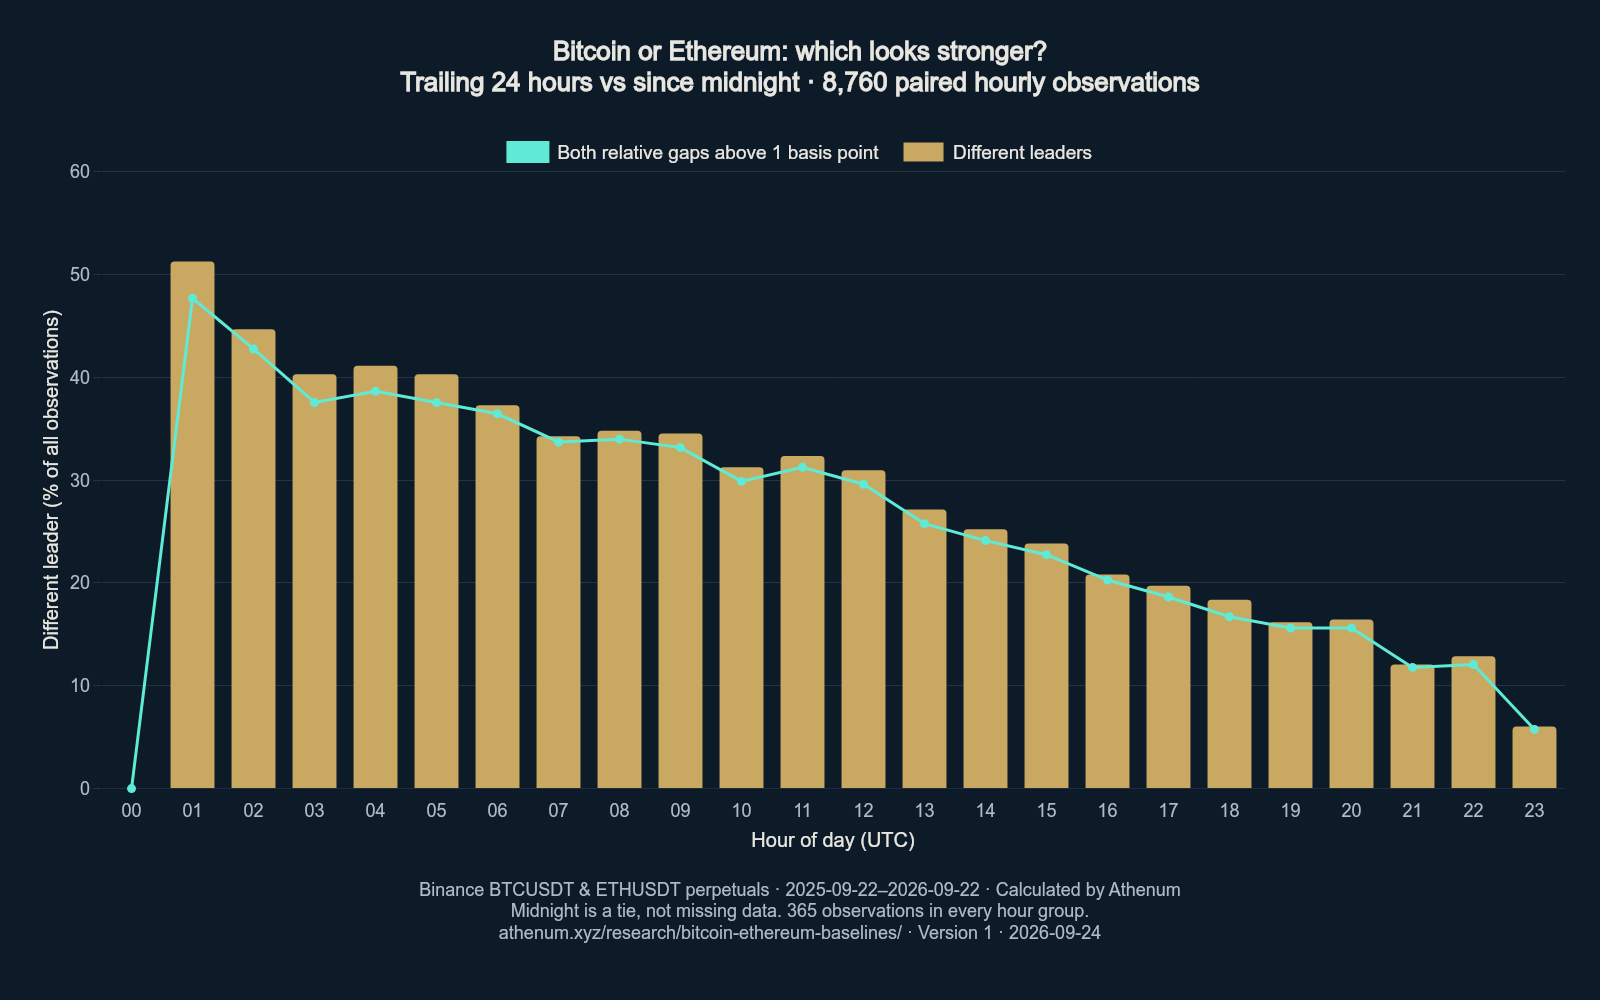
Suggested citation: Athenum Analytics (2026), Bitcoin or Ethereum: which looks stronger?, version 1, 24 September 2026. Attribute source candles to Binance. https://www.athenum.xyz/research/bitcoin-ethereum-baselines/
How to reproduce the result
Download and unzip the code bundle, then run the command below with Node 22 and internet access. It downloads both source series directly from Binance, checks each hourly close and fails on missing, duplicate, non-finite or nonpositive prices. No replacement observations are generated. The browser page displays the published results; the calculation runs in the offline research script.
node reproduce.mjs ./resultsP(t) is the last-trade close of the hour ending at t. Binance labels candles by their opening time, so we add one hour to obtain the close boundary. For each instrument: R24(t) = 100 × [P(t) / P(t − 24h) − 1]; R00(t) = 100 × [P(t) / P(last 00:00 UTC) − 1]. Define D24 = R24(ETH) − R24(BTC) and D00 = R00(ETH) − R00(BTC). Opposite nonzero signs of D24 and D00 mean different leaders.
Binance official API connector and candle contract
Ties and rounding sensitivity
A spread within 0.000000001 percentage points of zero counts as a tie. All 365 midnight observations tie on the calendar baseline. The headline retains all 8,760 observations in its denominator; excluding ties answers a different question. We also count disagreements where both absolute spreads exceed 0.01 percentage points (one basis point), to separate the main result from near-equal returns.
- Excluding ties: 2,378 / 8,395 = 28.33 %
- With both relative gaps above one basis point: 2,267 / 8,760 = 25.88 %
The full results and all 24 hour groups were independently recalculated in Python using 40-digit decimal arithmetic. Counts matched, and median gaps agreed within 0.0000000001 percentage points. This is a second calculation, not a claim of independent human peer review.
CSV column dictionary
| Column | Meaning / unit |
|---|---|
utc_hour | Hour of close boundary, 0–23 UTC |
period_start_utc / period_end_utc | Inclusive study boundaries, ISO 8601 UTC |
observations | Paired observation count |
ranking_disagreements | D24 and D00 have opposite nonzero signs |
ranking_disagreement_pct_all | 100 × disagreements / all observations |
either_baseline_ties | Tie on at least one baseline |
comparable_non_tie_pairs | Observations minus either-baseline ties |
ranking_disagreement_pct_non_ties | Percentage excluding ties; blank when denominator is zero |
ranking_disagreements_over_1bp | Disagreement with both absolute spreads greater than 0.01 percentage points |
btc_direction_disagreements / eth_direction_disagreements | For each coin, opposite nonzero signs of R24 and R00 |
eth_leads_trailing / btc_leads_trailing | Count of leads on trailing-24-hour returns |
eth_leads_calendar / btc_leads_calendar | Count of leads on since-midnight returns |
relative_gap_median_pp | Median |D24 − D00| in percentage points; even samples use the mean of the two middle values |
Scope and reuse
This is a historical description of two USDT-quoted perpetual contracts on one venue, not a spot-price index, a strategy or a forecast. Funding payments, fees and slippage are excluded. Adjacent hourly windows overlap; the 8,760 readings are not independent experiments. No causal interpretation or guaranteed future frequency follows from this sample.
The download redistributes our calculated statistics, chart and code, not the underlying price feed. You may cite, share and reproduce these Athenum materials with attribution to Athenum Analytics and the Binance source. Obtain source prices from Binance and follow its applicable terms; no licence to Binance raw data is granted here. Source requests and payload hashes document this run; later vendor revisions can change results.