Indicator mechanics: reconstruct what the chart calculates · 2 / 5
Test ZLEMA response and overshoot on a known price path
A faster-moving line can react sooner to a change and also overshoot it. Test both behaviors before interpreting “zero lag” as perfect tracking or knowledge of the next price.
Athenum7 minUpdated:
Write the transformation before judging the chart
Use a five-period exponential average with α = 2 / (5 + 1) = 1/3. An ordinary update is EMA = α × current close + (1 − α) × previous EMA. For this ZLEMA example, first transform the input to 2 × current close − close two bars earlier, then apply the same exponential update. A five-period length makes the two-bar delay unambiguous.
Initialize both averages at 100 and assume a long flat history at 100 before the example. Every update uses only the current completed close and earlier observations. Implementations can choose different delay rounding for even lengths or different seeds; those details belong in a reproducible specification.
Inspect a temporary move as well as its first response
On the first jump from 100 to 110, the compensated input is 120. That is an arithmetic transformation, not an observed trade at 120. With the next close still 110, the old delayed price remains 100, so a second input of 120 pushes ZLEMA above the actual close.
When the series returns to 100, the delayed higher close temporarily produces an input of 90. The line can then undershoot. This is a response property of the chosen filter and path, not evidence that 90 traded or that the next price will decline. Assess delay, overshoot and sensitivity together on frozen examples before evaluating any resulting trading policy.
The faster response crosses above 110 and later below 100
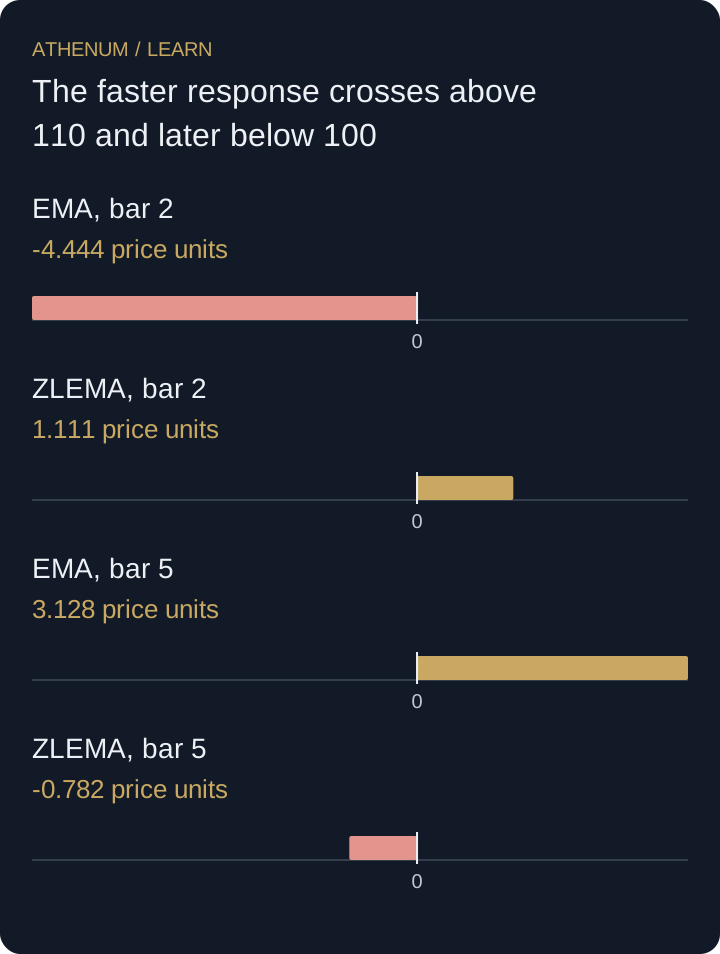
Feed closes 110, 110, 110, 100 and 100 after the flat history. At bar 2, ordinary EMA is 105.5556, while ZLEMA is 111.1111. By bar 5, the close is 100, ordinary EMA is 103.1276 and ZLEMA is 99.2181. Calculations retain full precision until display rounding.
The same ZLEMA that reduces the first-bar distance from the close also overshoots both the temporary plateau and the return level. This example establishes neither a universal ranking of filters nor a profitable entry rule. It provides a small sequence on which you can independently check what the formula does.
| Bar | Close | Compensated input | EMA | ZLEMA |
|---|---|---|---|---|
| 1 | 110 | 120 | 103.3333 | 106.6667 |
| 2 | 110 | 120 | 105.5556 | 111.1111 |
| 3 | 110 | 110 | 107.0370 | 110.7407 |
| 4 | 100 | 90 | 104.6914 | 103.8272 |
| 5 | 100 | 90 | 103.1276 | 99.2181 |
 Open full-size diagram
- EMA, bar 2: -4.444 price units
- ZLEMA, bar 2: 1.111 price units
- EMA, bar 5: 3.128 price units
- ZLEMA, bar 5: -0.782 price units
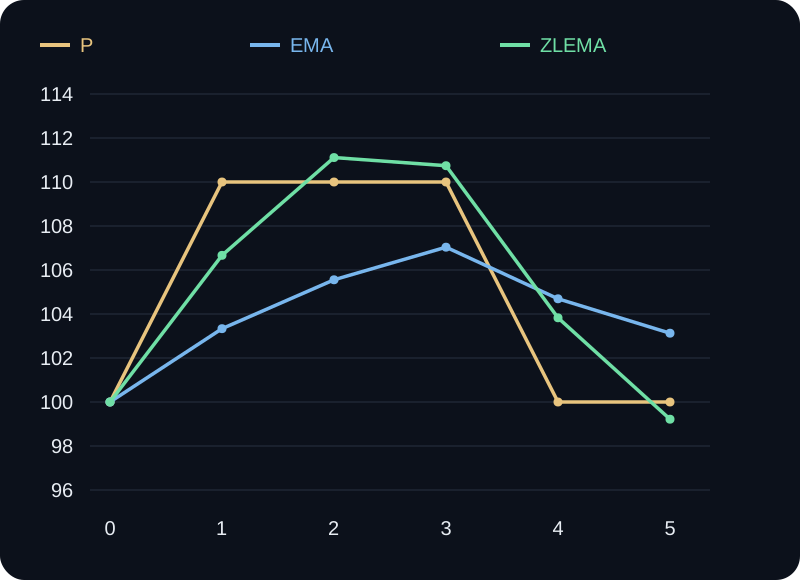
Original hypothetical five-period filters; seed 100 and α = 1/3.
P is the completed close, shown in gold; EMA is blue and ZLEMA green. The horizontal axis counts updates from the common seed at 0. The green line exceeds the 110 plateau and later falls below 100; all three series share one price scale.
A transformed input is not a forecast
The input 120 adds the most recent two-bar change to the current price. Its value can exceed every observed close. Reading that arithmetic as a target silently adds an untested forecasting assumption. The filter also cannot respond to an unobserved future change merely because its name contains “zero lag”.
Before acting
- Specify length, α and delay rounding.
- Use the same starting history for both filters.
- Preserve transformed inputs separately from traded prices.
- Include temporary spikes and reversals in comparisons.
- Evaluate any entry policy after costs on unseen observations.
Check your understanding
After the initial flat history at 100, the next close is 94. What are the first ordinary EMA and ZLEMA values under the declared settings?
Show the explained answer
The compensated input is 2 × 94 − 100 = 88. Ordinary EMA is 94 / 3 + 2 × 100 / 3 = 98. ZLEMA is 88 / 3 + 2 × 100 / 3 = 96. Both respond only after observing the close; the faster response does not predict the following bar.