Indicator mechanics: reconstruct what the chart calculates · 1 / 5
RSI is momentum, not volatility: calculate the difference
An RSI reading answers a question about the balance of recent gains and losses. It does not tell you how many price units the market moved or how much a position can lose.
Athenum7 minUpdated:
Start with the quantities inside the oscillator
For each completed close, separate its change into a nonnegative gain and a nonnegative loss. RSI is 100 − 100 / (1 + average gain / average loss). Under Wilder smoothing, each new average is ((n − 1) × previous average + current observation) / n. Declare how the first average is initialized; otherwise two apparently identical settings can disagree.
The numerator and denominator share the same price unit, which cancels in their ratio. Multiplying every gain and loss, including their initial averages, by the same positive factor leaves RSI unchanged. A shorter lookback changes responsiveness; it does not turn a directional ratio into a measurement of price dispersion.
Choose a separate magnitude measurement
A mean absolute close change describes how far the observed closes moved per step. True range additionally considers the high, low and previous close; ATR smooths that range. Return standard deviation asks a different question again. These measurements are not interchangeable, so write their inputs, window and units before comparing them.
A strong directional sequence can keep RSI elevated while its absolute moves remain small. A volatile back-and-forth sequence can have balanced gains and losses. Neither a reading above a threshold nor an equal reading on two instruments establishes equal risk, a reversal probability or an appropriate position size.
Two original four-change paths both produce RSI 66.67
Initialize a four-period RSI using the arithmetic means of the first four gains and losses. Both hypothetical paths start at 100. Path A closes at 102, 101, 103 and 102; path B closes at 110, 105, 115 and 110. Each has two positive and two negative changes, with the gains twice the losses in total.
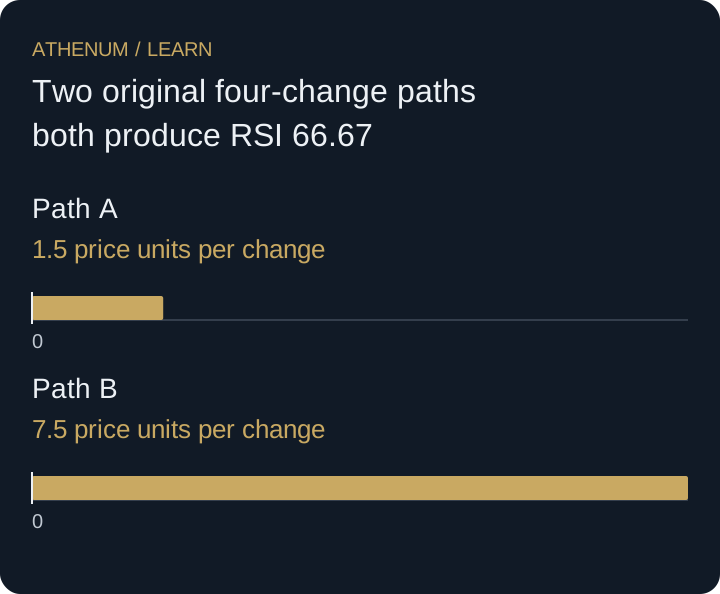
For A, the initial average gain is (2 + 0 + 2 + 0) / 4 = 1 and average loss is (0 + 1 + 0 + 1) / 4 = 0.5. B gives 5 and 2.5. Both gain/loss ratios equal 2, so both RSI values are 66.6667. Yet mean absolute close change is 1.5 for A and 7.5 for B. The figure compares that separate magnitude measure, not RSI and volatility on one axis.
| Path | Close changes | Average gain | Average loss | RSI | Mean absolute change |
|---|---|---|---|---|---|
| A | +2, −1, +2, −1 | 1 | 0.5 | 66.67 | 1.5 |
| B | +10, −5, +10, −5 | 5 | 2.5 | 66.67 | 7.5 |
 Open full-size diagram
- Path A: 1.5 price units per change
- Path B: 7.5 price units per change
Do not rename a ratio when a setting changes
Calling RSI(10) a volatility filter does not change its formula. It may select observations associated with volatility in a particular sample, but that empirical relationship needs separate testing. Also declare what happens when the average loss is zero; when both averages are zero, the ratio itself is undefined and software conventions can differ.
Before acting
- Record the price source and completed-bar rule.
- Declare the smoothing and initialization.
- Keep gain/loss ratio separate from movement size.
- Use units appropriate to the risk question.
- Test the trading rule independently of the indicator label.
Check your understanding
Two already-smoothed states have average gain/loss of 0.9/0.3 and 9/3. What are their RSI values, and can you infer ATR from them?
Show the explained answer
Both ratios are 3, so RSI = 100 − 100 / 4 = 75. ATR cannot be recovered from these two states: they contain neither the necessary high/low ranges nor their smoothing history. The equal RSI values do not establish equal volatility.