Table of Contents6 sections
- What does a crypto liquidation number actually count?
- Why does Binance's public liquidation feed report less than it sees?
- Do other venues publish liquidations the same way?
- What does the cross-venue liquidation split look like right now?
- How large are liquidations against the leverage that produced them?
- How should you read a liquidation number?
Practise with worked lessons
- Bound liquidation-feed coverage without inventing a market total
Separate provider selection, collector gaps and result truncation. Test when an observed sum is a lower bound and why a multiplier cannot fix coverage.
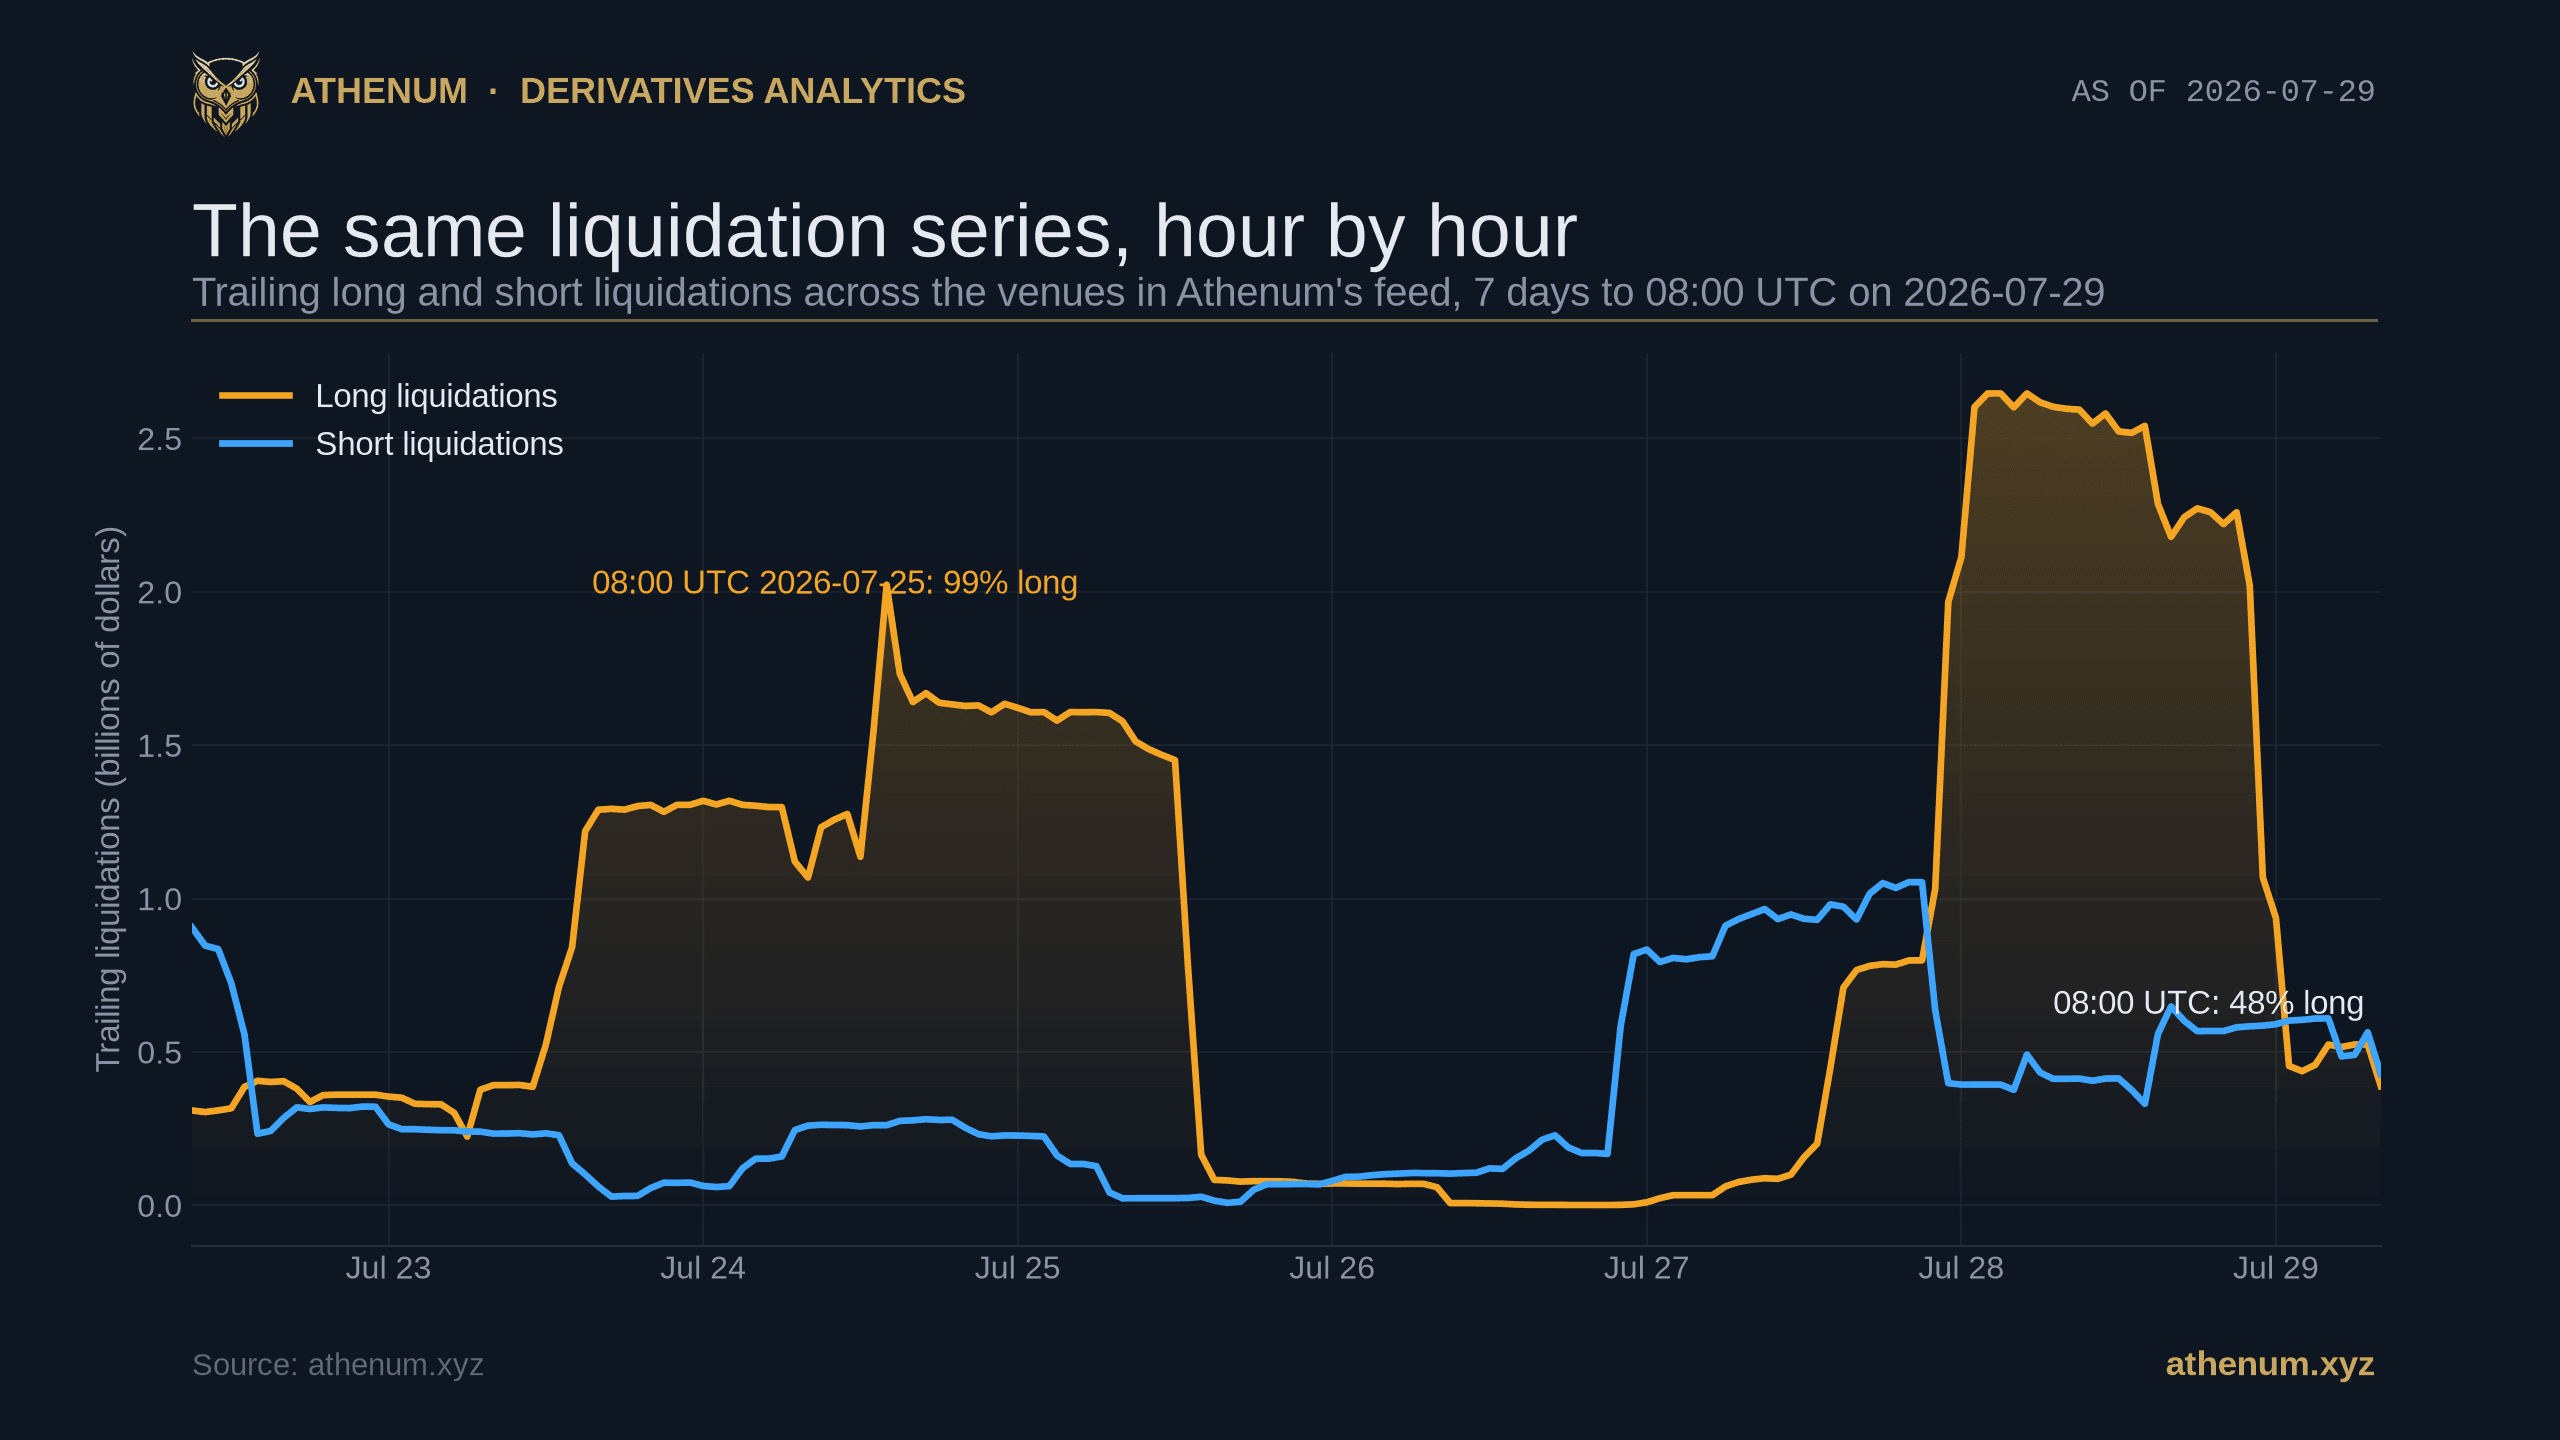
TLDR. Crypto liquidation data is not a fact the market emits, it is a measurement produced by exchange data feeds, and at least one major venue throttles that feed on purpose. Binance's own documentation for its liquidation order stream says that for each symbol only one liquidation order inside each 1000 millisecond window is pushed, so every total built on that stream is a lower bound rather than a count. The direction of the error is knowable and the size of it is not, which is the single most useful thing to understand about the number. On top of that, the same series says opposite things at different timestamps: across the venues in Athenum's feed, the trailing liquidation total read 98.6% long at 08:00 UTC on 2026-07-25 and 47.6% long at 08:00 UTC on 2026-07-29, 96 hours apart. This post explains what the number counts, what it silently drops, and the four checks that make it usable anyway.
What does a crypto liquidation number actually count?
A liquidation is a forced close. When a leveraged position no longer meets its maintenance margin, the venue's risk engine closes it at market rather than asking the trader first. What gets published is a record of that forced order: a symbol, a side, a size, a price and a timestamp. Aggregate that across venues and you get the number quoted everywhere as "$800M liquidated."
Three things about that number matter before you read anything into it.
It is a notional, not a loss. A $817M liquidation total is the face value of the positions closed, not the money traders lost. The loss is the margin that was posted against them, which is smaller by roughly the leverage multiple.
The side label is inverted relative to price. "Long liquidations" are forced sells, because closing a long means selling. So a wave of long liquidations is selling pressure arriving into a falling market, which is why liquidation clusters and price cascades reinforce each other.
And it is a measurement. Every venue decides what its public feed emits, at what rate, and in what shape. That decision, not market activity, sets the ceiling on what any aggregator can count.
Why does Binance's public liquidation feed report less than it sees?
Because it is documented to. Binance calls these Liquidation Order Snapshot Streams, and its websocket specification states that "For each symbol, only the latest one liquidation order within 1000ms will be pushed as the snapshot. If no liquidation happens in the interval of 1000ms, no stream will be pushed." The window is 1000ms, and the identical wording appears on the all-market stream and on the coin margined equivalents. There is a catch that almost nobody quoting this sentence has noticed: Binance has announced that it should read differently. A dated entry in its own derivatives change log, 2026-04-10 and effective 2026-04-14, records the intended edit from "only the latest one liquidation order" to "only the largest one liquidation order" within 1000ms. The edit was never applied. Re-reading all four stream descriptions on 2026-08-02, more than three and a half months past that effective date, every one of them still says "latest", and the word "largest" appears in none of the liquidation stream descriptions, only inside the change log entries announcing the change. Binance therefore publishes two incompatible accounts of how the feed picks the one order it keeps, and no public documentation settles which one the live stream implements.
That contradiction matters less than it looks, because the useful half of the argument never depended on which word wins. Whichever order survives the window, exactly one of them is published and the rest never are, so any total built on the stream is a lower bound under either reading. What the two readings change is the character of the error, not its direction. If the latest order survives, the published print is chosen without regard to size and can be wildly unrepresentative of what actually cleared. If the largest survives, the print is at least the biggest of the batch, which puts a floor under how far the dollar figure can fall. Either way the familiar reassurance that "it only drops the small ones, so the dollar total is roughly right" will not carry weight: its first half holds only under the reading Binance announced and never shipped, and its second half fails under both.
Read the timing too, because it is stronger than it looks. In a calm hour where liquidations arrive one at a time, the stream is close to complete. In exactly the minute you care about, a cascade where hundreds of positions close inside the same second, one print per symbol per second survives and the rest are never published. The feed is least complete precisely when the event is biggest.
Two honest limits on how far you can take this. First, it is a statement about a public websocket feed, not a claim that the venue's internal records are wrong, and Binance publishes no caveat saying the feed is unsuitable for totals. That inference is ours, drawn from the mechanism it documents. Second, the direction of the undercount is knowable and its size is not: you cannot subtract what was never published. Anyone quoting a precise multiple for how much is missed is guessing.
Do other venues publish liquidations the same way?
No, and the differences are the most useful part of the picture, because they show the gap is a disclosure choice rather than a law of nature.
OKX says it outright. Its liquidation orders channel documentation states, in as many words, that "This data doesn't represent the total number of liquidations on OKX." That is a venue telling you directly that its public number is partial, and it is the one of the three still saying so about a feed it still runs.
Bybit is the one that changed. Its old liquidation topic documented a cap of one order per second per symbol, and by late 2024 its own page said the feed did not push all liquidations occurring on Bybit, so the incompleteness was disclosed rather than discovered. In February 2025 Bybit replaced it with an all liquidation topic that it describes as pushing "all liquidations that occur on Bybit" at a 500ms frequency, and its changelog retired the predecessor with the blunt note that the old one "only pushes 1 liquidation per second, it can be discarded." So Bybit today is the counterexample, not a co-defendant.
Hyperliquid does not throttle a public liquidation feed because it does not publish one as a channel at all. Its public trade subscription carries no liquidation flag; the marker lives on per account fill events, so liquidations there are reconstructed from public settlement rather than read off a feed.
Which sets the scope of the argument honestly. Binance is named here not because it is the worst offender but because it is the most checkable: it documents the throttle in its own API reference and still runs it at the venue carrying the largest share of open interest. OKX documents no throttle at all and admits the shortfall instead, and Bybit removed the throttle rather than documenting it. The point is not that one venue is dishonest, it is that a cross-venue total assembled from feeds like these is a floor, and only the venues themselves know by how much.
The one public attempt at sizing that gap came from inside an exchange. On 2025-02-03 Bybit's chief executive said publicly that a day the industry was reporting as roughly $2B of liquidations was, by his estimate, "at least around $8-10b," and that Bybit's own 24 hour liquidations of $2.1B were being recorded elsewhere as about $333m. Seventeen days later Bybit shipped the replacement feed. Treat that as one venue, one day, self reported: it is a datapoint about the direction, not a correction factor anyone should multiply by.
What does the cross-venue liquidation split look like right now?
This is where a continuously recorded series earns its keep, because it can show something a single snapshot structurally cannot: how much the story changes with the timestamp you picked.

The same liquidation series 96 hours apart: 98.6% long on a $1.60B total at 08:00 UTC on 2026-07-25, and 47.6% long on an $817M total at 08:00 UTC on 2026-07-29.
At 08:00 UTC on 2026-07-29 the trailing liquidation total across the venues in Athenum's feed stood at $817M, split $389M long and $428M short, so 47.6% long against 52.4% short. That is about as balanced as this series gets, and on its own it would support a headline about a two-sided, unremarkable market.
Ninety six hours earlier, at 08:00 UTC on 2026-07-25, the same series read $1.60B, of which $1.58B was long and $23M short. That is 98.6% long, a 51 percentage point swing in the split, and it would support a headline about longs being taken out en masse.
Both readings are true. Neither is the market's opinion about anything. The lesson is not that one timestamp lied, it is that a liquidation split is a fast-moving trailing statistic and a screenshot of it is worth nothing without its timestamp. Whenever you see one quoted without a date and a time, it is unreadable, and that applies to ours too, which is why every figure in this post carries one.
How large are liquidations against the leverage that produced them?
The one comparison that makes a raw liquidation total mean something is the standing leverage it came out of. A $817M total against a market carrying $50B of open interest is noise. The same total against $5B is a structural event.

Trailing liquidations as a share of open interest across the venues in Athenum's feed, 7 days to 08:00 UTC on 2026-07-29: a range of 0.5% to 17.8%, ending at 4.6%.
At 08:00 UTC on 2026-07-29, Bitcoin perpetual open interest across the venues in the feed was $17.63B with Bitcoin at $64,358, so that $817M trailing liquidation total was 4.6% of standing leverage. Over the seven days to that timestamp the same ratio ran between 0.5% and 17.8%. A single liquidation number tells you nothing about where in that range you are standing; the ratio does, and it is the version worth quoting.
Open interest is also the part of this you can audit yourself, which is the difference between a number you trust and a number you repeat. Bitcoin perpetual open interest is published by the venues over public endpoints that need no account, so it can be checked leg by leg. We re-pulled Binance's own published open interest at the moment this post was built and it matched the Binance leg of the chart below to within 0.1%. Liquidation totals have no equivalent public endpoint to check against, and that asymmetry is the whole argument.

Bitcoin perpetual open interest by venue at 08:00 UTC on 2026-07-29: Binance $6.72B (38.1%), Bybit $3.48B (19.8%), Hyperliquid $2.32B (13.2%), Bitget $2.23B (12.7%), OKX $2.02B (11.5%), Deribit $0.72B (4.1%), covering 99.4% of a $17.63B feed-wide total.
Across the six venues the feed breaks Bitcoin perpetual open interest out by, Binance held $6.72B or 38.1% of the $17.63B total at that timestamp, ahead of Bybit at $3.48B (19.8%), Hyperliquid at $2.32B (13.2%), Bitget at $2.23B (12.7%), OKX at $2.02B (11.5%) and Deribit at $0.72B (4.1%), the six of them covering 99.4% of the feed-wide total. That distribution is the second reason venue coverage matters: the venue with the largest share of standing leverage is also the venue whose public liquidation feed is explicitly rate limited, so the biggest single contributor to any cross-venue total is the one contributing a floor. For a fuller treatment of that distribution, see Athenum's breakdown of open interest by exchange.
How should you read a liquidation number?
1. Demand a timestamp and a window. A liquidation figure with neither is not a datum. The two readings above, 98.6% long and 47.6% long, come from the same series 96 hours apart. 2. Treat every total as a floor. Where a venue documents a throttle, the published number is the minimum that happened, never the maximum. Compare totals across time, not against a notional "true" figure that no public feed can produce. 3. Scale it by open interest before you react. 4.6% of standing leverage at 08:00 UTC on 2026-07-29 sits low inside that week's 0.5% to 17.8% range. Work out what a move would do to your own position first in the free Athenum leverage calculator, then size it in the Athenum position size calculator and cost the round trip in the Athenum PnL calculator. 4. Read the side against price, not as sentiment. Long liquidations are forced selling and short liquidations are forced buying. A rising long-liquidation count during a fall is the mechanism of the fall, not a separate signal about it. 5. Check what happens after the forced close, because that is where the residual risk lives. When a liquidation cannot be filled above the bankruptcy price, the shortfall goes to the insurance fund and then, if that is exhausted, to other traders: the mechanics are in Athenum's guide to the insurance fund and auto-deleveraging.
Two neighbouring reads round this out. For what open interest itself is doing while liquidations run, the four setups are laid out in Athenum's open interest and price explainer. For the arithmetic of what a forced close actually costs you to come back from, that is Athenum's drawdown math post.
Every number above comes from Athenum's live derivatives feed across 14 exchanges, and the 34 calculators alongside it are free, with no account, no email, and no usage limits. The venue documentation quoted here is public too, which is the point of quoting it rather than asserting it. When you want the liquidation series running live next to the open interest it came from, instead of a screenshot with a date on it, it is in the Athenum terminal.
One terminal. All the data.
Liquidations, orderbook depth, whale walls & open interest from 4 exchanges, all real-time, in one place.
No credit card required

Athenum Analytics
Athenum Analytics is our three-person editorial team covering crypto derivatives, market data and macroeconomic context.