Table of Contents8 sections
- How often is perpetual funding actually paid?
- Is the funding interval set by the exchange, or by the symbol, or by the day?
- Why do two perpetuals show different funding rates and cost exactly the same?
- Is the maximum funding rate the same for every contract?
- Does the same ticker settle on the same clock at every venue?
- What does an unnormalized funding feed look like?
- How do you compare funding rates across venues without getting it wrong?
- What this measurement does not show
Practise with worked lessons
- Compare hourly and eight-hour funding on equal terms
A 0.005% hourly rate costs twice as much as 0.02% every eight hours. Normalise funding to one horizon and keep snapshot APR apart from account returns.
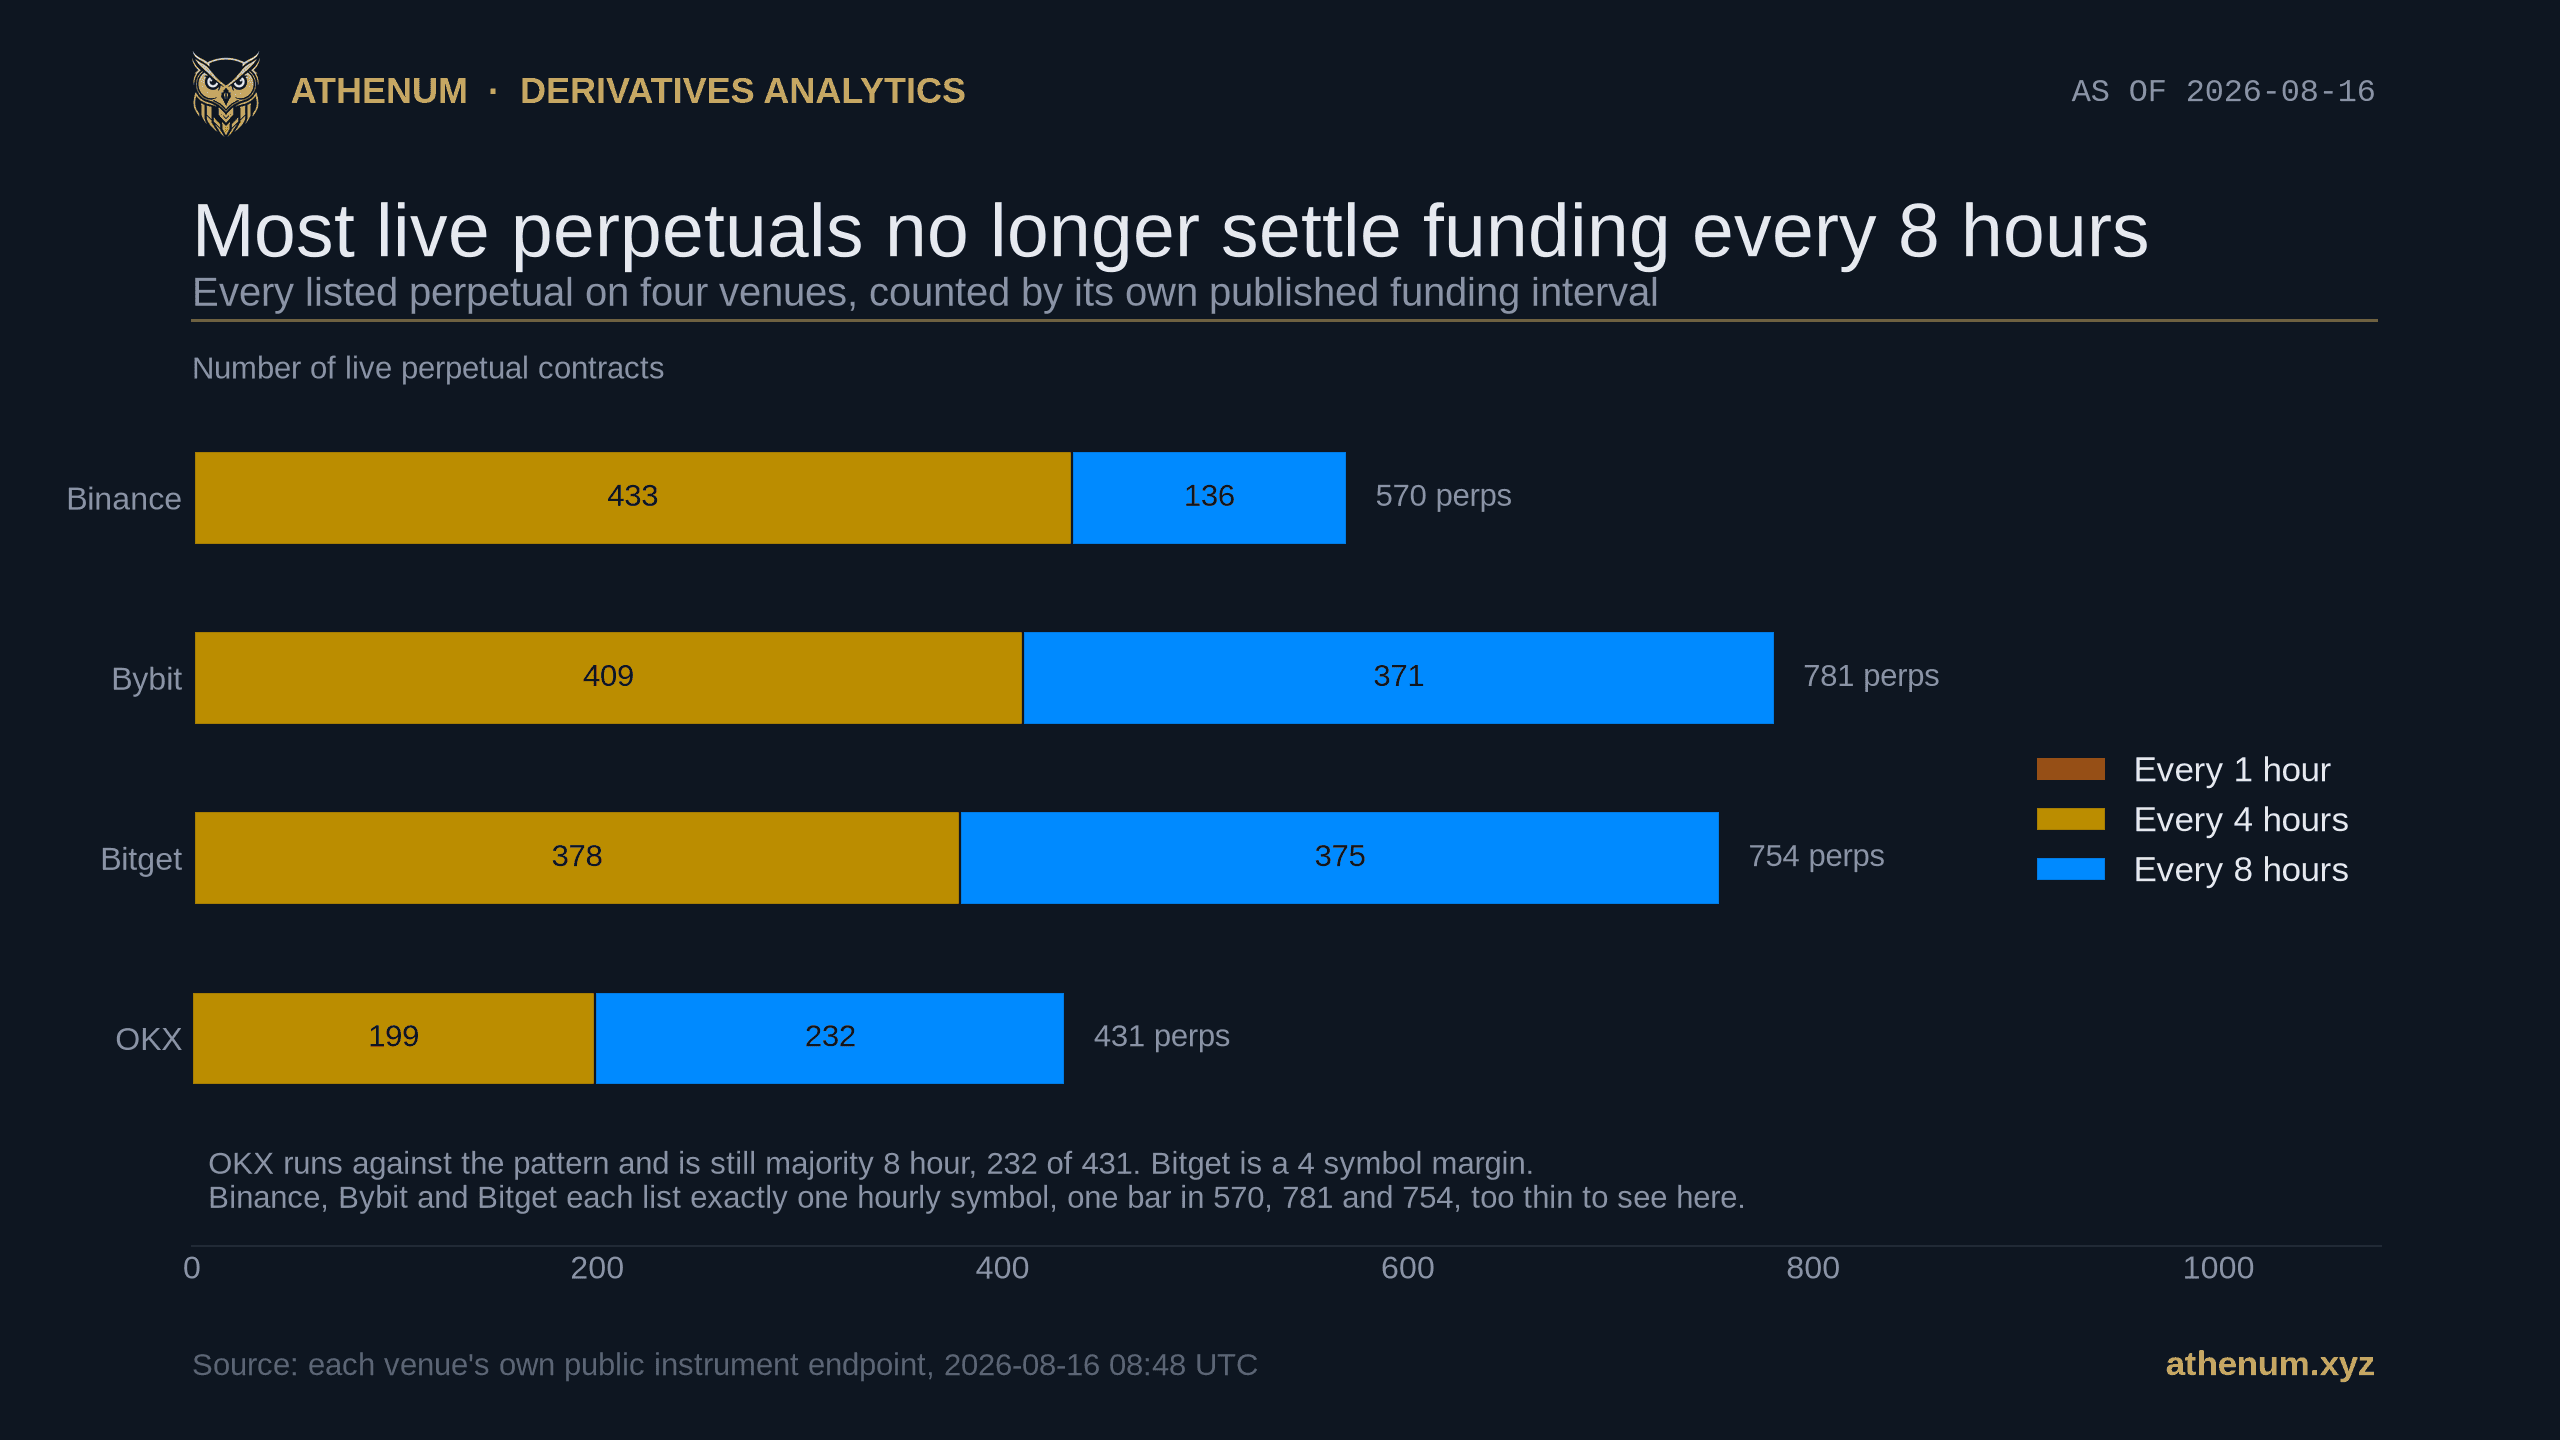
TLDR. The funding interval is how often a perpetual charges funding, and most guides, screeners and back of the envelope calculations treat it as a property of the exchange: 8 hours, three settlements a day, multiply by 1,095 for an annual rate. We counted every live crypto perpetual on the main linear board of four venues on 2026-08-16 08:48 UTC. Of 2,536 contracts, 1,422 settle on something other than the 8 hour clock: 433 of Binance's 570, 409 of Bybit's 781, 378 of Bitget's 754 and 199 of OKX's 431 settle every 4 hours, and three symbols settle every hour. The interval is published per symbol, it differs between venues for the same ticker, and it changes over time. The visible consequence is that at that moment 342 of Binance's 570 perpetuals were quoting exactly the same daily funding cost, 0.0300% per day, as two different screen numbers: 0.0050% on the 4 hour symbols and 0.0100% on the 8 hour ones.
How often is perpetual funding actually paid?
That depends on the contract, not on the exchange, and every one of these four venues publishes the answer per symbol. Binance returns fundingIntervalHours for each perpetual, Bybit returns fundingInterval in minutes, Bitget returns fundInterval in hours, and OKX publishes no interval field in its instrument list at all, so you have to read it off the gap between fundingTime and nextFundingTime on the funding rate endpoint.
Counted on 2026-08-16 08:48 UTC:
Venue, linear board | Perpetuals listed | Every 4 hours | Every 8 hours | Every 1 hour | Off the 8 hour clock |
|---|---|---|---|---|---|
Binance | 570 | 433 | 136 | 1 | 434 |
Bybit | 781 | 409 | 371 | 1 | 410 |
Bitget | 754 | 378 | 375 | 1 | 379 |
OKX | 431 | 199 | 232 | 0 | 199 |
All four | 2,536 | 1,419 | 1,114 | 3 | 1,422 |
Two things about that table are worth saying out loud. The aggregate majority is carried by one venue: Binance is 76.1% off the 8 hour clock while OKX is still majority 8 hour, at 232 of 431, and Bitget's majority is a 4 symbol margin. And these are the linear crypto boards only. Binance's own USD-M board carries a further 163 perpetuals on gold, silver, Tesla and other non-crypto underlyings, 11 of them on a 4 hour clock, which we did not count because this is a crypto derivatives measurement.
We did not take the interval field on trust. For 17 Binance symbols, the 8 highest turnover on each clock plus the one hourly symbol, we pulled the actual settlement history and measured the gaps. The 8 hour set, BTCUSDT and ETHUSDT among them, returned 199 of 199 gaps of 8.0 hours; seven of the eight 4 hour symbols returned 199 of 199 at 4.0 hours; COTIUSDT returned 199 of 199 at 1.0 hour. The stamps are not bit exact, they jitter by up to 14 milliseconds, which is a clock artefact and not a schedule. On a separate random draw of 60 of the 570, the declared interval matched the most recent real gap in 60 cases out of 60. The single exception across all of it is the subject of the next section, and it is the interesting one.
A second pull 8 minutes later, at 2026-08-16 08:56 UTC, returned an identical census on all three venues that publish the field.
Is the funding interval set by the exchange, or by the symbol, or by the day?
By the symbol, and it is not fixed even there. Binance's funding configuration endpoint carries an updateTime per symbol. Of the 570 live perpetuals, 533 carry one, and 44 of those were changed in the 90 days to 2026-08-16, 14 in the last 30 days and 4 in the last 7.
ACEUSDT is the case you can watch happen. Over its last 500 settlements it settled 431 times at a 4 hour spacing, 66 times at a 1 hour spacing, once at 8 hours and once at 2 hours. The hourly run is a single continuous block from 2026-08-07 08:00 UTC to 2026-08-10 02:00 UTC, followed by one 2 hour gap and then a return to the 4 hour grid, where it still sits. A cached interval for that symbol would have been wrong for 66 consecutive settlements, and in its heaviest seven days, the window ending 2026-08-10 20:00 UTC, a position paid funding 93 times rather than the 42 a 4 hour schedule implies.

Measured from the settlement stamps themselves rather than from the interval field. ACEUSDT ran 66 settlements one hour apart between 2026-08-07 08:00 UTC and 2026-08-10 02:00 UTC inside what the instrument list calls a 4 hour schedule, then one 2 hour gap put it back on the grid. The single 8 hour gap on 2026-06-24 is one skipped settlement, not a schedule change.
Bybit shows the same thing on a different symbol and at a faster tempo. Its instrument list says COTIUSDT settles every 8 hours; its own settlement history says the symbol ran hourly until 2026-08-07 08:00 UTC, switched to 8 hours, went hourly again from 2026-08-13 08:00 UTC to 2026-08-15 04:00 UTC, took one 4 hour step, and has settled on the 8 hour grid since 2026-08-15 08:00 UTC. COWUSDT moved the other way, from a 4 hour grid to hourly at 2026-08-15 12:00 UTC, one day before we measured. In both cases the field and the settlement stamps agree about the schedule in force today, and disagree about the one in force last week.
The rule that follows is unwelcome but short: the interval belongs to the symbol at a moment in time, so it has to be read alongside the rate rather than configured once. This is the same shape of error Athenum measured across ten published long short ratio feeds, where three of one venue's own endpoints stamp the end of the period and a fourth stamps the start.
Why do two perpetuals show different funding rates and cost exactly the same?
Because the published rate is the rate for one interval, and the venue divides the whole funding expression by the interval. Binance's published formula is the average premium index plus a clamped interest rate term, all divided by 8 over N, where N is the interval in hours. The interest rate parameter itself does not scale: it reads 0.01% for the 4 hour symbols and the 8 hour symbols alike. The division happens outside it, so a 4 hour symbol comes to rest at 0.005% and an 8 hour symbol at 0.01%. Both are 0.03% per day.
That is not a theoretical point. At 2026-08-16 08:48 UTC, the rate Binance was publishing for the coming settlement was exactly 0.005000% on 283 of its 433 4 hour perpetuals and exactly 0.010000% on 59 of its 136 8 hour perpetuals. Those 342 contracts, 60.0% of the board, were quoting the identical 0.0300% per day. The other three venues show the same double peak at the same instant: Bybit 313 of 409 and 93 of 371, OKX 146 of 199 and 40 of 232, Bitget 287 of 378 and 72 of 375.
One caution about the Binance field we counted, and it belongs in a post about conventions. It is called lastFundingRate and it is not the last funding rate. It is a running estimate of the next one: at 2026-08-16 08:48 UTC it read 0.00002202 for BTCUSDT while the rate that actually settled at 08:00 UTC was 0.00001839, and it kept drifting through the morning. The estimate and the settled rate coincide when the symbol is pinned, whether that is at the resting point, at zero, or at a binding cap.
The settled rates show the same two peaks, and they also show how much rarer the resting point is among liquid contracts. At the 2026-08-16 08:00 UTC settlement, the 40 highest turnover 4 hour symbols settled at exactly 0.005000% in 13 cases, and the 40 highest turnover 8 hour symbols settled at exactly 0.010000% in 3. Where real positioning exists the premium moves the rate off its resting point; where it does not, the clock is the only thing setting the number on the screen.

The 433 four hour and 136 eight hour contracts drawn twice; the single hourly symbol is left out of both panels. Read as Binance publishes it, the board has two modes 0.005 percentage points apart and the smaller one looks like the cheaper carry. Converted to a cost per day, 342 of the 570 land on one bar. The spread outside the spikes is real positioning; the gap between the two spikes is only the clock.
Ranking a board by the printed rate therefore reshuffles it, mildly. Among Binance's 100 largest perpetuals by 24 hour turnover at 2026-08-16 08:48 UTC, 350 of the 4,950 pairs tie on the printed rate; of the remaining 4,600, ordering by the printed rate rather than by cost per day swaps 135, which is 2.9%, and 64 of the 100 symbols land on a different rank. The direction of the error is fixed: reading the raw print understates a 4 hour symbol by a factor of two against an 8 hour one, and understates COTIUSDT, which sits at rank 48 in that same list, by a factor of eight.
Is the maximum funding rate the same for every contract?
No, and the spread is far wider than the interval spread. Binance publishes a cap and a floor per symbol, and across the 570 live perpetuals on 2026-08-16 there are 8 distinct cap values, returned as 10 distinct strings because two of them carry trailing zeroes. Expressed as what a position can pay in a day, they run from 0.015% to 48%, a factor of exactly 3,200.
The default cap of 2% accounts for 528 of the 570 symbols, and it is three different daily ceilings depending on the clock underneath it: 6% per day on the 94 eight hour symbols that carry it, 12% per day on the 433 four hour symbols, and 48% per day on the one hourly symbol. BTCUSDT and ETHUSDT sit far below all of them, capped at 0.3% per 8 hours, which is 0.9% per day. The other venues also set the cap per symbol, and they do not all land in the same place: Bybit's BTCUSDT cap is 0.5% per settlement and OKX's BTC-USDT-SWAP is 0.375%, while Bitget's BTCUSDT is 0.3%, identical to Binance's.

Eight distinct caps, ten distinct daily ceilings once the interval is folded in, and n on every rung. The three bars carrying a nominal 2 percent cap sit at 6, 12 and 48 percent per day. The bottom rung is one symbol, ONEUSDT, whose cap was lowered on 2026-08-14 to a level below the ordinary resting point and was still there on 2026-08-16.
The bottom rung shows a cap that binds rather than a cap that sits unused. On 2026-08-16 ONEUSDT's cap stands at 0.005% per 8 hours, below the 0.010% an 8 hour symbol rests at, after a configuration change stamped 2026-08-14 12:00 UTC. Every one of the 6 settlements since that change, from 2026-08-14 16:00 UTC through 2026-08-16 08:00 UTC, printed exactly 0.005000%, its ceiling. On 2026-08-16 that is still its state, and in the two days before the change the same contract printed -0.512886% and -0.272282%, which the current floor makes impossible.
Does the same ticker settle on the same clock at every venue?
Usually, and the exceptions are not rare enough to ignore. 421 USDT quoted tickers are listed as perpetuals on Binance, Bybit and Bitget at the same time. 390 of them carry the same interval on all three. The remaining 31, or 7.4%, do not.
The two extremes are COTIUSDT, which settles hourly on Binance and Bitget and every 8 hours on Bybit, an eightfold difference in how often the same exposure is charged, and COWUSDT, which settles every 4 hours on Binance and Bitget and every hour on Bybit. HYPEUSDT is on 4 hours at Binance and Bitget and 8 hours at Bybit. The pattern census is lopsided: 301 tickers are on 4 hours everywhere, 89 on 8 hours everywhere, 27 are 4 hours on Binance and Bitget but 8 hours on Bybit, and 4 more fall into three smaller patterns.

14 of the 31 disagreeing tickers, chosen by Binance turnover. The dominant pattern is Bybit keeping a symbol on 8 hours after Binance and Bitget have moved it to 4. Note what is not in this picture: BTC, ETH, SOL, XRP, DOGE, LINK and AVAX all settle every 8 hours on all three of these venues, so on these three boards a majors-only desk does not meet the problem.
That is the honest boundary on the census, with one loud exception. On these three centralised boards the majors are on a uniform 8 hour clock, so a desk trading only Bitcoin and Ether across Binance, Bybit and Bitget can keep the old assumption. It does not survive contact with the perpetual DEX field, where Bitcoin itself settles hourly, which is the next section.
What does an unnormalized funding feed look like?
Like ours, which is why we can show you one rather than someone else's. On the hour ending 2026-08-16 07:00 UTC, with Bitcoin at 63,030.45 dollars, Athenum's cross venue feed carried these Bitcoin perpetual funding readings: Binance 0.00143%, Bybit 0.00183%, OKX 0.00507%, Bitget 0.00838% and Hyperliquid 0.00125%. Read down that list and Hyperliquid prints the smallest number of the five.
It is also the most expensive of the five, and the reason is the previous two sections rather than anything about the market. The first four settle Bitcoin every 8 hours, which we checked symbol by symbol at each venue's own public endpoints. Hyperliquid settles every hour, and our feed passes its native hourly rate through unconverted; Hyperliquid's own API returns funding 0.0000125 for BTC, which matches the feed to the five decimals we print. On a common daily basis those five readings are Binance 0.0043%, Bybit 0.0055%, OKX 0.0152%, Bitget 0.0251% and Hyperliquid 0.0299%.

The bar is that single hour; the line behind it is the middle half of the last 199 hourly readings on the same daily basis, with the median marked. The bands overlap heavily, so read the ordering and not the size of the gap: in this hour Binance sits below its own middle half, which is most of why the gap looks like 7 times. The dashed line is the 0.0300 percent per day resting point, and no venue's band crosses it in 199 hours.
Two caveats, both visible in that picture. First, the gap in this particular hour is not the typical gap: Binance's 0.0043% sits below its own middle half of 0.0137% to 0.0250%, so the 7 times ratio is mostly Binance being unusually cheap for an hour. Across the 199 hourly readings the medians are Hyperliquid 0.0296% against Binance 0.0198%, a ratio of about 1.5. Second, Hyperliquid's 0.00125% per hour is not a positioning reading at all: it is exactly one eighth of the 0.01% per 8 hours that the venues in the previous section rest at, so it is the same resting point wearing a different number. At the venue's own 0.0000125 that is exactly 0.0300% per day, which is where the feed's 0.0299% comes from: the feed reports the hour's average rather than the instantaneous one. In all 199 hours not one of the five venues exceeded that level on a daily basis.
Deribit is on the same feed and we left it out of the comparison. Its column reads exactly 0.0 in 80 of the 200 rows, including the one above, and the venue publishes two different funding figures, an instantaneous one and an 8 hour one, without the feed recording which it carries. A number whose units you cannot pin is the exact failure this post is about, including when it is ours, so it does not get a bar.
How do you compare funding rates across venues without getting it wrong?
Our own June explainer already stated the principle: the interval is published per contract, and the cap and floor are per market parameters that vary by symbol. What nobody had done, us included, was count it. Our July piece on funding intervals then fell back on the venue level shorthand, telling you to multiply an "8 hour venue" by 1,095, which is right for Bitcoin on Binance and wrong for 434 of the 570 contracts on the same board. The census above is what turns the principle into a number.
Four steps follow from it.
Read the interval for that symbol, from that venue, today. Binance, Bybit and Bitget each expose it in the instrument list; OKX makes you derive it from the gap between consecutive funding stamps.
Convert to a common basis before you compare anything. Cost per day is the rate multiplied by 24 and divided by the interval in hours; an annual figure is that multiplied by 365. On the 4 hour majority the daily multiplier is 6, not 3.
Check the cap for that symbol too. A position sized against a 2% cap behaves differently when that cap can be reached 6 times a day rather than 3, and BTCUSDT's 0.3% cap is a different regime again.
Re-read the configuration rather than caching it. 44 of Binance's 570 perpetuals had their funding configuration changed in the 90 days to 2026-08-16, and ACEUSDT spent 66 settlements on an interval its own instrument list no longer shows.
The free funding rate calculator does the second step on one position, including the interval, and the free liquidation calculator sizes the position that funding is charged on in the first place. The measured behaviour of the rate inside a single interval is in what funding does in the hours before settlement.
What this measurement does not show
It is one day. The census is a snapshot of 2026-08-16 08:48 UTC, confirmed by a second pull 8 minutes later. Of the 533 Binance perpetuals carrying an update stamp, 300 were reconfigured in the last year, so these counts move. Re-run them rather than quoting ours in six months.
It is the linear boards only. We counted each venue's linear board and nothing else. Binance's 20 coin margined perpetuals, Bybit's 22 inverse ones, Bitget's 49 USDC margined and 9 coin margined contracts and OKX's 15 inverse swaps are not in the totals; of those 115, 18 are on a 4 hour clock, so folding them in would move 1,422 of 2,536 to 1,440 of 2,651 and change nothing. Binance's 163 non-crypto perpetuals are excluded on subject matter.
Four venues are not the market. We scoped the census to four centralised venues. Hyperliquid publishes a machine readable universe of 232 entries of which 177 are live, and every one of them settles hourly, so there is no per instrument variation there to count. It appears above rather than in the census only because we drew the line at centralised boards.
A rate at one instant is not the cost of holding. Every count of symbols quoting exactly 0.005000% or 0.010000% is a count at 2026-08-16 08:48 UTC, and the ranking figures are from the same instant. Positioning moves the number before it settles, and the daily cost of a real position is the sum of what settles while it is open.
The cap is a ceiling, not a forecast, except when it is not. Across the 17 symbols whose settlement history we pulled, all of them high turnover rather than a random draw, exactly 1 of 3,400 settlements hit a limit, and it was a floor rather than a cap: ACEUSDT settled at -2% on 2026-08-07 08:00 UTC, the same stamp that opens its hourly block above. ONEUSDT is the counterexample: its lowered cap has bound on 6 of its last 6.
A funding number you cannot convert is a number you cannot compare, and the conversion is one line of arithmetic. Athenum keeps a calculator for it among 34 that are free to use: none of them asks for an account, none collects an email address, and none meters how often you run it. The live derivatives feed those calculators sit beside is the same feed whose Hyperliquid column this post has just criticised, and correcting that column is the work this measurement created. If you would like to watch that happen from the inside, Athenum opens on a free 7 day Pro+ trial with no card.
One terminal. All the data.
Liquidations, orderbook depth, whale walls & open interest from 4 exchanges, all real-time, in one place.
No credit card required

Athenum Analytics
Athenum Analytics is our three-person editorial team covering crypto derivatives, market data and macroeconomic context.