Table of Contents3 sections
This dated research note preserves the earlier article's snapshot context and corrects its interpretation. It is not a current funding reading. For the formula and general limitations, use the OI-weighted funding methodology guide.
What the original article recorded
The original article described an Athenum BTC panel at 27 June 2026, 23:37 UTC: approximately $16.50 billion of cross-venue OI and a displayed eight-hour composite of +0.0024%. It also described annualized venue rates ranging from approximately −6% to +8%. These are historical statements from the original publication. The underlying timestamped response bundle was not available for the 24 September revision, so we cannot independently reconstruct that composite or certify its interval alignment.
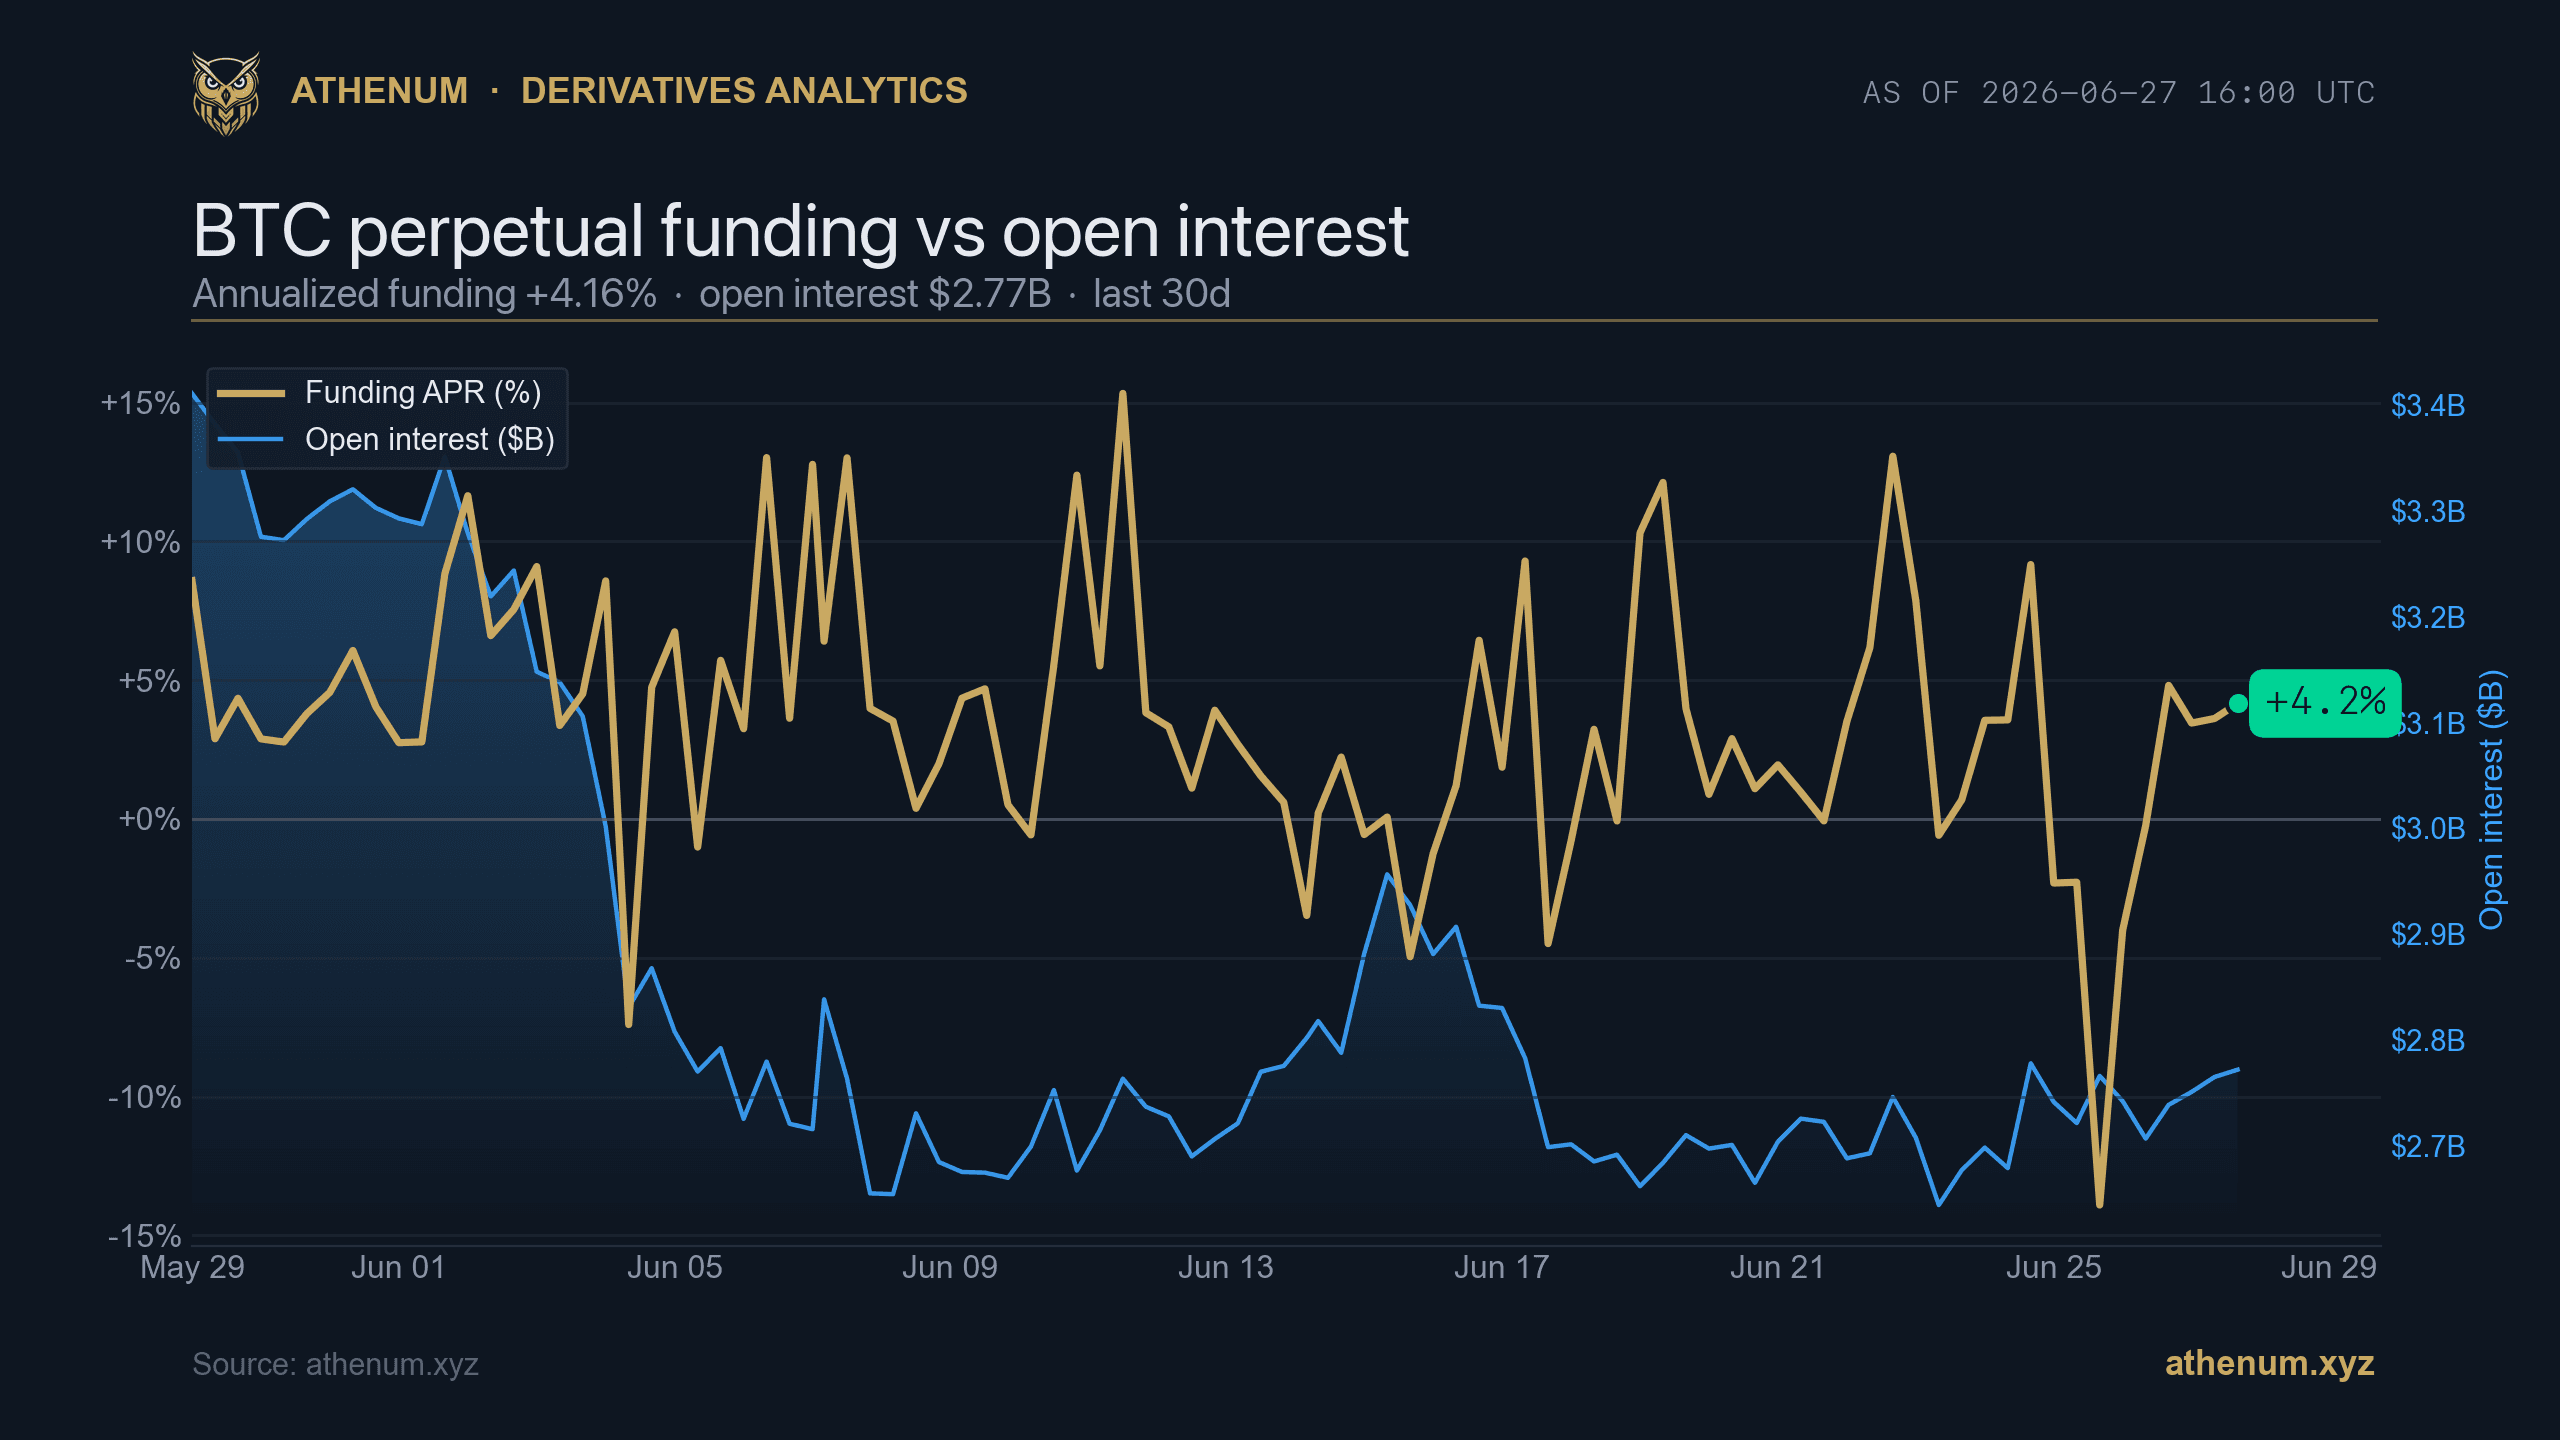
The single-contract chart in the earlier article described a different scope: roughly $2.77 billion OI and 4.16% annualized funding. Comparing that chart directly with a cross-venue total conflates a single contract with a basket. The chart is not evidence that either aggregation is correct.
What can be checked
The displayed rounded rate, +0.0024% per eight hours, annualizes simply to 2.628% using 3 × 365 payments. It does not reproduce an exact 2.7% figure; unrounded inputs or a different convention would be needed to explain that difference. Annualization is an assumption of a constant rate, not a realized annual return.
The venue-rate range alone is insufficient to recalculate the weighted average. Reproduction requires every included instrument's original rate, interval, settlement/estimate flag, USD OI, conversion price, timestamp, and inclusion rule. Missing observations must remain missing rather than silently receiving a zero value.
Corrected interpretation
The old text called one average dishonest and described a positive weighted rate as an “honest bullish” reading. Those claims were too strong. Equal weights and OI weights answer different descriptive questions. Funding indicates which side pays under the contract rules; it does not show a net bullish position or establish the direction of the next return.
The value of this case is the audit trail: it shows why a readable dashboard snapshot still needs a recorded input set, compatible intervals and an explicit venue universe before it becomes reproducible research. No missing June observations have been reconstructed or replaced with simulated data.
For actual dated observations now available, see BTC funding and BTC open interest. Revision and calculation check: 24 September 2026. The original publication date remains 27 June 2026.
Archived illustrations from the original publication. These preserve its visual record; their historical inputs have not been independently reproduced in this revision.


One terminal. All the data.
Liquidations, orderbook depth, whale walls & open interest from 4 exchanges, all real-time, in one place.
No credit card required

Athenum Analytics
Athenum Analytics is our three-person editorial team covering crypto derivatives, market data and macroeconomic context.