Table of Contents8 sections
- What are the non-crypto perpetuals on Binance, and how many are there?
- Do stock perpetuals trade when the stock market is closed?
- Did the weekend trading actually discover a price?
- What price do these contracts settle against when the cash market is shut?
- What does funding do on a contract whose underlying has no price?
- How does this compare with an asset that never closes?
- What should you check before holding one of these over a weekend?
- What this measurement does not show
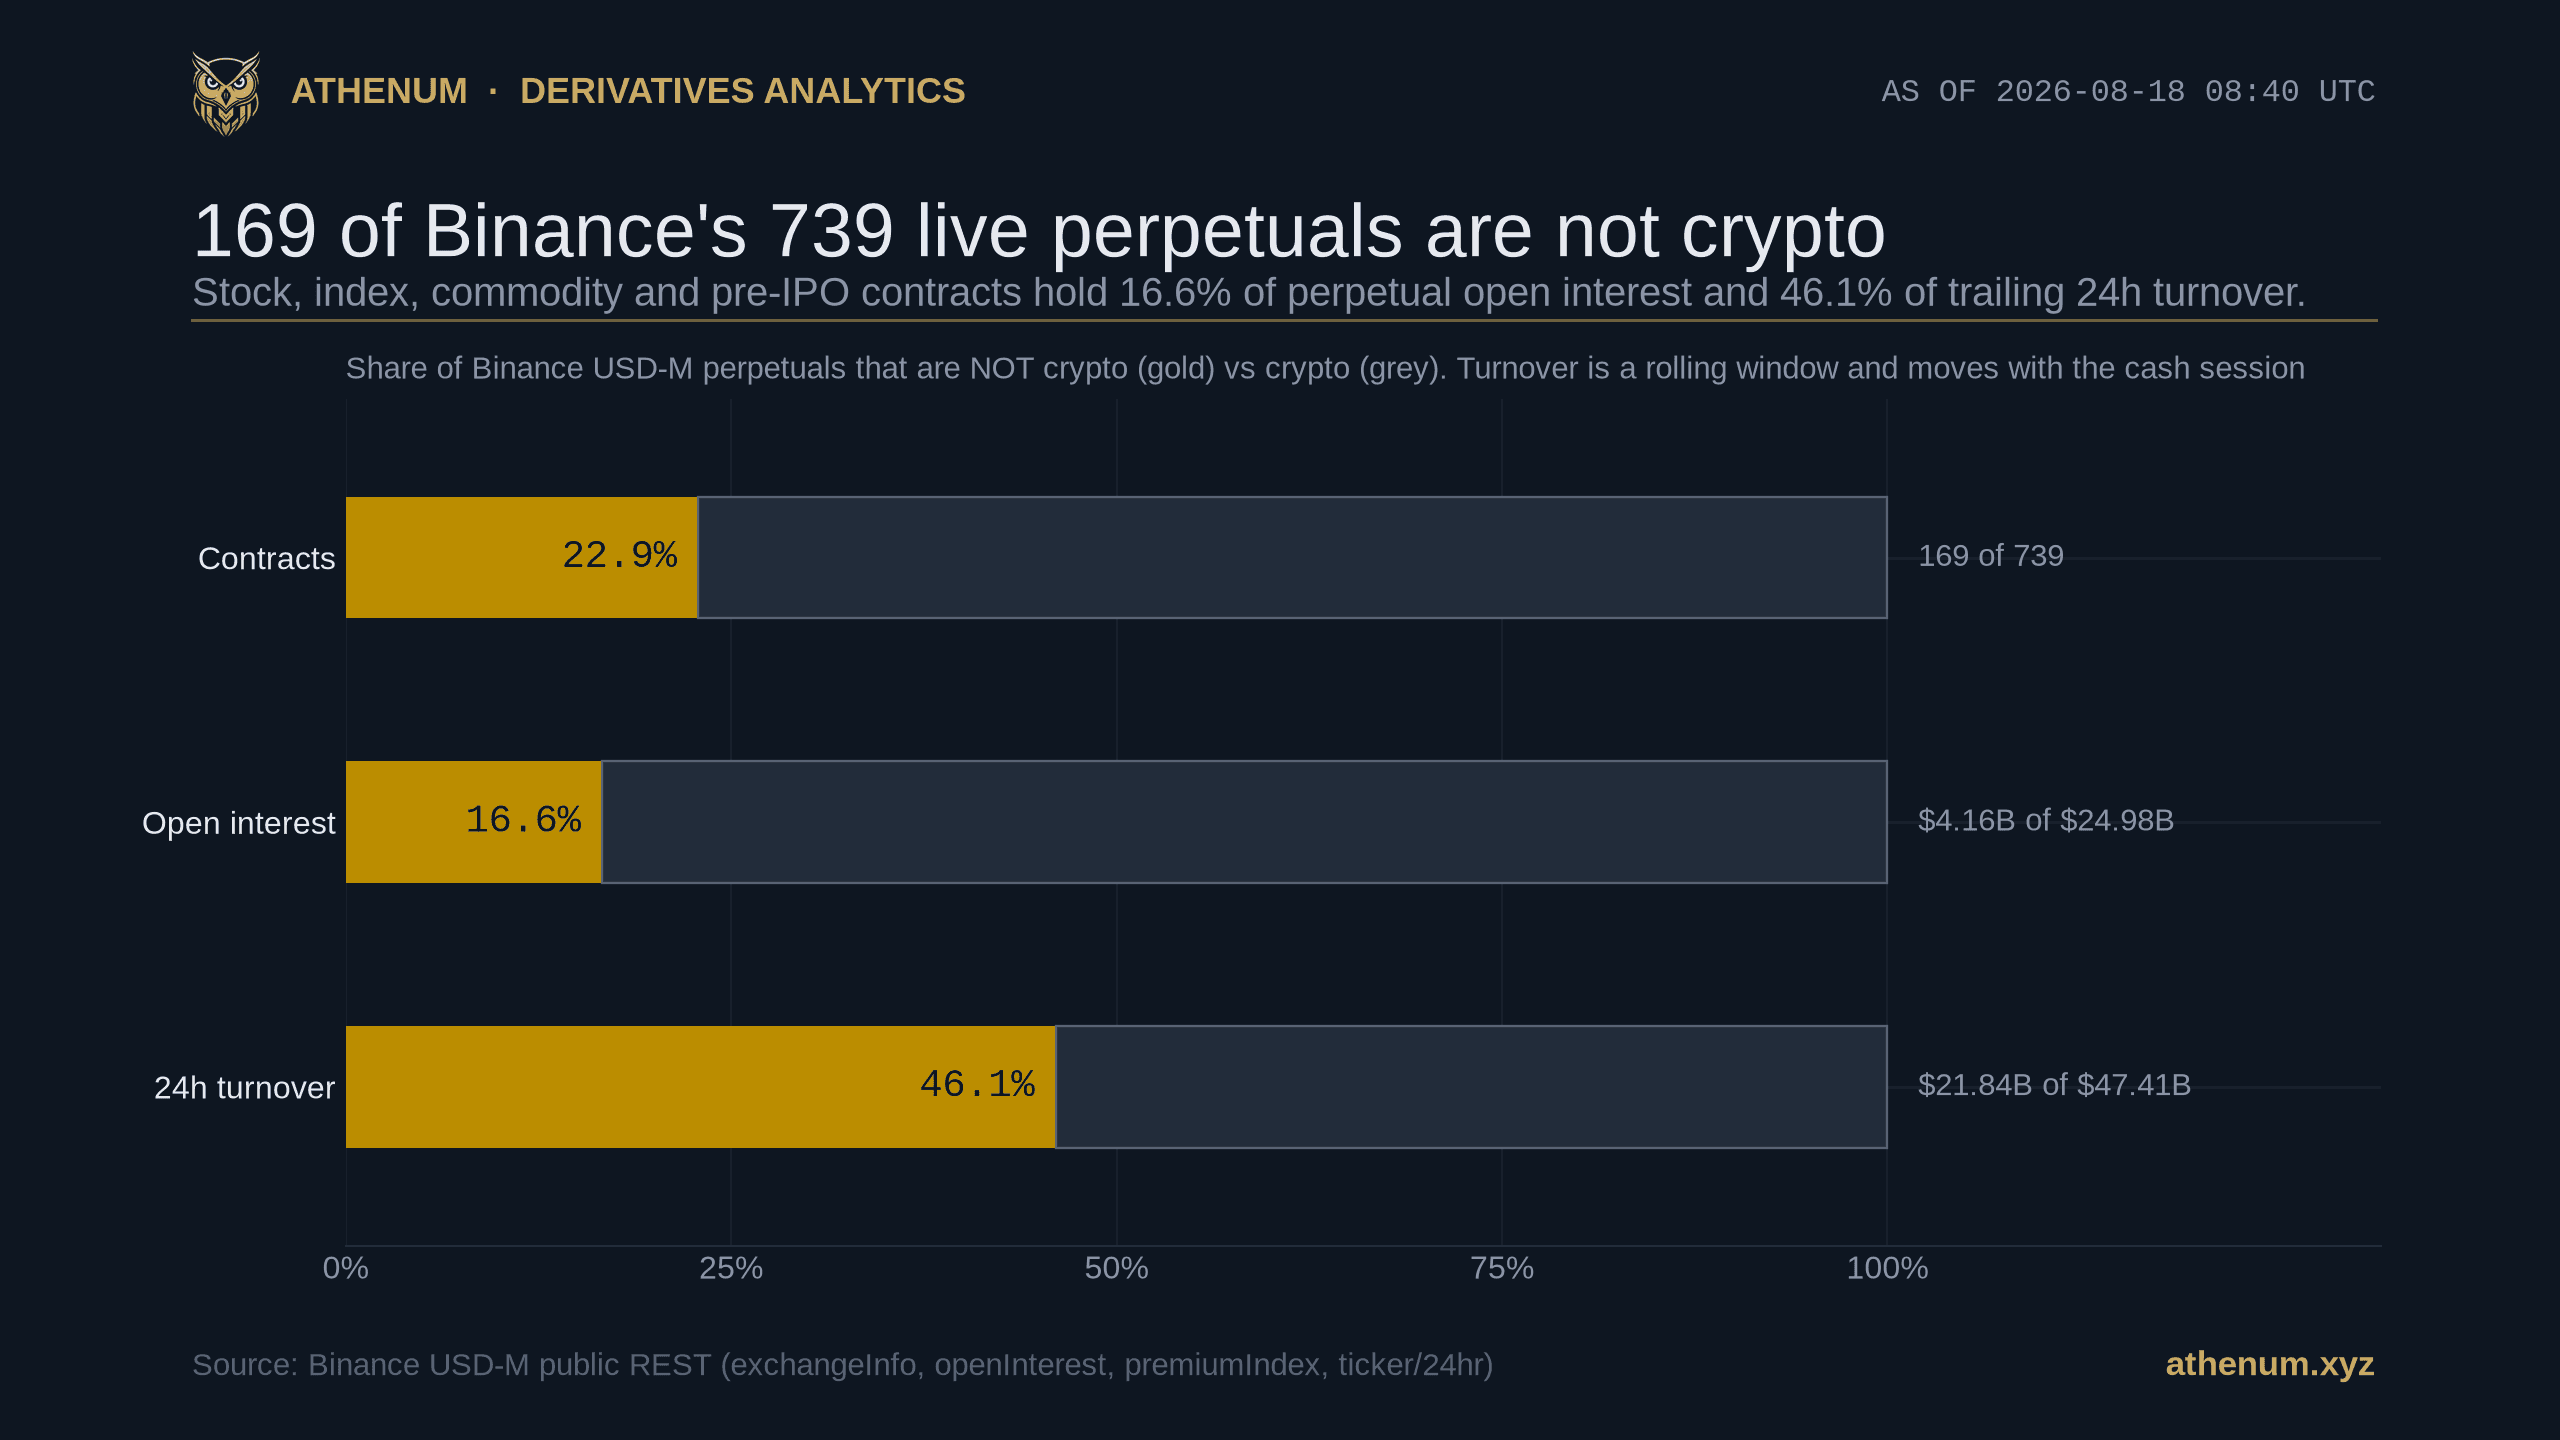
TLDR. Binance's USD-M futures board is no longer only crypto. Counted on 2026-08-18 08:40 UTC, 169 of its 739 live perpetual contracts track something else: 138 US equities, 12 Hong Kong names, 8 Korean ones, 8 commodities, 1 mainland Chinese name and 2 pre-IPO companies. That is 22.87% of the contracts and, at that same 2026-08-18 snapshot, 16.64% of the open interest, $4.16B of $24.98B. Rewind to Saturday 2026-08-15: with every stock market behind the 153 share tracking contracts live that day shut for the full 24 hours, all 163 contracts that existed then traded, 158 traded in every single hour, and they turned over $1.23B, $821M of it on the contracts that track a listed share. What that liquidity did not do is discover a price: of the 28 contracts that cleared $5M on the day, the median closed +0.09% from where it opened, and only 2 of 28 moved more than 2%. Both are the pre-IPO contracts, and they are the only 2 of the 169 for which Binance publishes no index composition and no index price series at all.
What are the non-crypto perpetuals on Binance, and how many are there?
They are perpetual futures on shares, indices, commodities and two private companies, quoted and margined in USDT, and Binance labels them in its own instrument list. The public exchangeInfo endpoint gives every contract a contractType, and 169 live ones carry TRADIFI_PERPETUAL instead of PERPETUAL. Each also carries an underlyingType, which is how the breakdown below is derived rather than guessed from the ticker.
Underlying type | Contracts | Examples |
|---|---|---|
EQUITY | 138 | TSLAUSDT, NVDAUSDT, GOOGLUSDT, MSTRUSDT, COINUSDT |
HK_EQUITY | 12 | TENCENTUSDT, MEITUANUSDT, KUAISHOUUSDT |
COMMODITY | 8 | XAUUSDT (gold), XAGUSDT (silver), CLUSDT, BZUSDT |
KR_EQUITY | 8 | SAMSUNGUSDT, SKHYNIXUSDT, NAVERUSDT, HYUNDAIUSDT |
PREMARKET | 2 | OPENAIUSDT, ANTHROPICUSDT |
CN_EQUITY | 1 | CXMTUSDT |
The equity bucket is broader than single names. It holds index and sector trackers (QQQUSDT, SPYUSDT, IWMUSDT, SMHUSDT, XBIUSDT, XLEUSDT), country funds (EWYUSDT for Korea, EWJUSDT for Japan, EWZUSDT for Brazil), and the tickers of leveraged and inverse exchange traded funds (TQQQUSDT, SQQQUSDT, SOXLUSDT, SOXSUSDT, TZAUSDT, KORUUSDT, UVXYUSDT). A margined perpetual on a fund that is itself geared is leverage applied to leverage, and the contract's own margin schedule does not say so.
This is recent, and it is fast enough that you can watch it move. Dating each contract by the onboard timestamp in the instrument list, the build out ran 1, 4, 7, 7, 12, 28, 51, 40 and 19 new contracts per month from December to August, with June 2026 the largest month at 51. The board went from one non-crypto perpetual to 169 in nine months. We can be unusually precise about the current pace, because we measured this board twice: at 2026-08-17 09:33 UTC it held 163 contracts and at 2026-08-18 08:40 UTC it held 169. The six that appeared in those 23.1 hours are GDXUSDT, NETUSDT, VSTUSDT, SHOPUSDT and LYTEUSDT, all stamped 2026-08-17, plus CXMTUSDT stamped 2026-08-18, which is also the first contract on the board to carry the CN_EQUITY label.
That onboard timestamp is usually the launch itself: XAGUSDT's reads 2026-01-07 and TSLAUSDT's 2026-01-28 14:30 UTC, both matching Binance's own announcements to the minute. Gold is worth a footnote: XAUUSDT's stamp is 2025-12-11 and it did print trades from that hour, 4,695 of them in the first hour and $5.24M on day one, and it mostly ran in single digit millions a day, apart from a burst around the new year that reached $14.34M on 2025-12-29, $11.51M on 2025-12-30, $13.03M on 2025-12-31 and $10.59M on 2026-01-02, until Binance's public launch on 2026-01-05 took it to $19.68M and 62,200 trades.
It is also concentrated. The top five by open interest on 2026-08-18, SNDKUSDT at $594M, SKHYNIXUSDT at $497M, XAUUSDT at $422M, SPCXUSDT at $334M and SKHYUSDT at $242M, hold 50.3% of the $4.16B between them. The long tail of famous tickers is thin: on 2026-08-18 GOOGLUSDT carried $74.8M of open interest and TSLAUSDT $43.1M.
Do stock perpetuals trade when the stock market is closed?
Yes, and not in a token way. Saturday 2026-08-15 is the clean test, and it is worth being exact about why. 153 of the 163 contracts live that day tracked a listed share, and every one of those listing venues was shut for the entire 24 hours. We found no US regulated cash equities venue running a Saturday session, neither a national securities exchange nor an ATS trading NMS stocks. The overnight ATSs that quote US names outside regular hours, Blue Ocean and its two competitors, run Sunday night to Thursday night only, and Blue Ocean states the reason plainly: the trade reporting facility it reports to is not available on a Saturday. The rails, not the appetite, set the boundary.
The near 24 hour US sessions that regulators have approved were not running either, and this is the part most people get wrong. 24X National Exchange has traded an ordinary weekday schedule since October 2025, so it is live; what has not started is its overnight session, and an SEC order published on 2026-08-14, the day before our Saturday, records exactly that. Nasdaq's 23/5 approval, NYSE Arca's and the Cboe equivalent all target December 2026. The detail worth carrying away is that none of them fixes this: the approved 23/5 schedule runs Sunday evening to Friday evening, so Saturday is excluded by design rather than by delay. Hong Kong and Korea, for their part, do not hold Saturday sessions at all, and 2026-08-15 was additionally Korea's Liberation Day.
The 2 pre-IPO contracts have no listed market to be open. The 8 commodities are the honest caveat, and it is bigger than a footnote: the big futures sessions that price crude and the metals keep a weekend break, and we could establish a live weekend market for only 6 of the 8. Coinbase Derivatives, a CFTC designated contract market, self-certified a trading week that runs straight through the weekend for its gold and silver futures, effective trade date 2026-05-04, and by the Saturday we measured those two contracts sat in the venue's published weekend trading set. It is a continuous week rather than a true 24/7 one: there is still a one hour maintenance break on Fridays. Binance's own constituents endpoint, read on 2026-08-18, names Hyperliquid's 24/7 perpetual venue as an index source for four more: a 1% weight on CLUSDT, COPPERUSDT and NATGASUSDT, and on BZUSDT the entire index, a single constituent at 100%. Those markets sit in Hyperliquid's builder deployed segment rather than its main list, and re-measured on 2026-08-18 they did not pause: its WTI perpetual printed in all 24 Saturday hours for $39.8M of notional on 45,220 trades, its Brent perpetual in all 24 for $21.4M, its copper perpetual in all 24 for $4.6M, and its natural gas perpetual in 22 of 24 for $0.5M. Gold's index also carries Binance's own tokenized gold spot pair at a 0.826% weight, and that never closes either.
The two we could not clear are platinum and palladium. Read on 2026-08-18, XPTUSDT and XPDUSDT each carry exactly two index sources, 50% dxfeed and 50% pyth_pro, with no 24/7 leg of any kind, so we make no claim about where they were priced that Saturday. So the clean part of this test is the 153 share tracking contracts, and the eight commodities are not clean at all.
Across that Saturday, every one of the 163 contracts printed at least one trade, 158 of them printed in all 24 hours, and the board turned over $1.23B. Two thirds of that is shares: $750M on the US listed equity contracts, $63.9M on the Korean ones and $6.7M on the Hong Kong ones, $821M together, against $384M on the eight commodities and $26.9M on the two pre-IPO contracts. The hours were not uniform. The busiest, 07:00 to 08:00 UTC, did $127M; the quietest, 20:00 to 21:00 UTC, did $20.9M; the median hour did $44.3M. The shape follows Asian waking hours rather than New York ones, which is what you would expect of a book whose participants are crypto accounts.

Hourly turnover on the 163 Binance non-crypto perpetuals live through Saturday 2026-08-15, re-derived 2026-08-18 with every stock market behind them shut. Turnover per hour spans $20.9M to $127M around a $44.3M median, and the lower panel counts the contracts that did NOT print in a given hour, which is zero in 18 of the 24 hours and never rises above 2.
Set against a normal week, though, it is a thin market. Re-derived on 2026-08-18, the 60 hours from Friday 2026-08-14 20:00 UTC to Monday 2026-08-17 08:00 UTC carried $7.35B on those contracts, or $122M an hour. The Tuesday to Thursday baseline, re-derived on 2026-08-18 from the same hourly bars, ran at $774M an hour. The weekend runs at 15.8% of the weekday rate. The market stays open; about 84% of its usual participation does not.
There is a second, cruder version of that comparison, and it fell out of measuring the board on two consecutive days. The venue's trailing 24 hour turnover figure is a rolling window, so the pull at 2026-08-17 09:33 UTC covered a window that was mostly the shut Sunday, and the pull at 2026-08-18 08:40 UTC covered a full Monday US cash session. Between those two reads the non-crypto contracts went from $5.73B to $21.84B of trailing turnover, up 281%. The crypto perpetuals on the same board over the same two windows went from $19.41B to $25.57B, up 32%. So the jump is specific to the contracts whose underlying market reopened, rather than a general surge in Binance volume, and the non-crypto share of board turnover moved from 22.78% to 46.07%. That is one pair of readings rather than a study, but it is a control that could have failed and did not.
Did the weekend trading actually discover a price?
Mostly, no, and this is the part that a turnover headline hides. Take the 28 contracts that cleared $5M of turnover on Saturday, so that the sample is contracts with a real book rather than a stray fill. Compare where each opened the day with where it closed it.
The median contract closed +0.09% from its open. The whole distribution spans -0.81% to +8.64%, and only 2 of the 28 moved more than 2%. The median contract's intraday high to low range was 1.05%. Volume, in other words, went round in circles: positions changed hands all day and the level barely moved. The one reading at the bottom of that range is CLUSDT at -0.81%, and we checked whether that meant anything and concluded it does not: SNXXUSDT closed -0.79% and BZUSDT -0.78%, three contracts inside 0.03 percentage points of each other, with the next one 0.14 points clear. Two of the three are the commodities whose index carries a 24/7 Hyperliquid leg. The third is an equity whose only round the clock constituent is a 0.735% pointer at its own Binance future. Whatever pulled the bottom of this distribution down did not sort by how live the index was.

Each dot is one of the 28 contracts that cleared $5M on Saturday 2026-08-15, re-derived 2026-08-18. The median closed +0.09% from its open and 26 of the 28 stayed inside 2%. The two exceptions are ANTHROPICUSDT at +8.64% and OPENAIUSDT at +3.40%, the two pre-IPO contracts, and they are also the only two of the 169 for which Binance publishes no index composition at all.
The two exceptions are worth naming. ANTHROPICUSDT closed +8.64% and OPENAIUSDT +3.40%, on $20.0M and $6.9M of Saturday turnover. Every other contract with a real book stayed inside 2%. Both track a private company with no listed share price at all.
Two contracts is an anecdote, so we ran the same test on the whole board rather than on the sample. Split all 163 contracts live that Saturday by whether Binance publishes the composition of the index, and score each one over the same day. Of the 2 whose composition the venue does not publish, 2 moved more than 2%. Of the 161 whose composition it does publish, 6 did: HANMIUSDT at -4.90%, KODEX200USDT at +3.16%, PYPLUSDT at +2.99%, MINIMAXUSDT at +2.94%, LGELECTRONICSUSDT at +2.62% and BEUSDT at +2.17%. Median absolute move 6.02% against 0.368%, and a one sided Fisher exact test on that two by two returns 0.0021. Read that p-value carefully, because it is pinned to the floor: with only 2 contracts on the unpublished side, both of them moving is the most extreme table this split can produce, so 0.0021 is the smallest number the test could ever have returned here. It says both of the two are movers. It cannot say more than that.
Then we tried to kill it, and part of it died. Three of the six on the published side, HANMIUSDT, KODEX200USDT and LGELECTRONICSUSDT, were listed on 2026-08-14, one day before the Saturday we measured, so a brand new contract finding its level is a competing explanation that has nothing to do with the index. That confound cuts against the effect on the published side, not for it. The pair on the unpublished side is not new by any reading: OPENAIUSDT was listed 2026-05-26 and ANTHROPICUSDT 2026-06-02. What remains is an association measured on 163 contracts, with the two contracts that carry it seasoned rather than freshly listed, and a sample of two on one side that no p-value can make larger.
What price do these contracts settle against when the cash market is shut?
Binance documents the answer, and it is not the mechanism it uses the rest of the week. Its FAQ for these contracts describes a price index that switches mode with the session: a vendor weighted average updated every second during regular hours, a fast decaying exponentially weighted average through pre-market and after-hours, a slower decaying one overnight, and a separate mode for daily maintenance, holidays and weekends. That weekend mode used to hold the index fixed at its last available value. Since 2026-05-08 21:00 UTC for the commodity contracts and 2026-05-16 00:00 UTC for the equity ones it is an order book mode instead. Binance's wording is that the index price then uses the impact mid price derived from the order book, which is the average of the impact bid and the impact ask, in place of the vendor prices.
Read that again, because it is the mechanism underneath the whole of this post. Over a shut weekend the anchor is the venue's own book. The contract is not tracking an outside price for those hours; it is tracking itself, smoothed. That does not pin the traded price, which is set by whoever is trading, but it does mean the reference these contracts are marked and liquidated against comes from inside rather than outside over a closed weekend.
The composition of that index is a second question, and Binance publishes it per contract on a public constituents endpoint. We asked it for all 169 on 2026-08-18. What comes back is checkable in its structure and unusable in its prices.
167 of the 169 return a composition. Only 2 do not, ANTHROPICUSDT and OPENAIUSDT, which answer HTTP 400 with error -1121, Invalid symbol. Those same two are the only ones whose index price series endpoint also returns an error, so there is no external index for them to be anchored to at all, and the venue does not claim there is. At every read on 2026-08-18 their mark price and their index price were the same number to the last decimal. That equality on its own is not the tell, because mark sits on index whenever the premium is zero, and across four full board reads on 2026-08-18 the number of contracts printing the two identical ranged from 13 to 18 of the 169, a different set each time. The missing series is the tell, and only those two have it.
The prices are the other half of the story. Across the 167 contracts that do return a composition, the number that return a live price for even one index source is 0. Every constituent price comes back as -1. Compare BTCUSDT, which returns 8 named crypto exchanges (binance, okex, coinbase, gateio, kucoin, mexc, bitget, bybit) with 8 live prices and 8 weights visible, so anyone can rebuild that index from public data and check it. TSLAUSDT returns 6 sources, five market data vendors (databento, dxfeed, kaiko, massive, pyth_pro) plus Binance's own TSLAUSDT future at a 0.735% weight, and 0 prices. XAUUSDT returns 5, one of which is Binance's own tokenized gold spot pair at 0.826%, and 0 prices.
So the ordering is: the contract with the most checkable index is the crypto one, the contract that moved most on a closed Saturday is one of the two with no external index at all, and every single one of the 167 hides the prices its index is built from.
Two structural details are worth reading off the same sweep. First, 160 of the 167 carry a leg pointing at Binance's own market. Second, the index is sometimes far thinner than the phrase vendor weighted average suggests, and how thin is itself a moving target. Sweeping the endpoint three times inside a minute returns a bit-identical histogram of sources per contract; sweeping it again half an hour later does not, because the databento leg drops in and out of contracts wholesale. We are not going to publish a distribution that will not sit still. What did hold across every sweep we ran on 2026-08-18 is the thin end of it: exactly 5 contracts have a two source index, CLUSDT, COPPERUSDT, NATGASUSDT, XPTUSDT and XPDUSDT, and exactly 1 has a single source. That one is BZUSDT, the Brent crude perpetual, whose entire index is one constituent at 100%: Hyperliquid's Brent market, a 24/7 crypto venue. Hyperliquid appears in 8 of the 167 indices in total, including a 0.98% leg in each of SKHYNIXUSDT, SAMSUNGUSDT and HYUNDAIUSDT, and 9.01% of CXMTUSDT, the mainland Chinese contract listed on 2026-08-18.

Hourly closes through Saturday 2026-08-15, re-derived 2026-08-18, each indexed to 100 at the Saturday open, which is why no line starts exactly on 100. SNDKUSDT, the largest non-crypto contract by open interest, spends the whole day between 0.25 and 0.75 per cent below its open, a band 0.50 per cent wide; gold stays inside 0.11 of its open and Bitcoin inside 0.18. ANTHROPICUSDT, whose constituents endpoint returns Invalid symbol and whose mark price and index price print the identical number to the last decimal, peaks at 110.4 and ends at 108.6.
What does funding do on a contract whose underlying has no price?
It stops carrying information, and you can see exactly where that happens.
Over the same 60 hour window, per contract:
Contract | Settlements | Distinct values | Sum over the window | Cap |
|---|---|---|---|---|
BTCUSDT | 7 | 7 | +0.0303% | 0.3% |
SNDKUSDT | 7 | 2 | -0.0843% | 2% |
SPCXUSDT | 7 | 3 | -0.0249% | 1% |
TSLAUSDT | 7 | 1 | 0.0000% | 2% |
XAUUSDT | 15 | 1 | 0.0000% | 0.5% |
ANTHROPICUSDT | 7 | 1 | +0.0350% | 2% |
OPENAIUSDT | 7 | 1 | +0.0350% | 2% |
Bitcoin's seven settlements were seven different numbers. Tesla's seven and gold's fifteen were all exactly zero, which is the resting point of the funding formula rather than a defect: while the premium sits inside the clamp band the rate does not move off its anchor, and over a shut weekend the premium had nothing to push it. Gold settles every 4 hours and the other six every 8, which is why its count is 15 rather than 7.
The pre-IPO pair is the different case. ANTHROPICUSDT and OPENAIUSDT each settled seven times at exactly +0.005000%, the same number every time. Widening the history to the full record the endpoint returns, and re-read on 2026-08-18, ANTHROPICUSDT has settled 232 times since 2026-06-02 and OPENAIUSDT 252 times since 2026-05-26, and across all 484 settlements between them there is exactly 1 distinct value: +0.005000%. Not one settlement has ever differed. Over the same kind of window BTCUSDT's last 500 settlements contain 473 distinct values, and TSLAUSDT's last 500 contain 192, spanning -0.894634% to +0.501386%.
So on the pre-IPO contracts the funding rate is a constant, and Binance says so in advance: its own material states that during the pre-IPO trading period the funding rate is 0.005% every 8 hours. A long pays that whatever the book is doing, about 5.5% a year simple. It is a fee, not a signal, and reading it as positioning is reading a number that has never once moved.
How does this compare with an asset that never closes?
This is where a cross-venue view earns its keep, because the contrast is not the level of funding but whether the number varies at all. Bitcoin has no closing bell and no single venue, so the same instrument prices continuously in several books at once.
Athenum's own cross-venue feed carried a Bitcoin reading in every one of the 60 hours of that weekend window, with Binance, Bybit, OKX, Bitget, Deribit and Hyperliquid quoting side by side. Across the 24 Saturday hours the funding those venues were quoting spanned a real range on every one of them: Binance from +0.00099% to +0.00939% with a median of +0.00643%, Bybit +0.00050% to +0.00879% around +0.00432%, OKX +0.00537% to +0.01000% around +0.00735%, and Bitget +0.00479% to +0.01000% around +0.00958%. The dispersion is still there today: over the completed hour beginning 2026-08-18 08:00 UTC the same feed put Bitcoin at $64,200 with those four venues at +0.005471% on OKX, +0.006060% on Binance, +0.006700% on Bybit and +0.007948% on Bitget per 8 hours, a spread of 0.002477 percentage points across one asset in one hour. That is a closed bucket rather than a live one, which matters: read while the hour was still filling, the same four venues gave a spread of 0.002572, and quoting a part-formed bar as an instantaneous reading is its own small error.

Bitcoin funding per 8 hours across four venues, from Athenum's no-auth cross-venue feed, one reading per hour through Saturday 2026-08-15, re-derived 2026-08-18. Every venue's bar has width, and the medians disagree by more than a factor of two between Bybit at +0.0043% and Bitget at +0.0096%. That is the contrast with the pre-IPO contracts above, whose funding has printed one single value across 484 settlements.
Two caveats on that comparison, because they change what the numbers mean. The feed also carries Deribit and Hyperliquid: Deribit's median across the same hours was 0.0000%, and Hyperliquid's column is passed through at that venue's native hourly basis, a median of +0.00125% per hour rather than per 8 hours, so neither belongs in a like for like list without conversion. Correcting that column is work our own funding census already put on the list, and we would rather say so than quietly drop the venue from the chart.
What should you check before holding one of these over a weekend?
Check what the index is, not just that there is one. Pull the constituents endpoint for the exact symbol, and pull the index price history too. On this board the first one never gives you a source price, and for the two pre-IPO contracts it gives you nothing at all; the second is what separates a contract whose index recipe is published but whose prices are not, from one that has no external index series to begin with. That is a different risk from a wide spread, and it does not show up on a chart.
Check the funding interval and the cap for that symbol. They are not the same across this board: 158 of the 169 settle every 8 hours and 11 every 4, and the caps are 2% on 157 of them, 0.5% on 11 and 1% on 1, against 0.3% on BTCUSDT. Athenum's free funding rate calculator turns a rate and an interval into the cost of holding a position for a given number of days, which is the number that matters over a three day weekend. The interval being a per symbol setting rather than a per venue one is the subject of our census of every live crypto perpetual, which deliberately left these contracts out.
Size for the reopen, not for the weekend. The Saturday tape says the market barely moved. The risk is what happens when the cash market reopens and the perpetual has to meet it, and the 281% turnover jump between our two reads is what that reopen looks like from the outside. The free liquidation calculator shows where a position stops surviving that move, and the free position size calculator works backwards from the gap you are willing to absorb.
Do not read weekend funding as positioning. On the contracts whose funding sat at exactly zero or exactly 0.005% for the entire window, there is no positioning information in it to read. Where the mark price, the index price and the last price differ is the mechanism underneath that.
Check whether you can trade it at all. Binance states that these contracts trade on Nest Exchange Limited, a recognised investment exchange regulated by the Financial Services Regulatory Authority of the Abu Dhabi Global Market, with clearing and custody in a separate entity, Nest Clearing and Custody Limited. Its launch notes say the products may not be available in your region. Availability is a matter for the venue's own terms rather than for a chart.
What this measurement does not show
Not every underlying is equally shut. Several of the 138 US equity contracts track crypto linked businesses, among them MSTRUSDT, COINUSDT, CRCLUSDT, HOODUSDT, BITOUSDT, IRENUSDT and BMNRUSDT. Their listing venue was closed on the Saturday; the market that drives them was not. For that subset the phrase no outside price is a weaker statement than it is for, say, WMTUSDT.
It is one venue. Everything above is Binance's USD-M board. Other venues list equity and commodity perpetuals too, and their instrument metadata, index construction and funding configuration are their own. Nothing here transfers to them without being re-measured.
It is one Saturday, and the rest of the weekend is a different story. The +0.09% median is the Saturday alone. Run the same measurement over the full 60 hour window and the contracts clearing $5M have a median of +1.67%, a spread of -5.66% to +12.23%, and more than half of them moving more than 2%. Prices did move across the weekend; what the Saturday shows is that they did not move on the day when nothing behind them was open. A single weekend also cannot tell you whether this one was typical.
The $5M filter is a choice, and one conclusion depends on it. The median is stable: +0.15% at $1M across 65 contracts, +0.16% at $2M across 42, +0.09% at $5M across 28, +0.03% at $10M across 16. The count of contracts moving more than 2% is not. At $5M and $2M it is the two pre-IPO contracts and nothing else, at $10M OPENAIUSDT drops out of the sample and only ANTHROPICUSDT clears the bar, and at $1M two more join, MINIMAXUSDT at +2.94% on $1.73M and BEUSDT at +2.17% on $1.93M, neither of them a thin book with one fill, and both of them contracts that do return an index composition. So read the pairing of large weekend moves with a missing index as a feature of the liquid end of this board, not as a law.
The composition endpoint's own coverage moves. The 167 of 169 figure is a reading taken on 2026-08-18 and re-confirmed contract by contract on the Korean names, which are the ones we had most reason to doubt. An endpoint census is a snapshot of an endpoint, not a property of the venue, so re-run it rather than quoting ours.
Turnover is not open interest. The $1.23B Saturday figure is contracts changing hands, not new money committed. The $4.16B open interest figure is a snapshot at 2026-08-18 08:40 UTC and is a different quantity measured a different way; neither number bounds the other. The $21.84B trailing turnover figure is a third quantity again, over a rolling window the venue chooses.
The zero funding readings are a resting point, not a rule. TSLAUSDT has settled at exactly zero 309 times in its last 500 settlements, and XAUUSDT 306 times in 500, so zero is common rather than universal. TSLAUSDT has printed large rates in that history; XAUUSDT's largest in 500 settlements is +0.033369% and it has never printed a negative one. The two pre-IPO contracts are the opposite case: they have never printed a second value at all, and the one they print is not zero.
Counted contracts and counted money agree on one of these splits and not the other. The non-crypto share is 22.87% by contract and 16.64% by open interest, close enough that either supports the same sentence, but 46.07% by trailing turnover, which supports a very different one. On the same venue's funding intervals the two disagree harder still: 76.0% of its crypto perpetuals settle every 4 hours by count, and those same contracts hold 13.3% of its crypto open interest, against 86.7% on the 8 hour clock. We computed all of them rather than assuming.
What did reproduce exactly. Every Saturday number in this post was derived on 2026-08-17 and derived again from scratch on 2026-08-18, and the second pass returned the identical values: $1,231,589,063.99 of turnover, 163 contracts trading, 158 in all 24 hours, a $20,875,083 quietest hour and a $127,146,074 busiest one, 28 contracts over $5M, a +0.0875% median move and a -0.8076% to +8.6400% span. Historical bars are supposed to be immutable and here they were. The live snapshot in the same file was not: the board, the turnover and the index coverage all moved between the two runs, which is why every current number above carries the later date.
The distinction that survives all of this is between a market that quotes and a market that prices, and on the Saturday we measured, this board did a great deal of the first and very little of the second. What made that visible was running the identical measurement twice, a day apart: the historical half came back to the cent, and the live half had moved underneath it while nothing announced that it had. If you want to run the funding arithmetic here yourself, the 34 calculators at Athenum are open to anyone: they ask for no account, capture no email address and meter nothing, and the normalized cross-venue derivatives feed that produced the Bitcoin comparison above sits behind a free 7 day Pro+ trial that does not ask for a card.
One terminal. All the data.
Liquidations, orderbook depth, whale walls & open interest from 4 exchanges, all real-time, in one place.
No credit card required

Athenum Analytics
Athenum Analytics is our three-person editorial team covering crypto derivatives, market data and macroeconomic context.