Audit open-interest data before interpreting it · 2 / 5
Open interest data gaps: compare a consistent venue panel
An aggregate can rise because a data source appears and fall because it disappears. Reconcile the observed population before calling either movement a change in market-wide positioning.
Athenum8 minUpdated:
Task and assumptions
Build a comparison using the same venues at both endpoints, then explain the difference from a changing-coverage headline. This fictional ledger already uses comparable one-sided base-quantity units for the same underlying and instrument class. It assumes aligned observation times, no overlapping vendor duplicates and no conversion-price changes. Those are prerequisites to check in real data, not properties supplied by the word "aggregate".
Reconcile the disappearance
From t1 to t2 the visible total falls from 400 to 315: a decrease of 85, or 21.25%. On the common A+B panel it falls from 320 to 315: a decrease of five, or 1.5625%. The bridge is -85 = -5 - 80. The -80 term removes C's previously visible observation from the reported total; it does not measure C's change in outstanding contracts.
Even the measured five-unit decrease is not a liquidation count. Closing positions voluntarily can reduce OI. A liquidation-event feed, its side and quantity conventions, coverage and timing would need separate analysis before attributing a cause. Avoid labelling every negative OI bar "liquidations".
Coverage and magnitude are different measures
At t1, A+B account for 320/400 = 80% of the observed quantity. At t0 and t2, there is no comparable all-three total from which to calculate that share. Having data for two of three expected venues is 66.666…% venue-count coverage, not 66.666…% of total market OI. A small venue and a large venue each contribute one to that count. Neither count coverage nor an observed-quantity share reveals the amount missing outside the known universe.
Worked observation ledger
Each missing cell means no valid observation was available for that endpoint. It says nothing about whether the venue had positions. In particular, C's first observation is not evidence that the venue or instrument first launched.
In fixed, comparable quantity units, venues A and B report 100 and 200 at t0, then 110 and 210 at t1. Venue C first appears at t1 with 80; its t0 value is missing, not zero. The visible total rises from 300 to 400, or 33.333…%. The constant A+B panel rises from 300 to 320, or 6.666…%. The remaining 80 is newly observed coverage, not demonstrated new positions. Neither number estimates the missing t0 market-wide total without further information.
At a later time, losing C from the feed must produce missing coverage rather than an automatic 80-unit liquidation. The reconciliation makes that distinction explicit; real implementations still need timestamp and unit checks before aggregation.
| Venue | t0 | t1 | t2 |
|---|---|---|---|
| A | 100 | 110 | 108 |
| B | 200 | 210 | 207 |
| C | missing | 80 | missing |
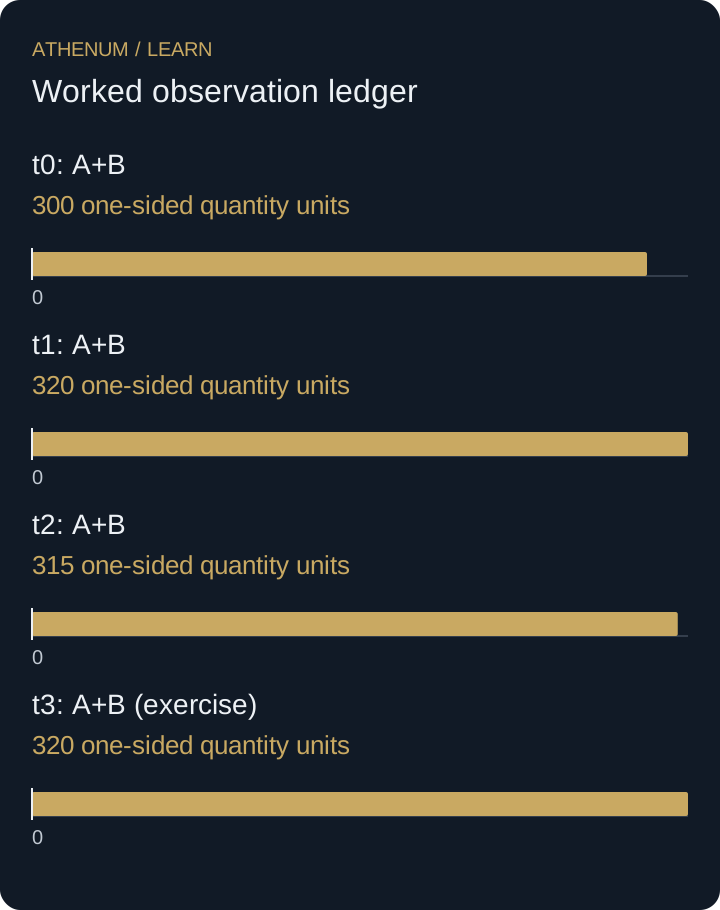 Open full-size diagram
- t0: A+B: 300 one-sided quantity units
- t1: A+B: 320 one-sided quantity units
- t2: A+B: 315 one-sided quantity units
- t3: A+B (exercise): 320 one-sided quantity units
Three tempting repairs that answer different questions
Filling C with zero invents an observation. Carrying C's 80 forward gives 395 at t2 and a 1.25% decline from 400, but that result includes a stale value. It may be displayed only as an explicitly stale estimate with its age; it is not a synchronized three-venue measurement. Interpolating a missing value using a future return of the feed would also use information unavailable at t2. A retrospective estimate must not quietly become a real-time signal.
The constant panel is not automatically the whole-market truth either. A+B may behave differently from C, and excluding unstable venues can select a nonrepresentative sample. Report the panel membership and what it excludes. If membership changes again later, retain a fixed panel for the requested window or explicitly label a chained series; do not disguise shifting pairs as a single constant population.
Before acting
- Fix units, instrument scope and observation times before summing.
- Show which venues are included at both endpoints.
- Distinguish missing data, zero observations and stale estimates.
- Report coverage changes separately from within-panel changes.
- Do not equate an OI decrease with liquidations.
Check your understanding
At t3, A reports 111, B reports 209 and C returns with 90. Compare t2 to t3 using the common panel and the visible totals. Is C's increase from 80 at t1 to 90 at t3 an increase of ten during t2-to-t3?
Show the explained answer
A+B rise from 315 to 320, or 5/315 = 1.587301…%. Visible totals rise from 315 to 410, or 95/315 = 30.158730…%. The observed-total bridge is 95 = 5 + 90, where 90 is newly restored coverage. C rose ten between its t1 and t3 observations, but the missing t2 value prevents allocating that ten specifically to the last interval. If C had 100 at t2, it fell ten; if it had 70, it rose twenty. Both are compatible with the recorded endpoints.