Table of Contents6 sections
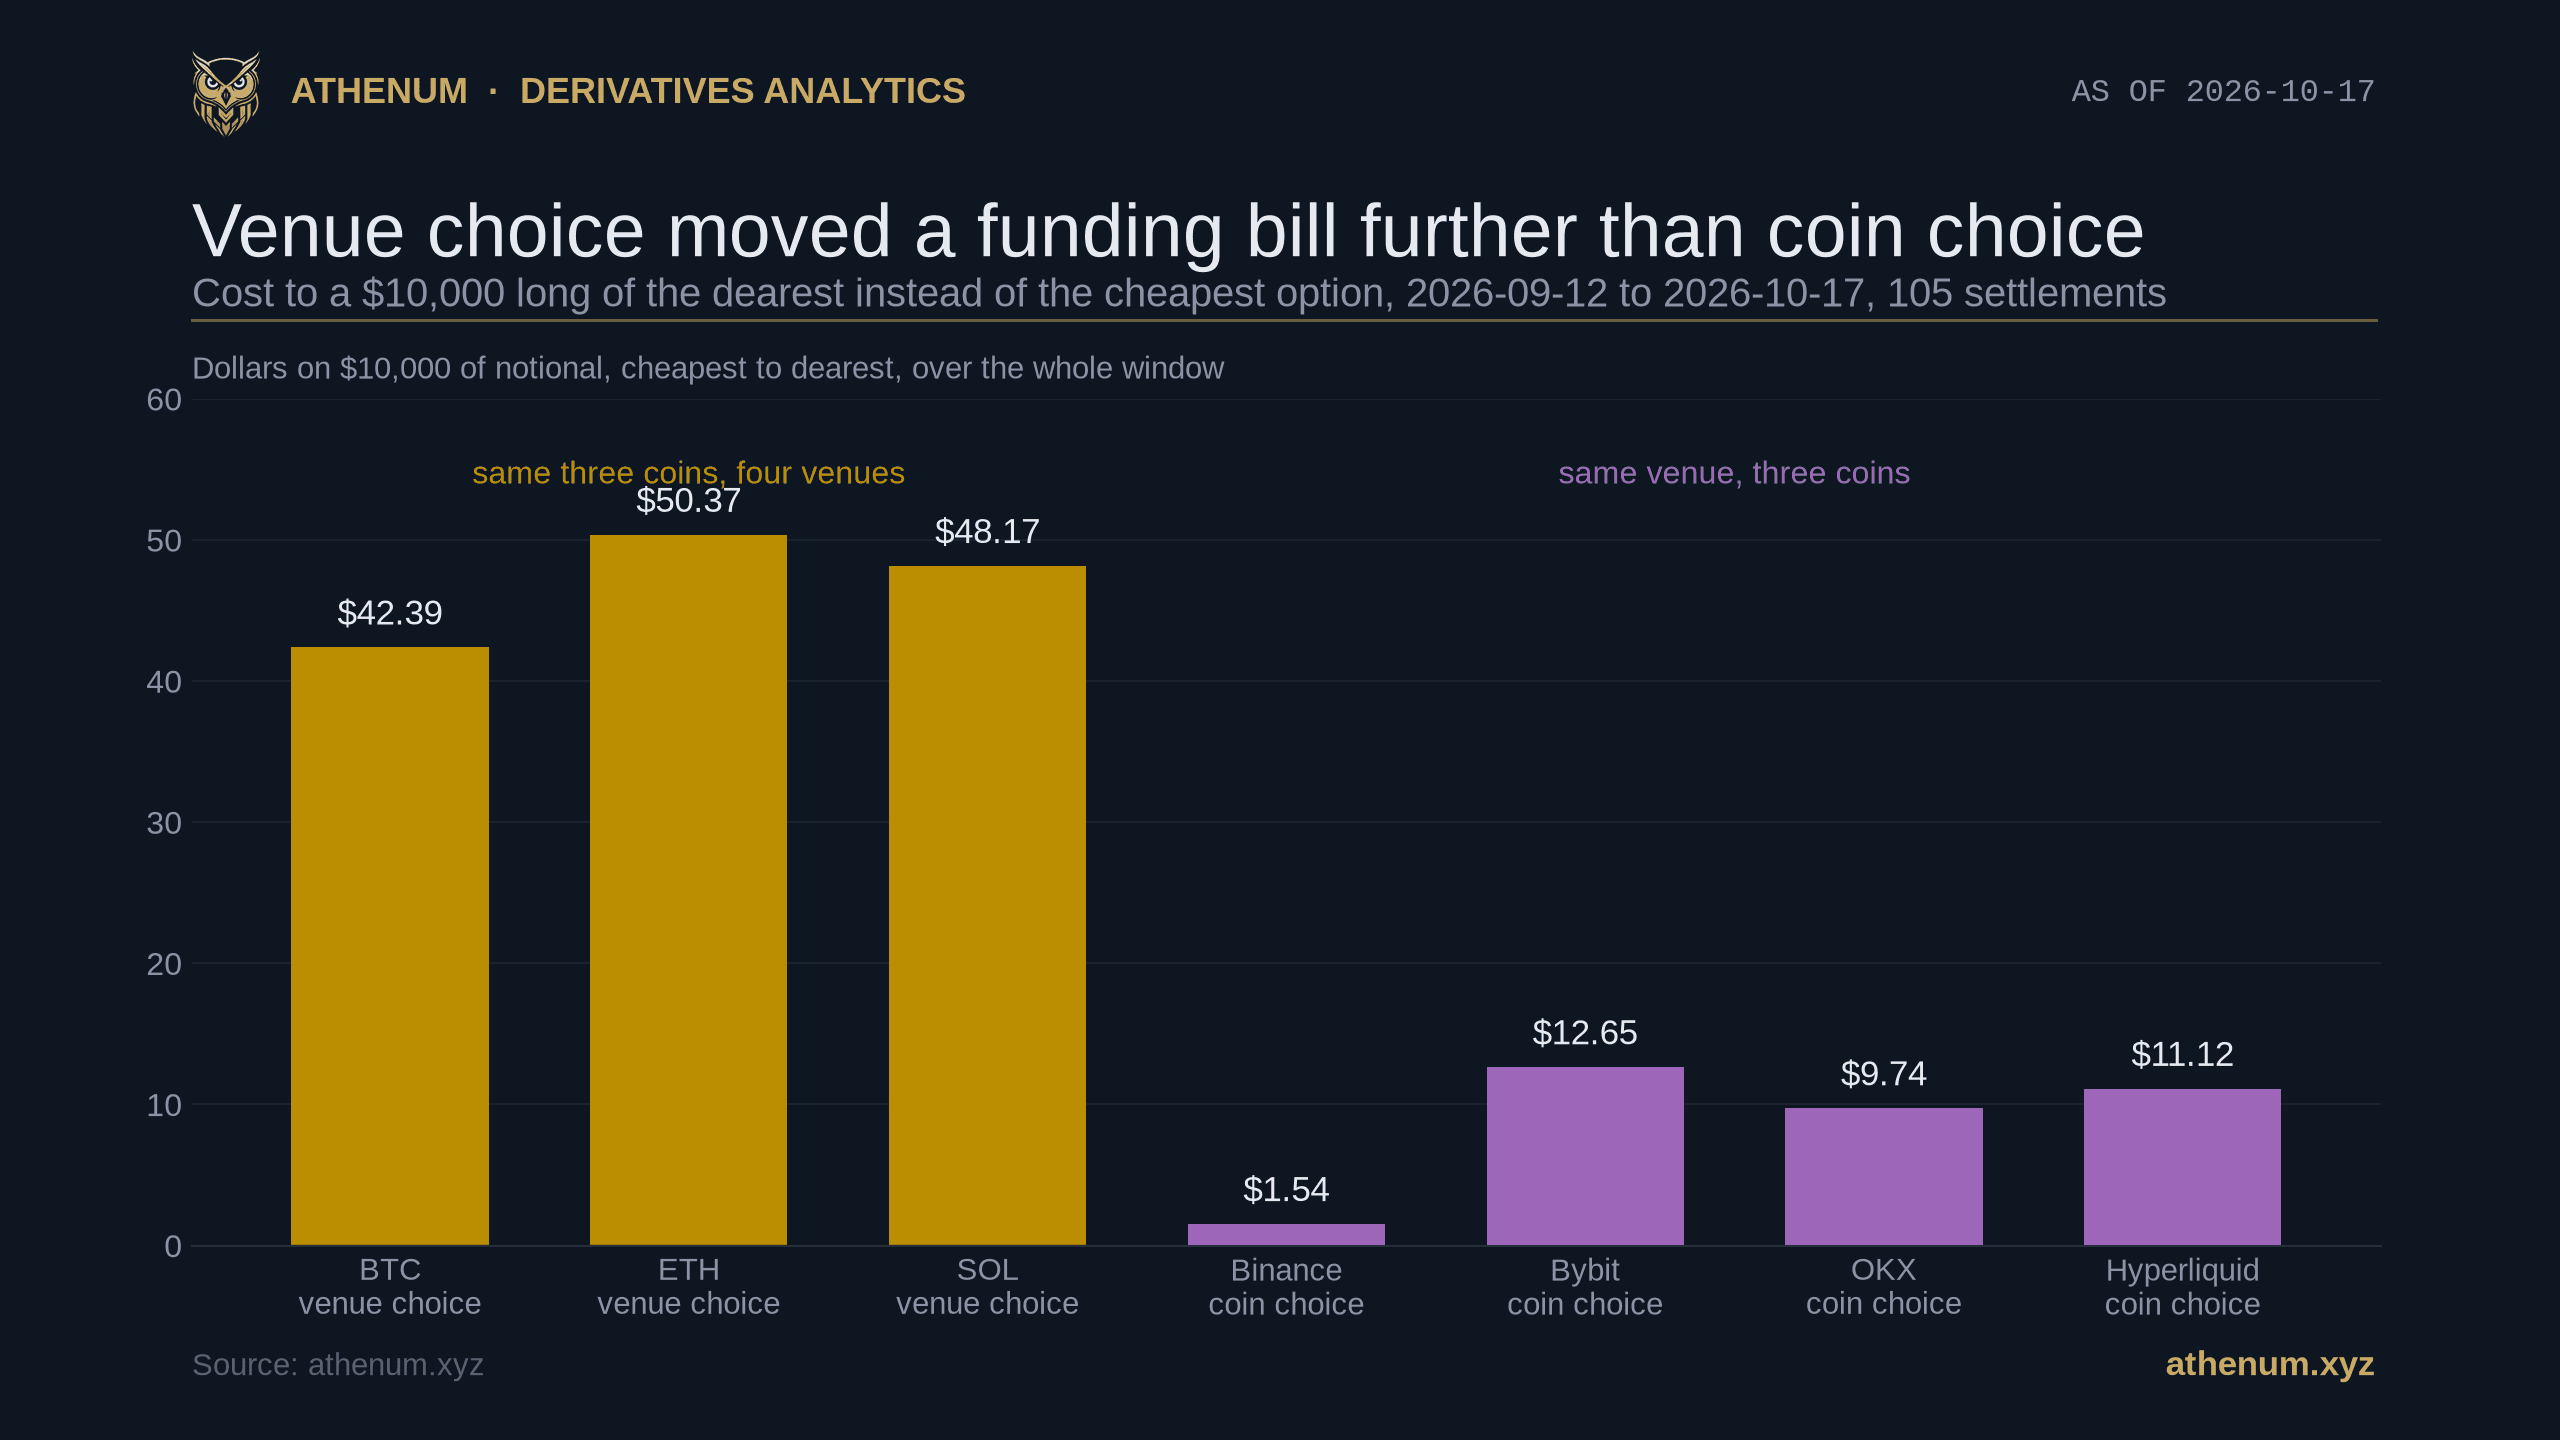
TLDR. Funding is almost always quoted as a property of the coin. Bitcoin funding, Ether funding, Solana funding. Measured on 2026-10-17 over the 105 eight hourly settlements from 2026-09-12 08:00 UTC to 2026-10-17 00:00 UTC on Binance, Bybit, OKX and Hyperliquid, the other label is the bigger one. A 10,000 dollar long that held Bitcoin for the whole window paid 39.03 dollars on the cheapest of the four venues and 81.42 on the dearest, a spread of 42.39 dollars. The same long switching coin instead of venue, staying on Binance, saw its bill move 1.54 dollars between Bitcoin, Ether and Solana; on Bybit 12.65, on OKX 9.74, on Hyperliquid 11.12, a median of 10.43 across the four. The smallest venue spread is 3.4 times the largest coin spread. Per settlement the ordering holds but far more weakly: the venue term accounts for a median 43.3 per cent of each settlement's variation across the three coins and four venues, the coin term 26.0 per cent, and the coin term is the larger of the two on 43 of the 105 settlements. That is a tendency, not a law. Between three quarters and ninety five per cent of the venue effect disappears when Hyperliquid, the one decentralized venue here, is dropped, so the honest label is centralized against decentralized rather than venue in general. Two further limits belong up here: the three coins measured are the three most heavily arbitraged perpetuals in the market, which compresses the coin term, and this is one 35 day window. On the live board on 2026-10-17 at 04:13 UTC the four venues quoted 26 coins, and the gap between the dearest and the cheapest ran a median 11.11 annualized points, with the four disagreeing about the sign of funding on 15 of those 26.
Is a funding rate a property of the coin or of the exchange?
Of both, and the exchange term is the one almost nobody prices. A perpetual future never expires, so instead of converging to a settlement it pays a periodic cash transfer between longs and shorts, sized by how far the contract trades from its index. The mechanics are in Athenum's explainer on how funding rates are calculated. The important part here is that every term in that formula is venue local. The premium index is built from the venue's own book, the interest rate component is the venue's parameter, the clamp is the venue's rule, and the settlement clock is the venue's schedule. Two exchanges listing the same coin are quoting two different numbers by construction.
So the question has an arithmetic answer. Take the three coins our cross exchange history covers end to end, Bitcoin, Ether and Solana, and four venues that quoted all three across the window: Binance USDT margined perpetuals, Bybit, OKX, and Hyperliquid, which is a decentralized perpetuals venue running its own order book on its own chain rather than a centralized exchange. Integrate each venue's own published funding over the window, each reading held for the interval it governs, and read the resulting bill two ways. Across venues with the coin held fixed. Across coins with the venue held fixed.
Three details of the method are worth stating rather than hiding. The three centralized venues settle on an eight hour clock, so their bills are the sum of exactly 105 readings each. Hyperliquid settles hourly, so its bill is the sum of its hourly readings inside the same window, each weighted by one hour instead of eight. Its coverage is not quite complete: it published 826 of the 833 in window hours for Bitcoin and Ether, and all 833 for Solana. The Bitcoin and Ether shortfall is a single seven hour run from 2026-09-24 09:00 to 15:00 UTC, and those seven hours are simply left out rather than filled in.
Every annualized figure here is simple interest and not compounded: a rate of 0.01 per cent per eight hours is quoted as 10.95 annualized points, three settlements a day for 365 days. That convention is not universal and the difference is not decorative. Hyperliquid's own documentation annualizes the identical rate as 11.6 per cent, which is the compounded version of the same number. Any cross venue funding comparison that mixes the two conventions is already wrong before it starts.
How much did each choice actually cost?
Here is the whole measurement in one table. The figure is what a long holding 10,000 dollars of notional for the full window paid in funding, in dollars, positive meaning the long paid.
Coin | Binance | Bybit | OKX | Hyperliquid | Venue spread |
|---|---|---|---|---|---|
BTC | 39.03 | 39.21 | 45.24 | 81.42 | 42.39 |
ETH | 38.03 | 35.47 | 35.50 | 85.84 | 50.37 |
SOL | 37.49 | 26.56 | 38.42 | 74.73 | 48.17 |
Coin spread | 1.54 | 12.65 | 9.74 | 11.12 |
Read along a row and the venue is worth 42.39 to 50.37 dollars. Read down a column and the coin is worth 1.54 to 12.65. The bottom right corner of that table is the finding: the largest coin spread, 12.65 dollars on Bybit, is smaller than the smallest venue spread, 42.39 on Bitcoin. The ratio of those two, 3.4, is the most conservative way to state the result; comparing medians instead gives 4.6, and the single most flattering pair gives 33.
It is also a number a trader can act on without changing a single view about the market. Picking a venue is a decision made once, usually on fee schedule, liquidity and custody. The funding differential above is a recurring cost attached to that decision. If you want to run the arithmetic on your own size and holding period, the free funding rate calculator does exactly this sum, and the profit and loss calculator is where the result lands on the position.
Does one venue carry the effect?
Mostly, and this is where the headline has to be walked back to what the data supports. Compute the same venue spread over the three centralized venues alone and it collapses: 6.21 dollars on Bitcoin, 2.56 on Ether, 11.86 on Solana. That is 85.3 per cent of the Bitcoin spread gone, 94.9 per cent of the Ether spread and 75.4 per cent of the Solana spread, so between three quarters and ninety five per cent of the gold bar in the chart above is Hyperliquid. The quarter that survives on Solana is not nothing: 11.86 dollars is larger than three of the four coin spreads.

The qualification that makes the headline honest. Across the three centralized venues the two dimensions are the same size; most of the four venue number is one venue's behaviour, and on Solana a quarter of it is not.
The mechanism is visible in a single count. Of the 2,485 hourly readings Hyperliquid published across the three coins inside this window, 1,591, or 64.0 per cent, landed on exactly 10.95 annualized points. That number is not a coincidence and not a cap: all four venues clamp the gap between their interest rate and their premium index to plus or minus 0.05 per cent, so whenever the premium sits inside that band the rate settles on the bare interest component, 0.01 per cent per eight hours. Athenum measured the same anchor from the other direction in the post on how often the funding rate cap binds, where it sits a factor of 30 below the published ceiling. Binance landed on that exact value in 41 of its 315 readings, Bybit in 46 and OKX in 38, so between 12.1 and 14.6 per cent of the time.
Call it an anchor rather than a floor, because in this window it was a ceiling. On every one of the nine centralized venue series, 10.95 annualized points was the highest value printed, while the lows ran to minus 19.39 on Bybit's Solana contract. Hyperliquid is the only one of the four that spent time above it, reaching 78.64 points on Bitcoin. That is where most of the 42 dollars comes from, though not all of it: the three centralized venues are not interchangeable either, and their own bills differ by up to 11.86 dollars on Solana.
Three things this does not say. It does not say Hyperliquid is expensive in general, because a venue anchored at a positive rate is cheap for a short and dear for a long, and this measurement is written from the long side only. The 64.0 per cent also overstates what a position actually feels, because it counts hourly prints rather than held time: of the complete eight hour windows in this sample, 103 for Bitcoin and Ether and 104 for Solana, all eight hourly readings sat on the anchor in 33.0 per cent of them for Bitcoin, 54.4 per cent for Ether and 33.7 per cent for Solana. And part of the gap is a measurement difference rather than an economic one, because Hyperliquid prices its premium against an oracle built from a weighted median of spot prices on several venues including its own, while each centralized venue prices its premium against its own index, so the two are not measuring distance from the same reference.
How stable is the ordering from one settlement to the next?
Much less stable than the 35 day total suggests, and saying so is the point of the next chart. Take each of the 105 settlements, lay the three coins against the four venues as a grid of twelve readings, and split that settlement's total variation into the part explained by which venue it is, the part explained by which coin it is, and the part that is the interaction of the two. This is deliberately done inside each settlement rather than over the pooled sample, which holds the common time factor out: pooled across the window, when funding is high it is high nearly everywhere at once, and that shared movement would otherwise swamp both terms.

The spread behind the headline. The venue term is the bigger one on 62 of 105 settlements, the coin term on 43, and the boxes overlap heavily. A 62 to 43 split is a tendency, not a rule you can lean on at any single settlement.
The venue term takes a median 43.3 per cent of the variation, the coin term 26.0 and the interaction 23.0. But the interquartile ranges, 23.1 to 64.0 for venue against 11.0 to 41.3 for coin, overlap across most of their length, and on 43 of the 105 settlements the coin term is the larger one. A reader who takes away "venue beats coin" and applies it to the next settlement will be wrong about four times in ten.
The interaction term is the one worth keeping. At a median 23.0 per cent it says roughly a quarter of what happens at a given settlement is neither a venue effect nor a coin effect but a specific venue being unusual about a specific coin. That is the part no single number summarizes, and it is the reason a cross exchange view is read as a grid rather than as one aggregate line.
Two pieces of prior art sit directly under this result and it would be dishonest to present it without them. A 2026 study in Mathematics covering centralized and decentralized venues over 749 symbols describes exactly this two tiered structure, centralized venues tightly integrated with each other and decentralized ones priced apart, and Coin Metrics measured Hyperliquid's Bitcoin funding as roughly twice as volatile as Binance's. Closer to home, Athenum's own measurement of what the quote currency does to a Bitcoin perpetual's funding is the same rhetorical move on a different axis, and found that swapping the collateral moves the rate about as much as swapping the exchange. What is added here is the coin dimension in dollars on a fixed notional, and the per settlement decomposition that shows how often the ordering reverses.
What does the cross venue gap look like right now?
Wide, and the width has more to do with the anchor than with liquidity. On 2026-10-17 at 04:13 UTC the four venues all quoted 26 of the coins on our board. The gap between the dearest and the cheapest ran a median 11.11 annualized points, with an interquartile range of 7.60 to 17.29 points.

The live cross section at one instant. Red marks the coins where the four venues do not even agree on the sign of funding, 15 of the 26. Bitcoin is among the tightest at 4.04 points, which is the opposite of where most commentary looks.
Three readings from that instant. Bitcoin was among the tightest coins on the board at 4.04 points, with Binance, OKX and Hyperliquid all sitting on the 10.95 anchor and Bybit at 6.91. Arbitrum was the widest at 46.42 points, Hyperliquid at plus 10.95 against Bybit at minus 35.47, which means a long paid on one venue and was paid on the other at the same moment. And on 15 of the 26 coins the four venues disagreed about the sign, not just the size.
That sign disagreement is not new ground either. Athenum found the same thing along the time axis in the post on negative funding across exchanges, where two or more venues disagreed about the direction at 47 of 128 settlements on a single coin. What this cross section adds is the coin axis: at one instant, the disagreement is the normal case across most of the board rather than an occasional event on one contract.
The tempting explanation for the ordering is depth, and this board does not support it. Four of the six deepest perpetuals on it sit above the median gap, with Ether at 14.99 points and BNB at 15.58, while the two tightest coins of all are TRX and SUI at exactly zero. The thing the tight coins share is not a deep book but the anchor: TRX and SUI have all four venues sitting on 10.95, and Bitcoin has three of four. Dispersion collapses where everyone's premium is small enough for the clamp to bind, and opens up where even one venue's premium escapes it.
What should a reader do with this?
Four things, in the order the measurement supports them.
1. Price the venue decision as a recurring funding cost, not only as a fee schedule. Over this window it was worth 42.39 to 50.37 dollars per 10,000 dollars of notional, against 1.54 to 12.65 for the coin decision. 2. Do not generalize from the four venue number. Across Binance, Bybit and OKX the venue effect was 2.56 to 11.86 dollars, the same size as the coin effect. Most of the gap is one decentralized venue's anchoring behaviour, measured here over one 35 day window. 3. Do not apply the ordering to a single settlement. The coin term was the larger one on 43 of 105 settlements, and the two interquartile ranges overlap heavily. 4. Read funding as a grid. About a quarter of each settlement's variation was the interaction of venue and coin, which no per coin average and no per venue average can show.
One limitation sits under all four and is worth repeating at the end. Bitcoin, Ether and Solana are the three most heavily arbitraged perpetuals in the market, which is precisely the condition that compresses the coin term, so a three coin panel is a conservative test of the coin dimension and not a neutral one. The 26 coin cross section above is the partial answer: widen the board and the dispersion grows, with Arbitrum at 46.42 annualized points against Bitcoin's 4.04 on the same instant.
Two public readings sit behind every figure here, a cross exchange funding history and one live cross section, both taken on 2026-10-17, and anyone holding the same two can rebuild the table. The grid itself is what Athenum does: funding from Binance, Bybit, OKX, Hyperliquid and the rest of the venues it covers, normalized into one view, with every calculator beside it free, no account, no email, no usage limits. Open the terminal if you would rather watch the cross venue funding grid move than read a snapshot of it.
One terminal. All the data.
Liquidations, orderbook depth, whale walls & open interest from 4 exchanges, all real-time, in one place.
No credit card required

Athenum Analytics
Athenum Analytics is our three-person editorial team covering crypto derivatives, market data and macroeconomic context.