Table of Contents7 sections
- What does Hyperliquid's perpsAtOpenInterestCap endpoint return?
- Why are seven of the eight named perps delisted?
- What does the one live capped perp look like?
- Does being at the cap mean the market is large?
- How does a data pipeline get this wrong?
- Why does Hyperliquid's open interest matter for a cross-venue view?
- How do you check this yourself?
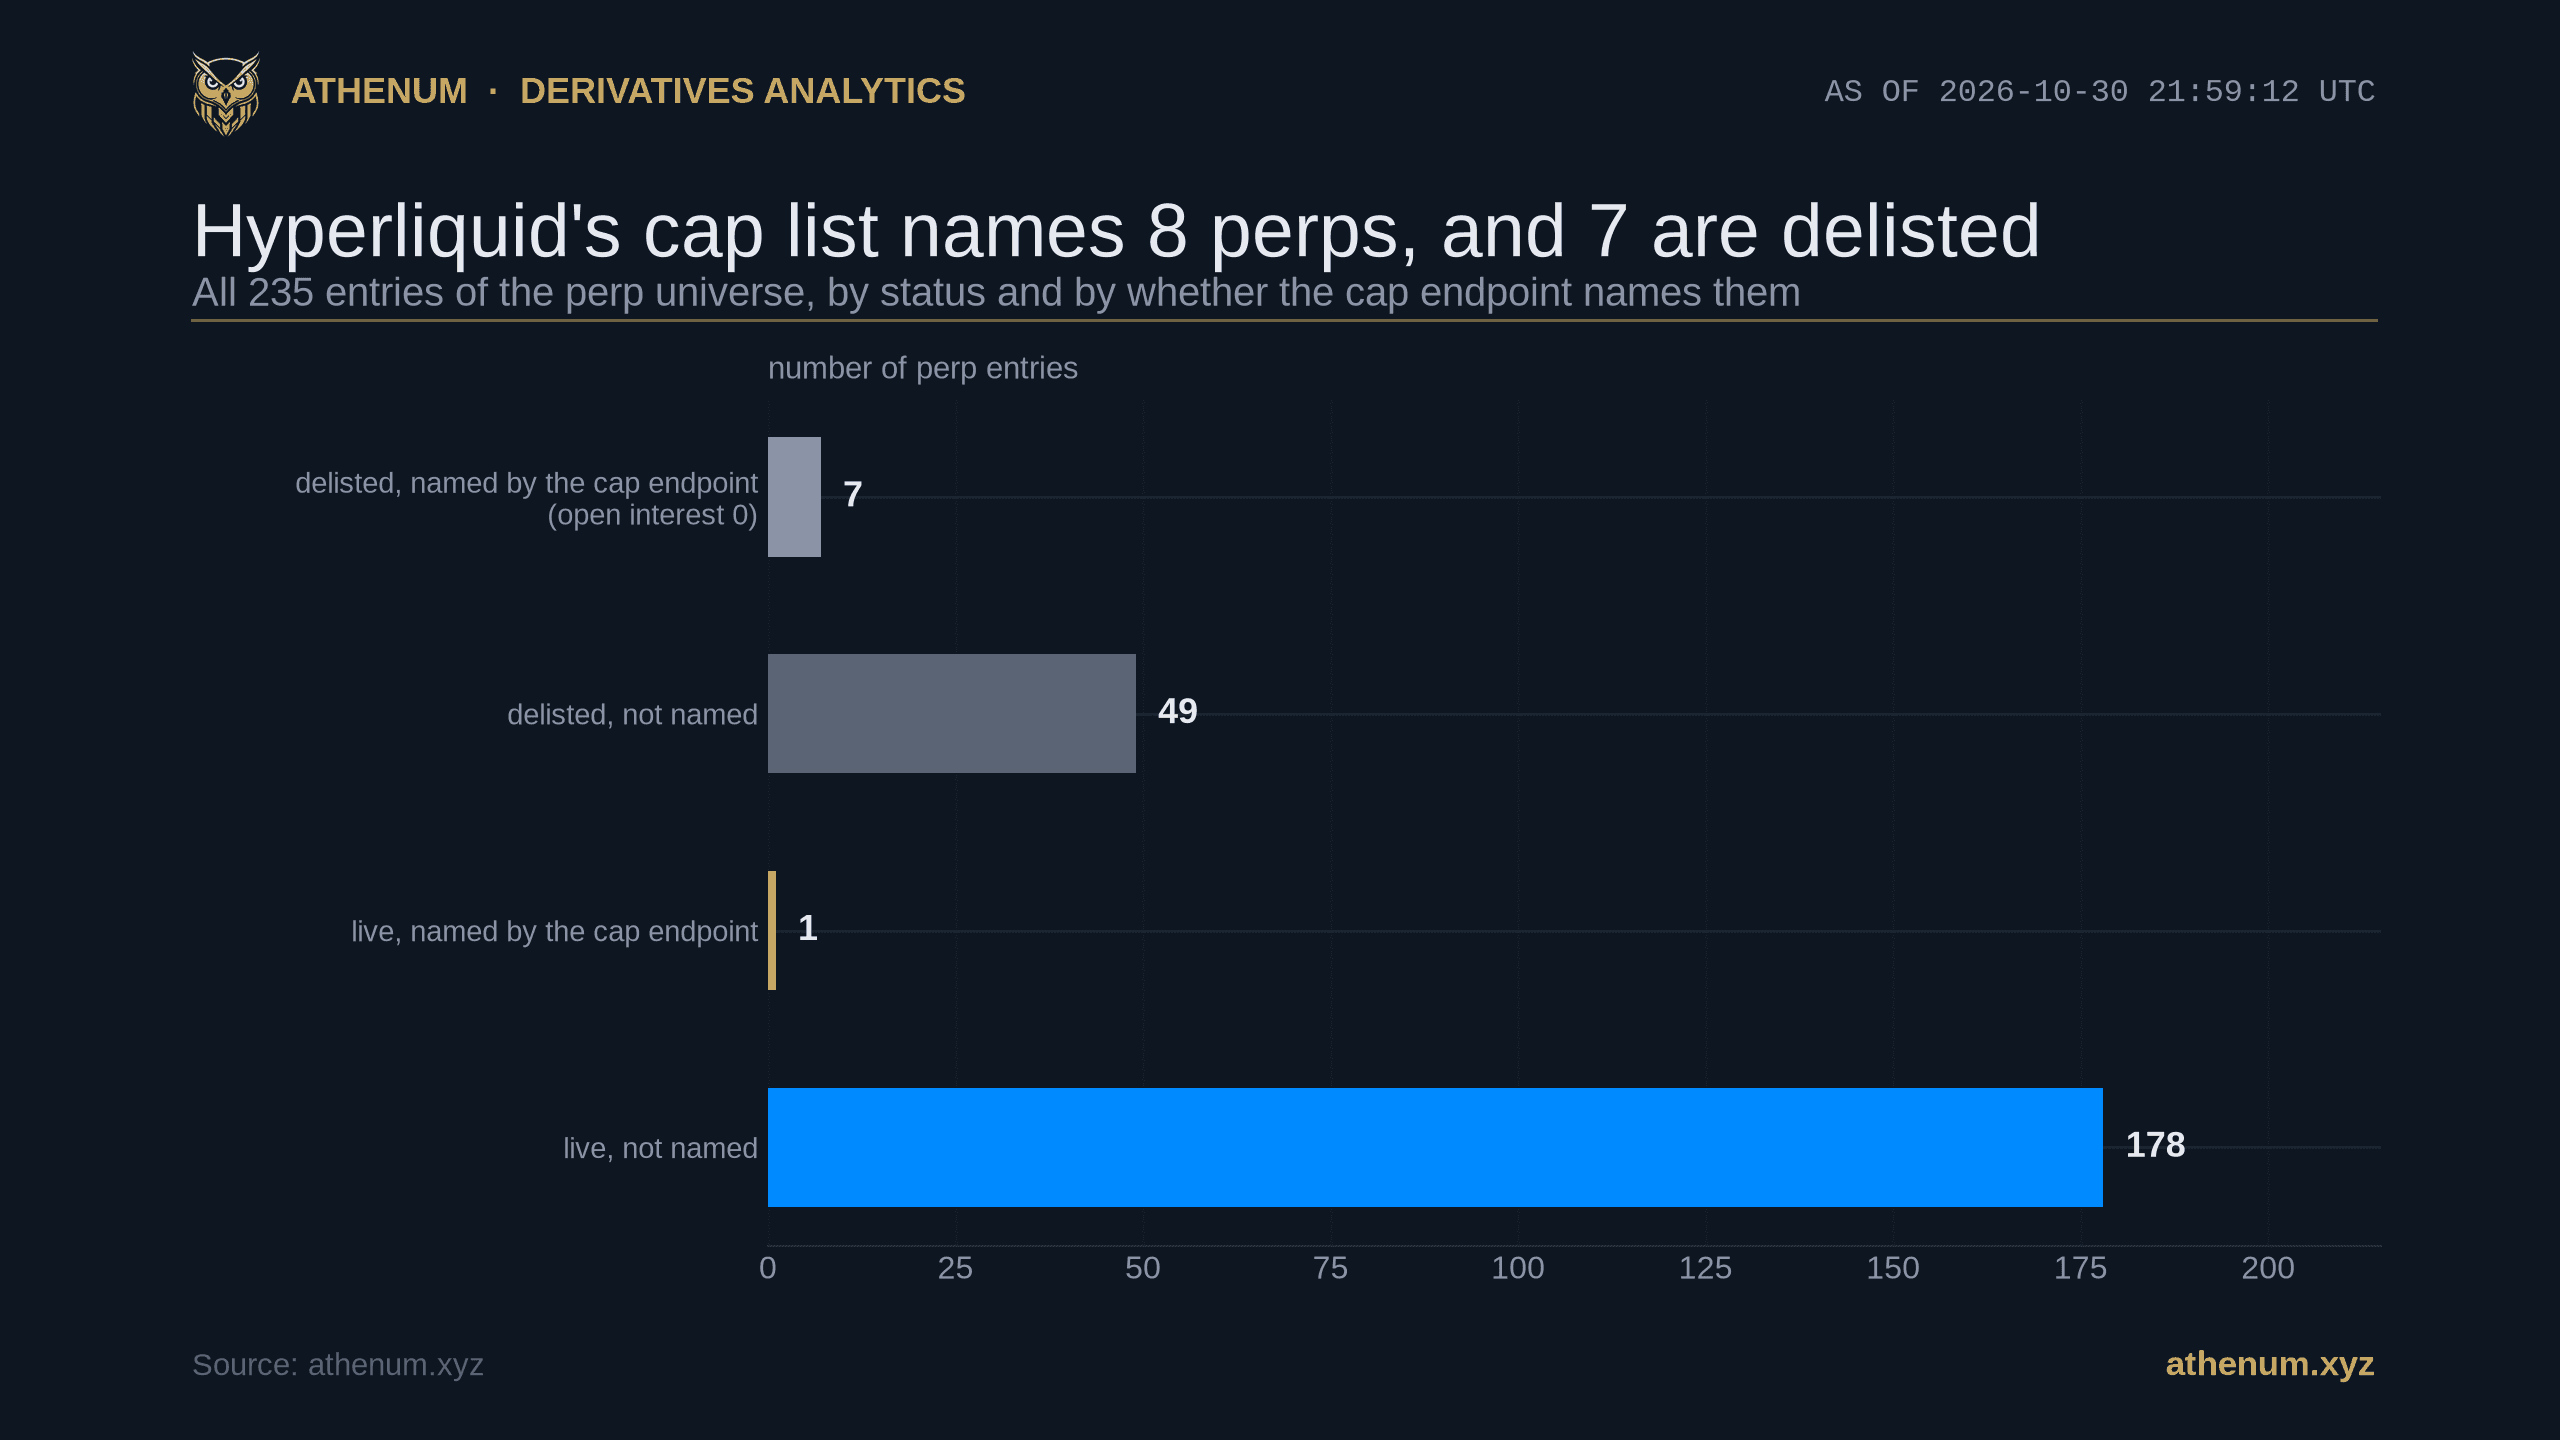
TLDR. Hyperliquid publishes a keyless endpoint, perpsAtOpenInterestCap, that lists the perpetuals which have hit their open interest cap, and a pipeline that counts its answer will be wrong. Read on 2026-10-30 at 21:59:12 UTC it returned 8 names: CANTO, FTM, JELLY, LOOM, RLB, SOPH, VINE and ZEREBRO. Seven of the eight are delisted in the same venue's own instrument list and carry zero open interest, so they are not capping anything anyone can trade. Exactly one is a live market: SOPH, whose open interest read 213,747,536 coins on each of four reads spread over 76 seconds while its mark price moved from 0.002134 to 0.002159. That is about 456 thousand dollars at the first mark, below the median of 2.11 million dollars across the 179 live perps, so being at the cap says nothing about being large. The count that matters on 2026-10-30 is one, not eight.
What does Hyperliquid's perpsAtOpenInterestCap endpoint return?
A flat array of coin names and nothing else. The request is one line, {"type": "perpsAtOpenInterestCap"} posted to https://api.hyperliquid.xyz/info, with no key and no account, and the answer carries no cap value, no current open interest and no timestamp. Hyperliquid's own documentation describes it as a query for perps at open interest caps and shows an example response of five names.
What a cap does is documented in the error responses page: while an asset sits at its cap, an order that would increase open interest is rejected with "Order would increase open interest while open interest is capped", and a separate message covers orders priced more aggressively than the oracle while at the cap. Read together with the list, that implies something concrete for a live market: new exposure in that coin is blocked until open interest falls back under the limit.
The size of the limit is the part the endpoint does not give you. For builder-deployed markets the documentation states caps in dollars and in size, and Hyperliquid exposes them through a separate limits call. We found no published figure for the native perps on this list, so every cap level in this post would be a guess and none is offered.
Why are seven of the eight named perps delisted?
We can measure the overlap and we cannot explain the selection. On 2026-10-30 Hyperliquid's instrument list carried 235 perp entries, of which 56 were flagged isDelisted and 179 were live. All 56 delisted entries had open interest of exactly zero, and 7 of them were on the cap list. That leaves 49 delisted entries that the endpoint does not name, so delisting alone is not what puts a name on the list.
The seven are not new. Our notes from 2026-10-07 at about 14:2x UTC record the same endpoint returning the same seven names, CANTO, FTM, JELLY, LOOM, RLB, VINE and ZEREBRO, and the instrument list we saved at 14:11 UTC that day, which we still hold, already flagged all seven as delisted. We did not archive the raw cap response that day, so the earlier list rests on our notes. On that evidence they were retired entries then and were still named 23 days later. The official example response in the documentation also carries three of them (CANTO, FTM and LOOM), and its metadata example shows LOOM with isDelisted set to true, so this overlap is visible in the vendor's own page.
A plausible reading is that delisting sets a cap of zero for some entries, so open interest of zero is trivially at the limit. That is an inference from the pattern, not something we found stated, and it would not explain why the other 49 delisted entries are absent. Treat it as a hypothesis, not a finding.
What does the one live capped perp look like?
SOPH is a 3x maximum leverage perp on Hyperliquid with 213,747,536 coins of open interest on 2026-10-30. We read it four times between 21:59:15 and 22:00:31 UTC, a span of 76 seconds, and the open interest figure was identical to the coin on all four reads while the mark price moved from 0.002134 to a high of 0.002159 and ended at 0.002157, while the market kept trading.

SOPH open interest (gold, left axis, 213,747,536 coins on all four reads) against its mark price (blue, right axis, 0.002134 to 0.002159), 2026-10-30. The left axis is truncated to make the flat line readable, and the price move across the window is only about 1 percent. A market still trading and still repricing but with no change in open interest to the coin is what a pinned limit looks like. Four reads over 76 seconds is a short window, so this supports the cap reading for this minute and not for the day. A fifth read at 22:11:08 UTC still showed 213,747,536 coins with the mark at 0.00217.
That is consistent with a live cap and it is the reading we would act on, with the limit stated plainly: four reads over 76 seconds cannot show how long the pin lasts, how often it releases, or what the limit is. It is one live example on one date, 2026-10-30, an existence proof and not a frequency, and nothing here supports a rate at which live Hyperliquid perps reach their caps.
Does being at the cap mean the market is large?
No, and this is the easiest misreading to make. SOPH's open interest of about 456 thousand dollars at the 21:59:12 UTC mark is larger than that of only 39 of the 179 live perps, about the 22nd percentile, and well below the median of 2.11 million dollars. The middle half of the live board runs from 0.55 million to 9.58 million dollars, so the capped market sits just under the bottom edge of that middle half. Caps appear to differ by market, so a flat dollar threshold would not find it.

Open interest of every live Hyperliquid perp, 2026-10-30 21:59:12 UTC, log scale because the board spans nearly five orders of magnitude from about 50 thousand dollars to over 3 billion dollars. The gold diamond is SOPH at its cap: 39 live perps are smaller than it. The dashed line is the median of 2.11 million dollars and the shaded band is the middle half, 0.55 million to 9.58 million dollars, shown because a single median would hide how wide the board is.
How does a data pipeline get this wrong?
In three quiet ways. The first is counting: len(response) is 8 and the number of tradable capped markets is 1. The second is joining: if you drop the response straight into a universe table keyed by coin, seven retired contracts with no open interest come back as capped, and any dashboard counting how many perps are constrained will overstate it eightfold. The third is scope: the request has a dex parameter, and the documentation says that when it is omitted the first perp dex is used, so builder-deployed markets are not in the default answer.
The fix costs one extra call. Pull the instrument list, drop every entry flagged isDelisted, and intersect what is left with the cap list. On 2026-10-30 that returned a single name. We have written about the same family of mistake from the other direction in Athenum's piece on survivorship bias in a perpetual futures dataset, where retired contracts vanish from the roster, and in the Athenum post on the one Binance contract that carries a delivery date, where a retired-or-retiring contract still carries its normal label.
Why does Hyperliquid's open interest matter for a cross-venue view?
Because it is the third-largest venue in the sum shown. On the 2026-10-30 22:00 UTC bar, read while that hourly bar was still forming, Athenum's normalized view put bitcoin perpetual open interest on Hyperliquid at 3.205 billion dollars, 12.62 percent of the sum across the venues shown, behind Binance at 41.45 percent and OKX at 13.70 and just ahead of Bybit at 11.82, Gate at 8.96, Bitget at 5.85, HTX at 2.81 and Deribit at 2.79.

Shares of summed bitcoin perpetual open interest by venue, Athenum normalized feed, 2026-10-30 22:00 UTC bar. These are shares of the sum of the venues shown, not of the feed's own aggregate field, which ran 0.66 percent above that sum at that read, a gap that moves from bar to bar. Hyperliquid is highlighted at 12.62 percent, third on this bar, which was still forming when read.
We checked that figure against the venue directly. Hyperliquid's own metaAndAssetCtxs read at 21:59:12 UTC showed 41,797.25 BTC of open interest at a mark of 76,688 dollars, which is 3.2053 billion dollars, and the feed's value differs from that by 0.007 percent. The two readings are about a minute apart and the feed bar was still forming, so a re-read an hour later would not agree that closely. What the check shows is that the feed's Hyperliquid column tracks the venue's own figure at the same moment. The caption's note applies here too: where a total and its named parts disagree, the parts are the ones you can check.
How do you check this yourself?
Keyless calls, no account, five steps.
1. Read the cap list: POST https://api.hyperliquid.xyz/info with {"type": "perpsAtOpenInterestCap"}. On 2026-10-30 it returned 8 names.
2. Read the instrument list and contexts: the same URL with {"type": "metaAndAssetCtxs"}. It carried 235 entries, 56 flagged isDelisted.
3. Drop delisted entries and intersect. One name survived on 2026-10-30, SOPH.
4. Read open interest in coins and the mark for each survivor and multiply, because the field is in coins and not dollars. Repeat the read a few times: a figure that does not move while the price does is the signature of a pinned limit.
5. Keep the date with the answer. By our notes the list changed between 2026-10-07 and 2026-10-30 by exactly one live name, so a stored copy goes stale.
If you are sizing a position in a thin market like this one, our free position size calculator turns the risk you are willing to carry into a size, and the liquidation calculator shows where that size gets closed out, which matters more when new exposure in the coin can be blocked at the venue.
Every Hyperliquid figure above came from its public info endpoint on 2026-10-30, so that arithmetic can be redone by hand, and the Hyperliquid documentation is linked where it was used. The cross-venue reading is ours, taken from Athenum's live normalized derivatives feed, and the calculators beside it are free: no account, no email, no usage limits. To see the normalized view yourself, start the free 7 day Pro+ trial at app.athenum.xyz; no card is taken and the trial lapses on its own.
One terminal. All the data.
Liquidations, orderbook depth, whale walls & open interest from 4 exchanges, all real-time, in one place.
No credit card required

Athenum Analytics
Athenum Analytics is our three-person editorial team covering crypto derivatives, market data and macroeconomic context.