Table of Contents7 sections
- How much wider is funding on a new perpetual's first day?
- Is the ratio just an artifact of measuring one day against sixty?
- Is it just thin order books on unloved listings?
- Which new listings go the other way, and why?
- Does the direction of funding change on a new listing, or only the size?
- How to reproduce this, and what it does not prove
- Is this about a new contract or a new asset?
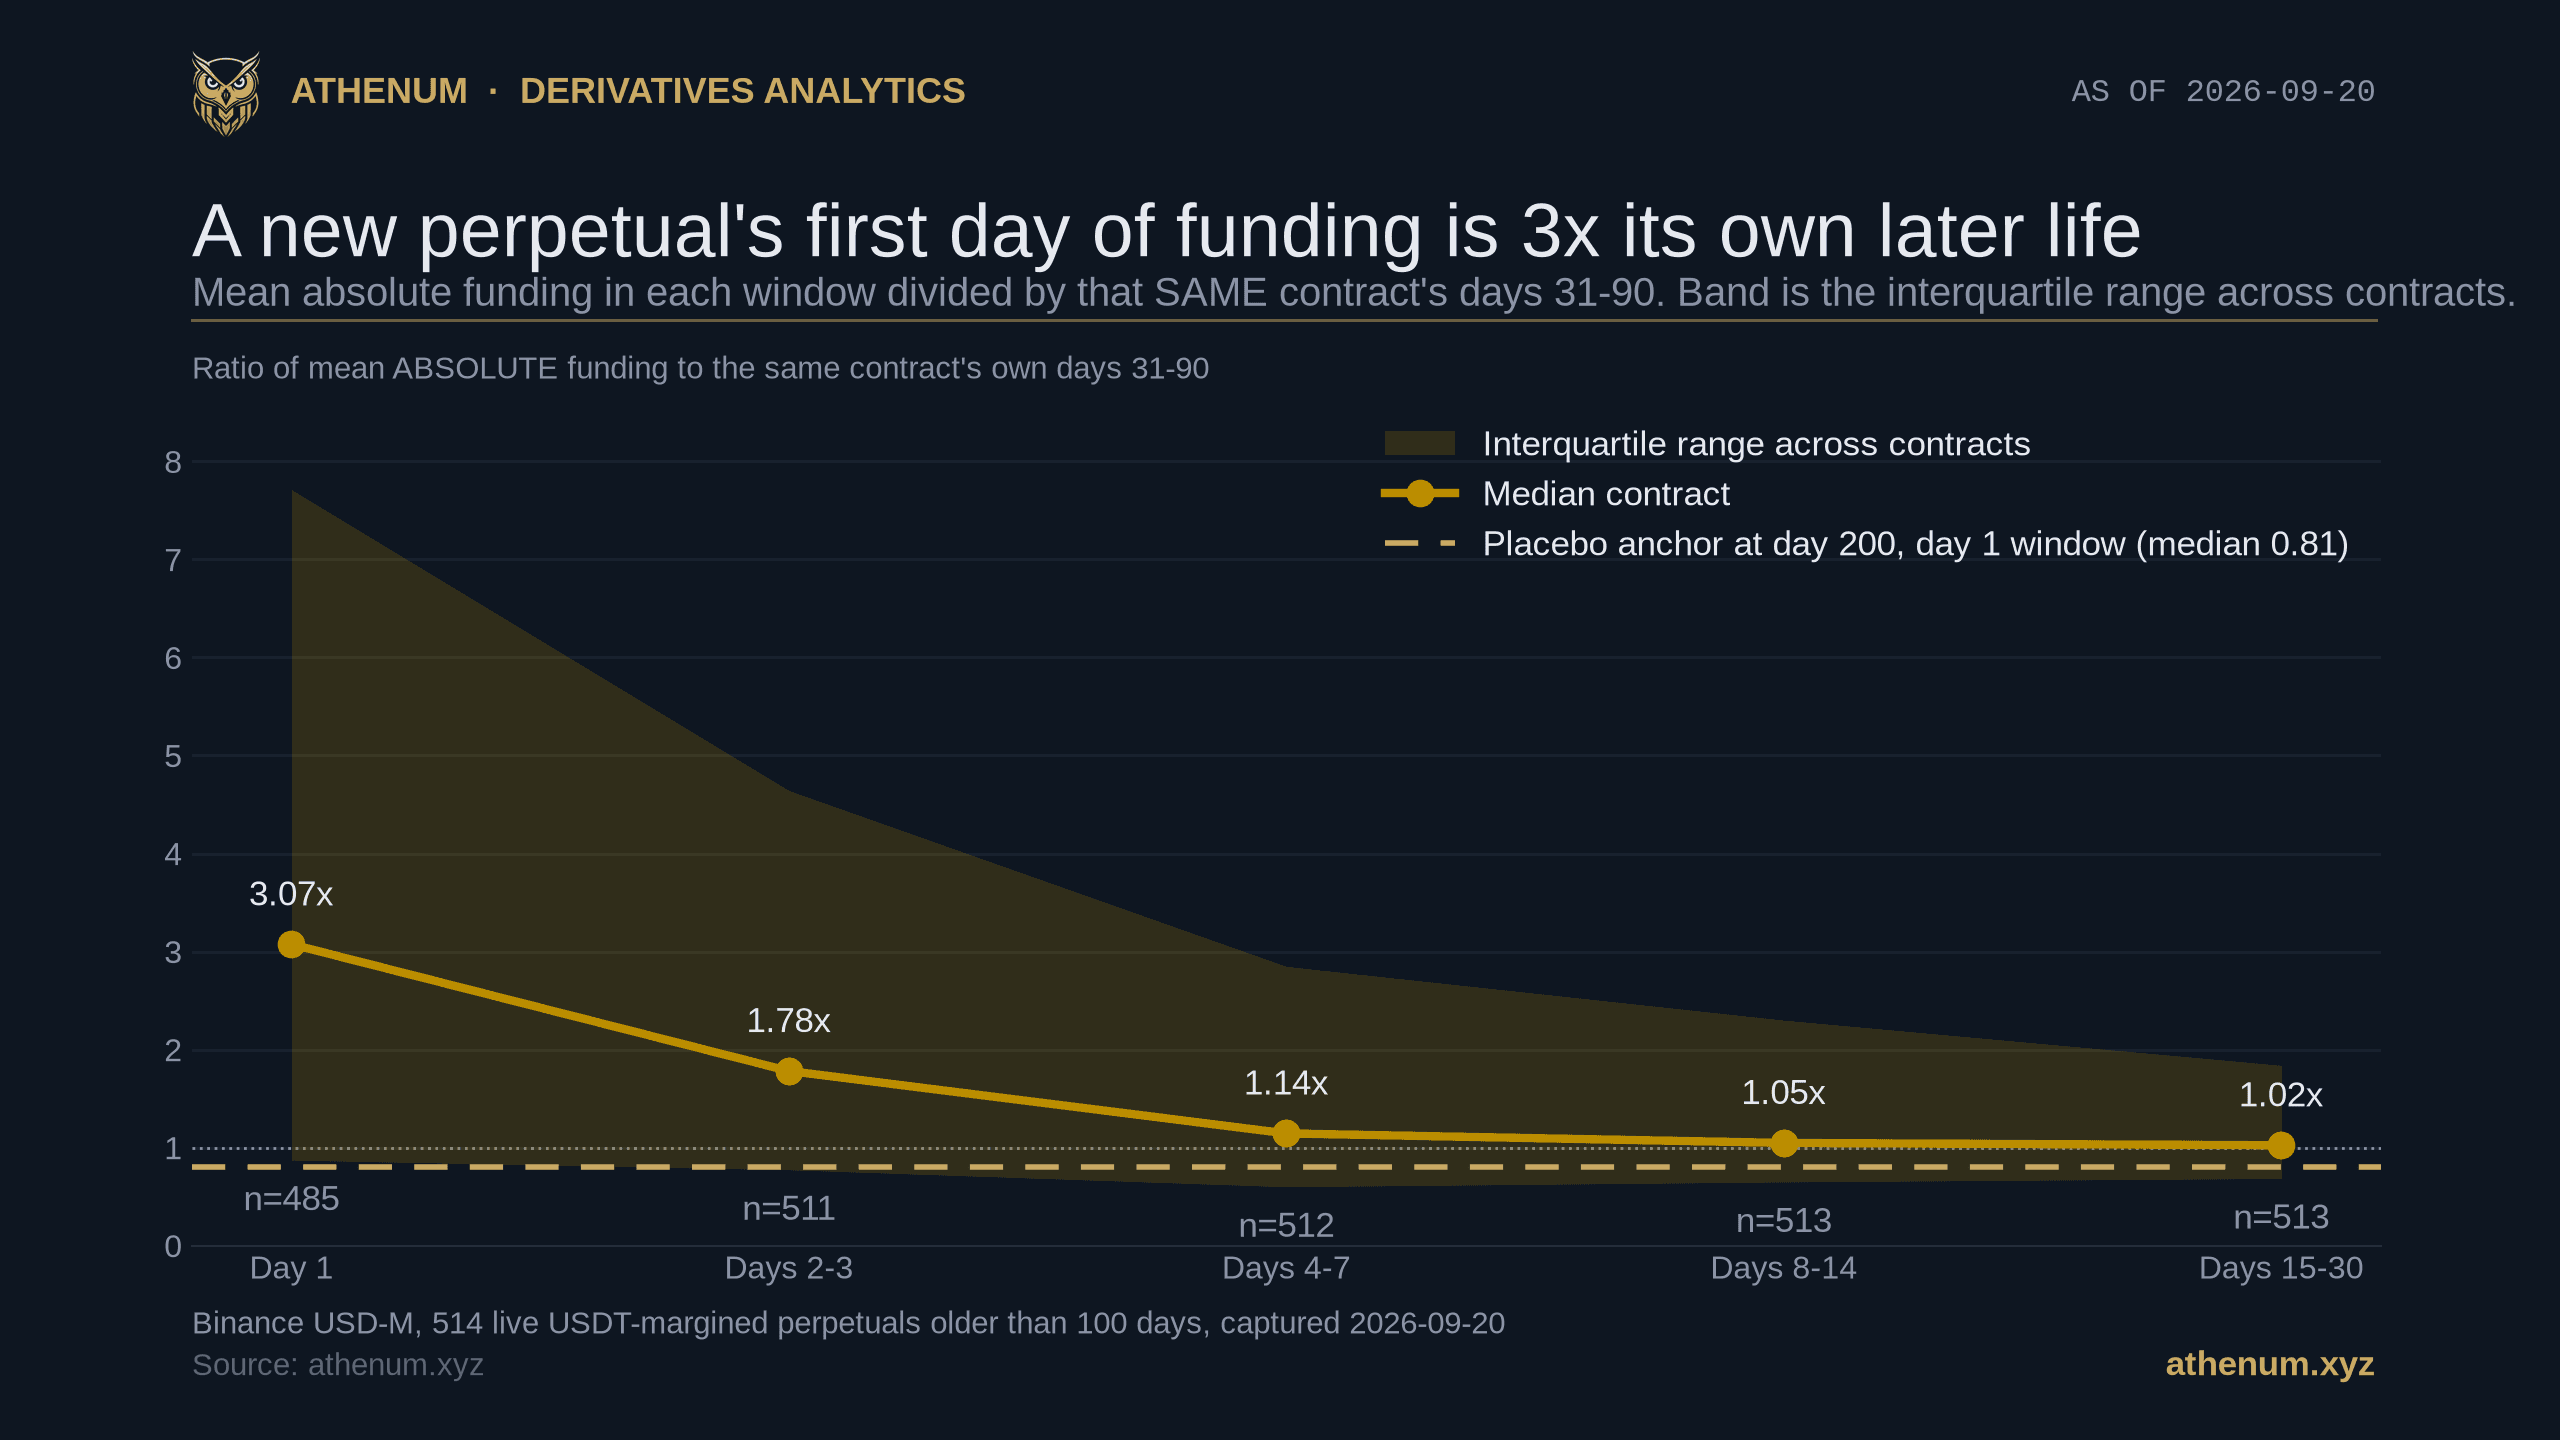
TLDR. New perpetual listings carry their most violent funding in the hours after they list, and the size of that is measurable rather than folkloric. We read all 528 live USDT-margined perpetuals on Binance's USD-M board on 2026-09-20, kept the 514 with enough history, and compared each contract against itself: mean absolute funding in an early window divided by mean absolute funding in that same contract's days 31 to 90. The median contract's day one runs 3.07 times its own later life, days 2 to 3 run 1.78 times, and by days 4 to 7 the ratio is 1.14 and effectively gone. The first week as a block runs 2.11 times, wider than its own baseline on 382 of 512 contracts. Two things stop this from being a story about noise. Running the identical arithmetic off a fake listing date, each contract's day 200, returns 0.81 instead of 3.23 on the same contracts, so the design does not manufacture a number from any anchor. And splitting on how much each contract actually traded in its first week, the busiest half ran at 2.79 and the quietest at 1.62, so this is not thin books on unloved listings: the launches that traded most ran wider, though the two interquartile bands overlap heavily and the separation is modest. What does not change is the balance of direction contract by contract: pair each contract's week one against its own later life and 238 became more negative while 250 became less, which is a coin flip. The size moves; the direction does not tilt.
How much wider is funding on a new perpetual's first day?
About three times its own later life, with a spread wide enough that it is a statement about the population and not a forecast for any one listing. The design is the whole argument here, so it is worth stating before the numbers. Every contract is compared only against itself. We take the mean of the absolute funding rate over a window measured from the venue's own onboard stamp, and divide it by the mean absolute funding rate over that same contract's days 31 to 90. That holds the venue, the tick size, the contract's liquidity tier and its quote asset constant by construction, because the numerator and the denominator come from the same instrument. It does not hold the calendar constant, and it does not undo survivorship, both of which are handled further down.
Window from the onboard stamp | Contracts | Median vs its own days 31-90 | Interquartile range | Wider than its own baseline |
|---|---|---|---|---|
Day 1 | 485 | 3.07x | 0.87 to 7.71 | 339 of 485 |
Days 2-3 | 511 | 1.78x | 0.77 to 4.64 | 332 of 511 |
Days 4-7 | 512 | 1.14x | 0.60 to 2.85 | 290 of 512 |
Days 8-14 | 513 | 1.05x | 0.65 to 2.30 | 276 of 513 |
Days 15-30 | 513 | 1.02x | 0.68 to 1.84 | 267 of 513 |
First 7 days as a block | 512 | 2.11x | 1.00 to 4.36 | 382 of 512 |
Read the interquartile column before the median column. On day one the middle half of contracts ran between 0.87 and 7.71 times their own baseline, and the bottom of that band is below one, which means a substantial minority of new listings were quieter on their first day than they later became. Across the whole set that is 146 of 485 contracts, close to a third. The extremes are further out still, and one of them is a warning about the instrument rather than a fact about the market. The wildest first day in the set belongs to NOTUSDT at 154 times its own baseline: six settlements on day one, every one of them negative, averaging 0.736 per cent each against a later baseline of 0.0048 per cent, on a contract whose settlement clock never changed and whose first trade landed on its stamp to the minute. The calmest reading in the raw set, 0.033, is not a calm launch at all. SENTUSDT printed exactly 0.005 per cent in every one of its first 180 settlements on a 4 hour clock, then moved to an hourly clock at day 31, so that ratio is silently comparing two different settlement intervals rather than two periods of a contract's life. Restrict to the 422 contracts whose clock never changed and whose first trade landed within six hours of their stamp and the calmest first day is 0.058, the median rises to 3.45, and 312 of the 422 are still wider than their own baseline. So the honest reading of 3.07 is that it describes where the middle of a wide distribution sits, and it is worth nothing at all as a prediction about the next contract Binance lists. The days 31 to 90 row is deliberately absent from that table, because it is the denominator and would read 1.00 by construction rather than by measurement.
One number in the table is not ours first. Dating each contract by the onboard timestamp in the instrument list is a method the Athenum census of stock perpetuals and weekend trading already used in August, and that post also named this effect before anyone here measured it, writing that for contracts listed the day before a measurement "a brand new contract finding its level is a competing explanation". The Athenum study of minimum order sizes then left the question open in as many words, reaching for "contract age as the more plausible explanation than size". This post is the size of that thing, not the discovery of it.
Is the ratio just an artifact of measuring one day against sixty?
No, and the test that shows it is the most important chart in this post. The obvious objection is arithmetic rather than economic: a single day holds three funding settlements on an eight hour board, the baseline holds around 180, and a ratio of a tiny sample's mean to a large sample's mean might simply run high on a right-skewed quantity. If that were the mechanism, it would fire from any anchor at all.
So we fired it from a fake one. For every contract with enough history we took its day 200, a date with no listing significance whatsoever, and ran the identical computation: mean absolute funding in the first day after that fake anchor, divided by mean absolute funding in days 31 to 90 after it.

The same arithmetic run off a fake listing date at day 200 returns 0.81 for day one where the real listing date returns 3.23, on the identical 432 contracts. Paired contract by contract, the real window is the wider one on 319 of those 432.
The placebo returns 0.81 on day one and 0.95 on the first week, against 3.23 and 2.11 for the real listing date on the very same contracts. Paired one contract at a time, the real window is wider than the placebo window on 319 of 432 contracts for day one and 329 of 459 for the first week. Two things follow. The design does not manufacture a ratio from an arbitrary anchor, which is what the objection predicted it would do. And the correct reference line for the DAY ONE window is not 1.00 but roughly 0.81, because a single day's mean absolute funding measured against a sixty day mean sits slightly below it in the ordinary case, exactly as a right-skewed quantity should. Measuring against 1.00 understates the day one effect rather than inflating it. That correction does not transfer to the wider windows: the placebo for the first week is 0.95, close enough to 1.00 that the later rows in the table need no adjustment at all, and the single gold line on the chart at the top of this post is the day one placebo rather than a reference for every column.
The placebo also does a second job nobody asks of it. Each contract's day one falls on one calendar date and its days 31 to 90 fall on a different stretch of calendar, and funding is a regime variable, as the Athenum measurement of how often the funding cap binds showed by splitting the same settlements by year and getting a different picture each time. A day 200 anchor sits in a different regime again, and the ratio still collapses to 0.81. The listing year split points the same way in every cohort large enough to report: the median first week ratio is 1.60 for contracts listed in 2020, 1.43 in 2021, 1.59 in 2022, 1.78 in 2023, 2.17 in 2024, 2.38 in 2025 and 1.90 in 2026. Two honest notes on that row of numbers. There is also a 2019 cohort, and it goes the other way at 0.27, but it holds 3 contracts and is reported here only so that the filter is visible rather than silent. And the 2020-to-2025 run does climb, which is a real pattern and is taken up at the end of this post, where it turns out to be the strongest surviving objection to the whole finding.
Is it just thin order books on unloved listings?
That was the strongest objection to this result, and it does not survive a properly timed control. The worry is real: contract age correlates with being a small long-tail contract, and if the effect were really about thin books then this would be a restatement of something already published rather than a finding about listing.

Split on the volume each contract actually traded in its first week, the busiest half ran at 2.80 times its own baseline of mean absolute funding and the quietest at 1.61, which is the opposite ordering to the one a thin-book explanation predicts. The two interquartile bands overlap heavily and the ranking is a weak one: a randomly drawn busy launch beats a randomly drawn quiet one 65 times in 100.
Split the contracts at the median of what they traded across every daily session their first week touched, including the listing session itself, which is 916 million dollars of quote volume, and the busiest half ran at 2.80 times its own baseline while the quietest half ran at 1.61. Counting the listing session matters and is easy to get wrong: it is a median 33 per cent of the week's volume, and a window keyed to sessions that OPEN after the stamp drops it for all but the 11 contracts stamped exactly at midnight, which moves the split point to 774 million dollars. Both cuts give the same answer, 2.80 against 1.61 the honest way and 2.79 against 1.62 the careless way, so the conclusion does not rest on the choice. The gap points the wrong way for a thin-book story: the launches that drew the most volume in week one had the widest funding relative to their own later life, not the narrowest. That ordering is worth stating with its own weakness attached, because the two interquartile bands overlap heavily, 1.27 to 6.08 against 0.77 to 3.31. Drawing one contract at random from each half, the busy one is the wider of the pair 65 times in 100, against the 50 a coin would give. It is enough to refute the thin-book explanation, which predicts the ordering to run the other way, and it is not enough to sort two individual listings. The grey pair on the same chart is the instrument that cannot answer this question, and it is shown on purpose. Splitting the identical contracts on the volume they trade today, years after listing for most of them, gives 2.18 against 1.99 and looks like nothing at all. Today's turnover is not week one's turnover, and using it would have produced a flat result and a wrong conclusion.
Two further controls belong in the open rather than in a footnote. Twenty seven of the contracts changed their funding settlement cadence somewhere between their first week and their days 31 to 90, which makes a per-settlement comparison across that boundary unsound for them; they run at 5.49 and the 485 whose cadence never changed run at 2.00. That exclusion is the one that cuts against the finding, and it should be said in those words rather than buried: dropping the 27 cadence-changers moves the day one median from 3.07 DOWN to 2.91 and the first week from 2.11 down to 2.00. The other two exclusions push the other way. Dropping the 64 contracts that did not trade within six hours of their stamp raises day one to 3.71, and dropping the 42 pinned contracts raises it to 3.75. Apply all three at once and the 391 survivors give a day one median of 3.97 with a middle half from 1.31 to 8.42, against a placebo of 0.81 on that same set. So the result survives every exclusion, and one of the three shrinks it.
Which new listings go the other way, and why?
Forty two of them, and the reason is a published constant rather than anything to do with being new. Those 42 printed two or fewer distinct funding rates across their entire first week, and their median ratio is 0.697: most of them were calmer early than they later became. Not all, and the exception matters more than the headline: ROSEUSDT at 1.147, OPNUSDT at 1.101, EDUUSDT at 1.030 and ACHUSDT at 1.006 still ran wider than their own baseline, with IMXUSDT a hair under at 0.9999, so this is a tendency in a small group and not a rule. Strip the whole group out and the other 470 run at 2.35. The temptation is to call this a new-listing clamp, and it is checkable in one pass, so we checked it instead of guessing. All 42 of them print, as their dominant value, exactly the interest component of the funding formula scaled to their own settlement interval: 0.005 per cent on the 25 that settle every 4 hours and 0.01 per cent on the 17 that settle every 8. That is 42 of 42, with no exceptions and no rounding. The mechanism is in the published formula, and it is worth stating in Binance's CURRENT form rather than the one most explainers still repeat. Binance replaced the old expression on 2025-09-18 with one that divides by the funding interval: the rate is the average premium index plus the interest term clamped to plus or minus 0.05 per cent, all divided by 8 over N, where N is the contract's funding interval in hours, and the result is then capped per symbol. Whenever the premium sits inside the clamp band the two premium terms cancel, so what prints is the interest component divided by 8 over N. That is exactly the pattern above: 0.01 per cent on an 8 hour contract and half of it on a 4 hour one. Do not carry this across venues unchanged. Bybit scales the interest input rather than the bracket, and OKX only moved to this construction in June 2026, so the venues are not interchangeable even where the printed number agrees. These contracts are not being held down by anyone; their premium simply never left the band. One bookkeeping point, because this group and the artifact named earlier overlap: SENTUSDT, whose 0.033 was discarded above as a settlement-interval mismatch, is a member of this 42 and is its minimum. It is the only cadence-changer in the group. Drop it and the remaining 41 have a median of 0.743 rather than 0.697.
The single best illustration of that is the contract that trades the most on this board today. Bitcoin's own perpetual, listed 2019-09-08 and first by 24 hour turnover of all 514 on 2026-09-20, is one of the forty two: across the 17 settlements of its first week it printed ONE distinct value, 0.01 per cent, and its first week came in at 0.778 times its own days 31 to 90. Its launch was not an especially busy one in dollar terms, and that is worth saying rather than hiding: 1.170 billion dollars of quote volume across the sessions of its first week, which ranks 225th of the 514 launches measured here. So it is not evidence that big launches are calm. It is evidence that a contract can be pinned at the anchor for a week and then go on to become the deepest instrument on the board, which is what a pinned-premium story predicts and what a "new contracts are wild" story does not. The Athenum measurement of what a funding stamp actually charges found the same fingerprint on Bitcoin in the present day, where 38 of 270 recent settlements printed exactly that anchor.

Athenum's normalized cross-venue funding series for the 168 hours to 2026-09-20 09:00 UTC: Bitcoin's perpetual, listed in 2019, printed exactly the 0.01 per cent anchor in 37 of 168 hours on OKX, 28 on Binance, 25 on Bybit and 18 on Bitget. Pinning is an ordinary state for an old contract, so it is not a property of being new.
The cleanest way to settle it is to look at the oldest, deepest contract on the board and check whether it does the same thing. Read from Athenum's normalized cross-venue feed for the 168 hours ending 2026-09-20 09:00 UTC, the Bitcoin perpetual printed exactly 0.01 per cent per 8 hours in 37 of those 168 hours on OKX, 28 on Binance, 25 on Bybit and 18 on Bitget, and all four printed it in the same hour 5 times. At the final hour of that window OKX, Binance and Bitget each read exactly 0.010000 per cent while Bybit read 0.003137 per cent. On OKX that is better than a fifth of a quiet week in which a contract listed in 2019 sat pinned to the same constant, so pinning is a market state rather than a listing state, and the forty two calm launches are contracts whose premium simply never moved, not contracts the venue held down. The free Athenum funding rate calculator turns any of these per interval rates into an annualized cost, and the Athenum explainer on why funding intervals are set per symbol covers the boards where the interval is not eight hours at all. If you are sizing into a fresh listing, the practical consequence is that the funding line of your cost model is the one to widen, and the free Athenum position size calculator is where to put the wider number.
Does the direction of funding change on a new listing, or only the size?
There is no systematic tilt, but the distribution is not the same either, and the two statements are easy to confuse. Take it contract by contract first, which is the test that answers the folklore: pair each contract's week one against its own days 31 to 90 and 238 became more negative while 250 became less, with 24 unchanged. That is a coin flip, so a trader reading this as "shorts collect on new listings" would be reading something the data does not contain.
Pool the settlements instead and a different, real difference appears. Week one settled negative 5,280 times out of 19,816, which is 26.6 per cent, against 28,842 of 163,327 or 17.7 per cent later. That looks like a tilt and is mostly not one: 173 of the 512 contracts, a third of them, recorded ZERO negative settlements in their first week, against 52 later. Week one is a shorter window with fewer settlements in it, so contracts pile up at the extremes of nothing-negative and mostly-negative rather than sitting in the middle. The direction of funding early is more polarized across contracts, not systematically tilted one way, and it is worth stating separately because the pooled percentage on its own would have read as a tilt.
How to reproduce this, and what it does not prove
Every input is a keyless public route, so this is checkable in about a minute. The commands below are the whole method, and you should re-run them rather than quoting this table back later, because the board moves under you. One warning about that, because it is the easiest way to get a wrong number out of step 1: the count depends entirely on the filter, and a census is a claim about the filter rather than about the venue. Asking only for contractType PERPETUAL and status TRADING returns 571 today. Adding the requirement that both the quote and the margin asset are USDT returns 528. The same response also carries 198 contracts typed TRADIFI_PERPETUAL, which are equities and metals rather than crypto, and 38 USDC-margined perpetuals. None of those numbers contradicts the others and all of them are true of the same board at the same instant.
1. Pull the board: GET /fapi/v1/exchangeInfo on fapi.binance.com, and keep the entries with contractType PERPETUAL, status TRADING and USDT as both quote and margin asset. On 2026-09-20 that is 528 contracts and all 528 carry an onboardDate.
2. Keep the contracts older than 100 days, which is 516, so that every one of them has a complete days 31 to 90 baseline.
3. For each, pull GET /fapi/v1/fundingRate with startTime set to its onboardDate, endTime 90 days later and limit 1000, and drop the contracts with fewer than 30 settlements in days 31 to 90. That leaves 514.
4. For each window, take the mean of the absolute funding rate and divide it by the same contract's days 31 to 90 mean. Summarize across contracts with a median and an interquartile range, never a mean of ratios.
5. Run step 4 again with the anchor moved to onboardDate plus 200 days. That is the placebo, and it is the step that decides whether anything in steps 1 to 4 means something.
Four limits, stated plainly. First, this is one venue. The onboardDate field is Binance's, and the equivalent at Bybit, OKX and Bitget was not pulled, so nothing here is a claim about the market. Second, the stamp is not perfect even here. Checking each contract's first traded five minute bar against its own onboard stamp, 446 of 514 first traded within five minutes of it and 488 within a day, but 64 first traded more than six hours after their stamp and 15 recorded no traded volume at all on their stamped day one, with the worst case first trading 424 days late. For those contracts "day one" is partly a window in which nothing happened. Excluding all 64 moves the day one median from 3.07 up to 3.71, so the defect works against the finding rather than for it. Third, and this is the real limit, every contract here is alive today and survived at least 100 days, so a contract that listed, printed a violent week and was delisted at day 40 cannot enter this sample at all. The Athenum measurement of perpetual futures survivorship bias showed what that costs on a neighbouring board and warned in the same breath that these venue listing stamps are records rather than history. Within-contract differencing fixes the confounds between contracts; it does nothing to the question of which contracts are in the room. Fourth, the mechanism is untested. We are not claiming to know why day one runs wide. A premium index with little volume behind it, a book that has not found its level, and an absence of any established basis are all plausible and none of them was measured here, so they stay out of the conclusion.
Is this about a new contract or a new asset?
This is the objection the post cannot answer, and it is strong enough to be its own section rather than a line in a limits list. Binance usually lists a perpetual on a token that is itself young, with a thin spot market still discovering a price and feeding the premium index. The placebo test moves the anchor WITHIN one contract's life, so the asset is equally old in both arms of it. That rules the arithmetic artifact out completely and it can never separate a new contract from a new asset.
The data points straight at the problem. Split the same 512 contracts by listing era and the first week runs at a median of 1.44 for the 85 listed between 2019 and 2021, when Binance was adding contracts to coins that already had years of spot history, against 2.32 for the 344 listed from 2024 onward. On day one the gap is not a gradient at all, it is a different result: those older listings come in at a median of 0.86, which is at the placebo level of 0.81 and therefore no effect whatsoever, while the 2024 onward cohort runs at 4.01. Draw one contract from each era and the older one is the wider of the pair only 37 times in 100.
So the honest scope of this finding is narrower than its title. What is measured is that contracts listed in recent years run several times wider in their first day than in their own settled life. What is NOT established is that listing a contract is the cause. On the subsample where the underlying asset was already mature, the day one effect is absent, and the clean test, restricting to perpetuals listed on assets with a long prior spot history, is one this post has not run. Bitcoin's own perpetual, an old asset getting a new contract in 2019, came in at 0.778, and this post attributes that to a pinned premium; the asset-age reading explains it just as well.
What survives is narrow and useful. On one venue's board, measured on 2026-09-20, a recently listed contract's funding in its first day is several times its own settled level, the effect is gone within a week, it is larger on the launches that traded most, and it does not tilt the direction of funding. Whether the cause is the contract's age or the asset's is open, and on the evidence here the asset is at least as good a candidate.
If you want to run these numbers yourself, Athenum pulls live derivatives data from Binance, Bybit, OKX, Bitget, Hyperliquid and Deribit into one normalized view, and its 34 calculators cost nothing to use: they ask for no account, take no email address, and impose no usage limits. If you want the cross-venue funding view this post reads from, start a free 7 day Pro+ trial.
One terminal. All the data.
Liquidations, orderbook depth, whale walls & open interest from 4 exchanges, all real-time, in one place.
No credit card required
