Indicator mechanics: reconstruct what the chart calculates
Calculate RSI, ZLEMA, candle-gap geometry, Parabolic SAR and EMA warm-up with reproducible examples before assigning trading meaning to their labels.
What you will practise
Audit an indicator’s inputs, state and arithmetic, then distinguish its output from volatility, resting orders, active protection and predictive evidence.
Before you start
- Read candle open, high, low and close values.
- Calculate a percentage, a weighted average and a simple position loss.
Course outline
- 1
RSI is momentum, not volatility: calculate the difference
Rebuild RSI from gains and losses, then compare two price paths with equal RSI and very different movement sizes.
7 min - 2
Test ZLEMA response and overshoot on a known price path
Compare EMA with lag-compensated input using the same smoothing length, initialization and hypothetical prices.
7 min - 3
Fair value gaps: separate candle geometry from resting orders
Apply an explicit three-candle FVG rule, inspect its middle-bar trades and distinguish first touch from full traversal.
7 min - 4
Calculate Parabolic SAR before treating it as an active stop
Reconcile the SAR recurrence, previous-range constraint, order amendment and actual fill on one timestamped example.
7 min - 5
Why two EMAs disagree: reconcile warm-up history and seeds
Calculate how different EMA starting states converge under identical later inputs and choose an explicit comparison tolerance.
7 min
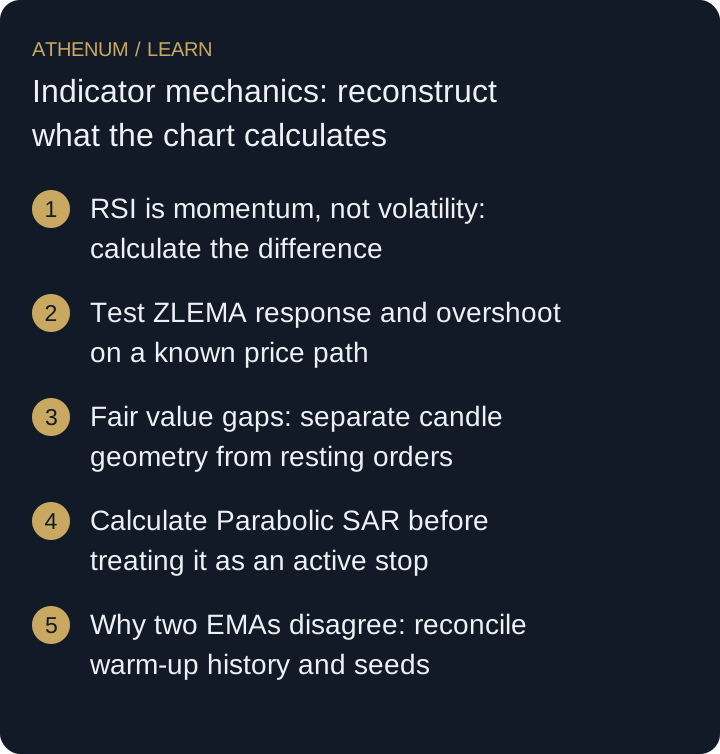 Open full-size diagram
- RSI is momentum, not volatility: calculate the difference
- Test ZLEMA response and overshoot on a known price path
- Fair value gaps: separate candle geometry from resting orders
- Calculate Parabolic SAR before treating it as an active stop
- Why two EMAs disagree: reconcile warm-up history and seeds
Educational material. Examples do not establish a profitable strategy. Trading costs, gaps and liquidation can produce losses beyond a planned stop.