
Athenum Analytics
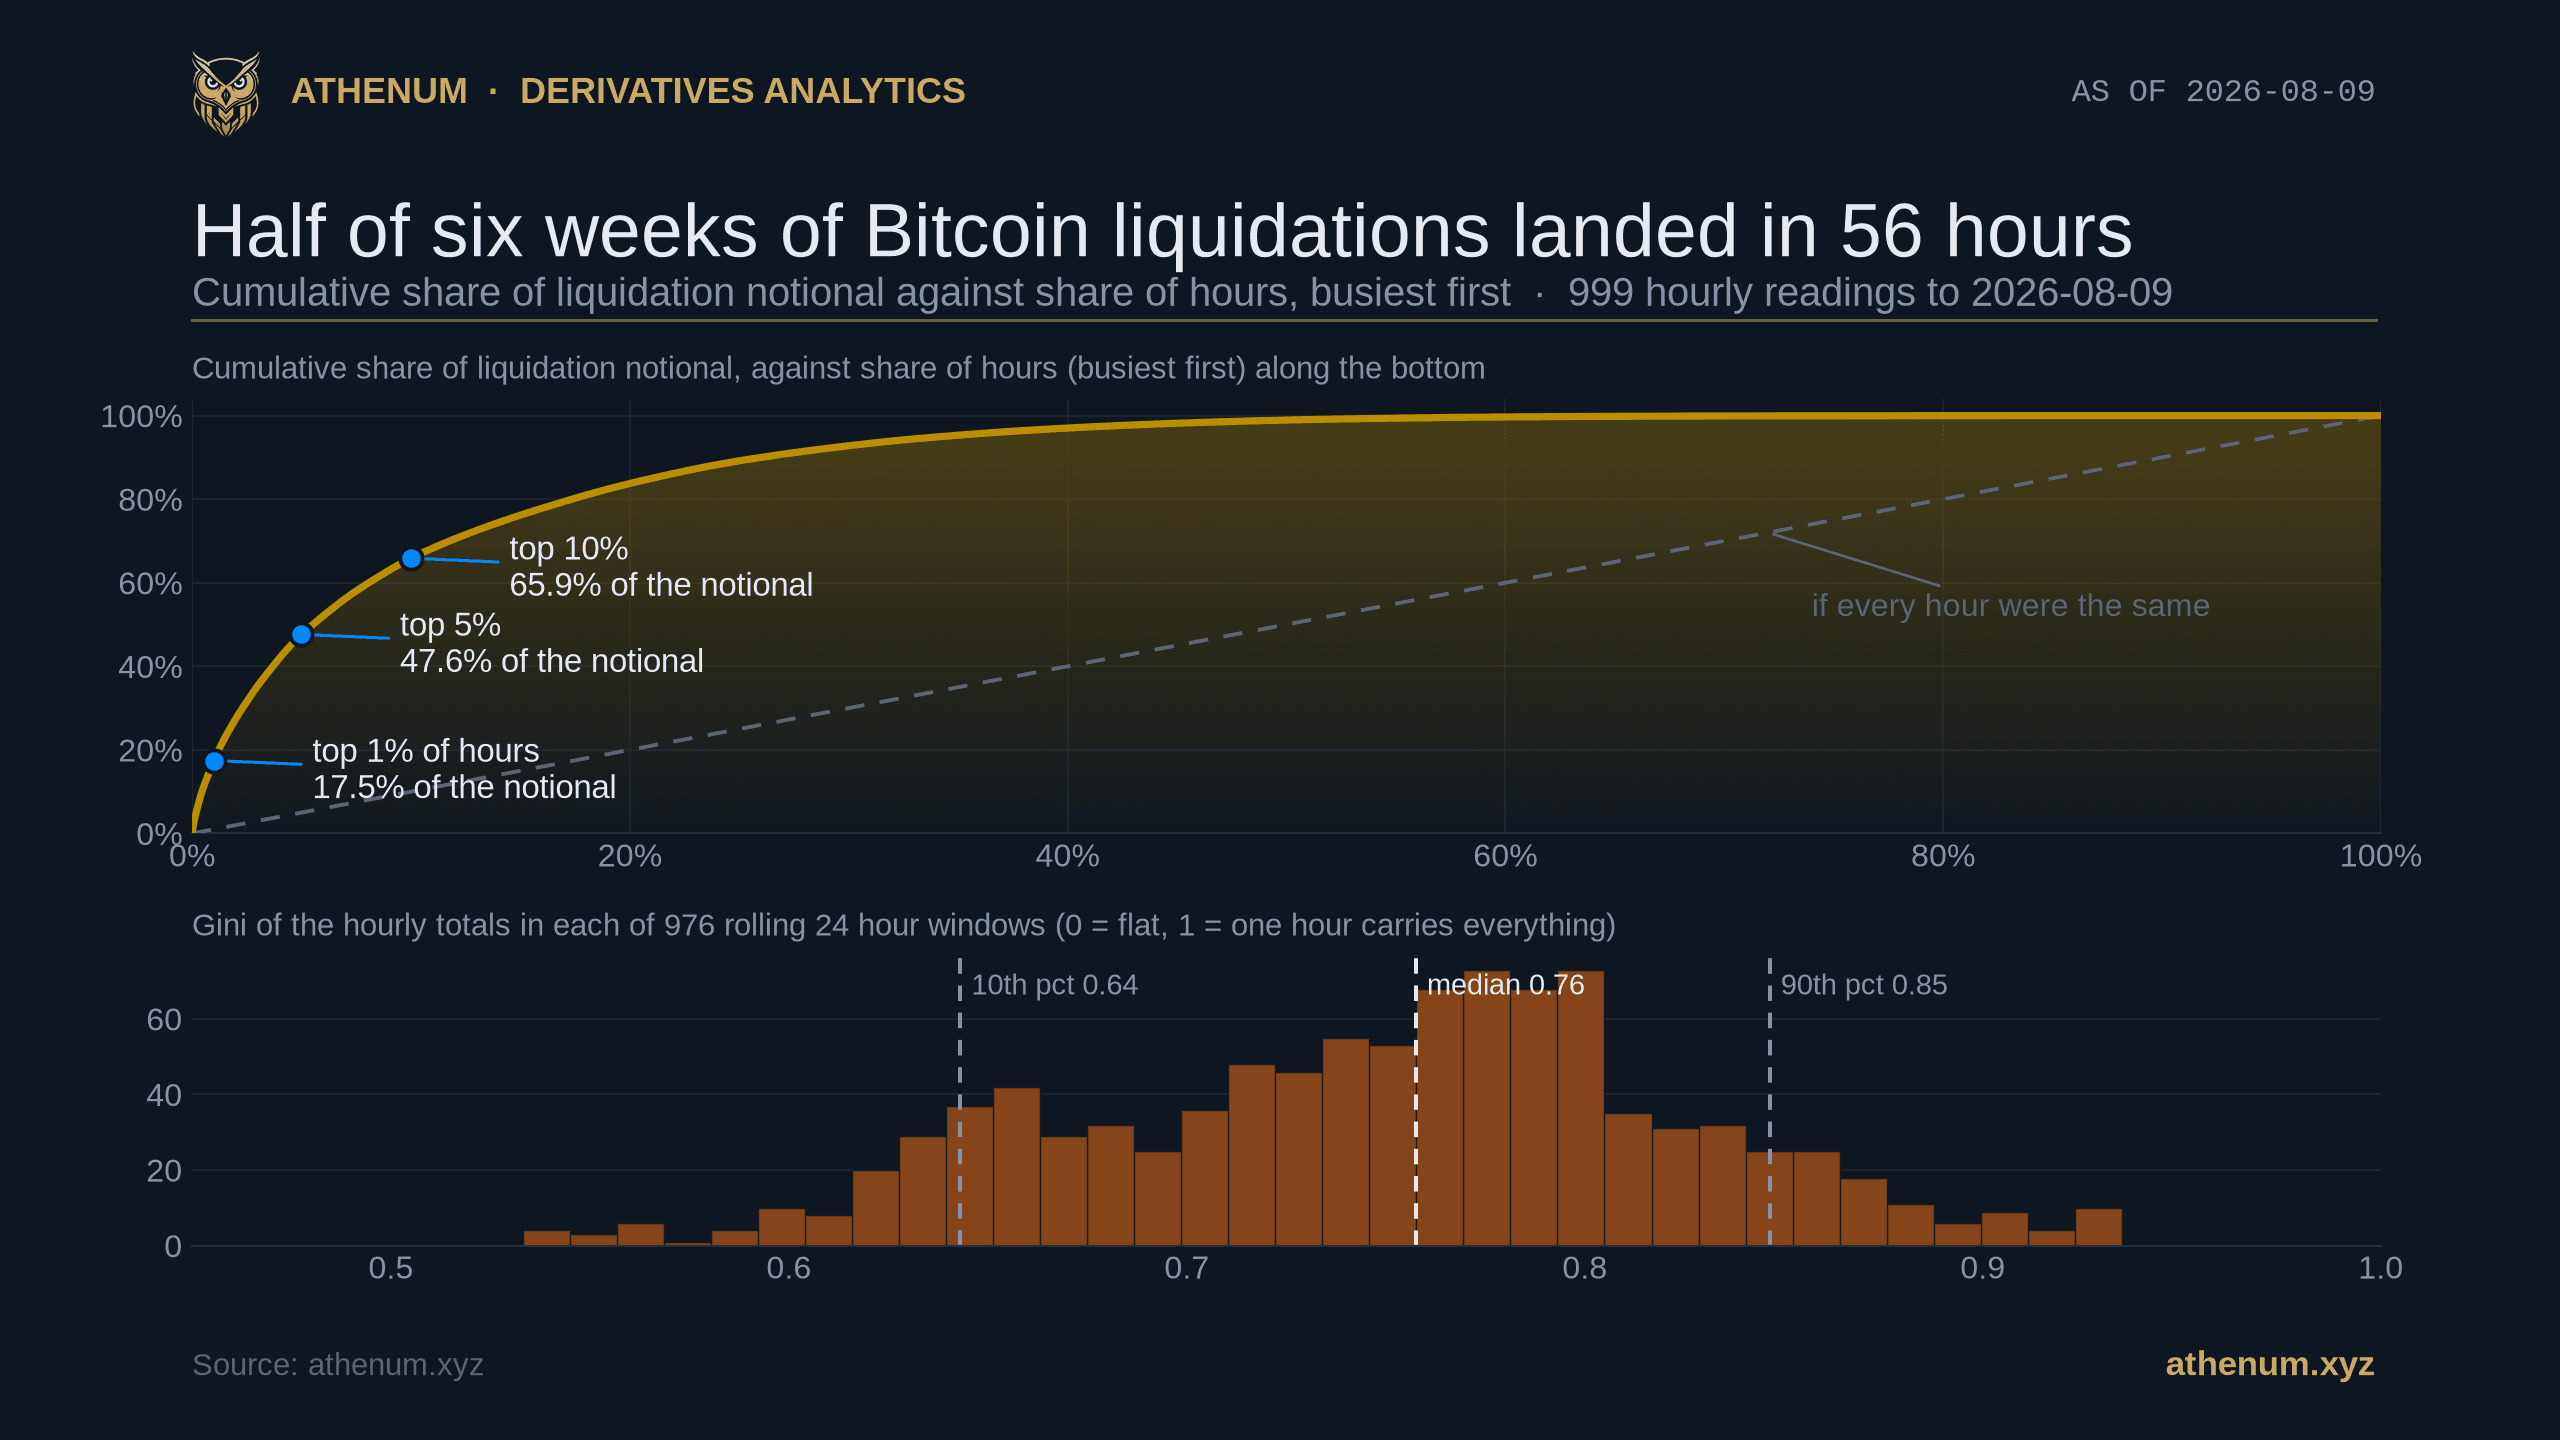
Bitcoin Liquidations by the Hour: Half of Six Weeks Landed in 56 Hours
Bitcoin liquidations do not arrive at a steady rate. Over 999 completed hourly readings to 2026-08-09, half of all the notional landed in 56 hours and the busiest 1% of hours carried 17.5%. Almost every hour is one way, while the whole panel pooled together looks balanced.
 Athenum Analytics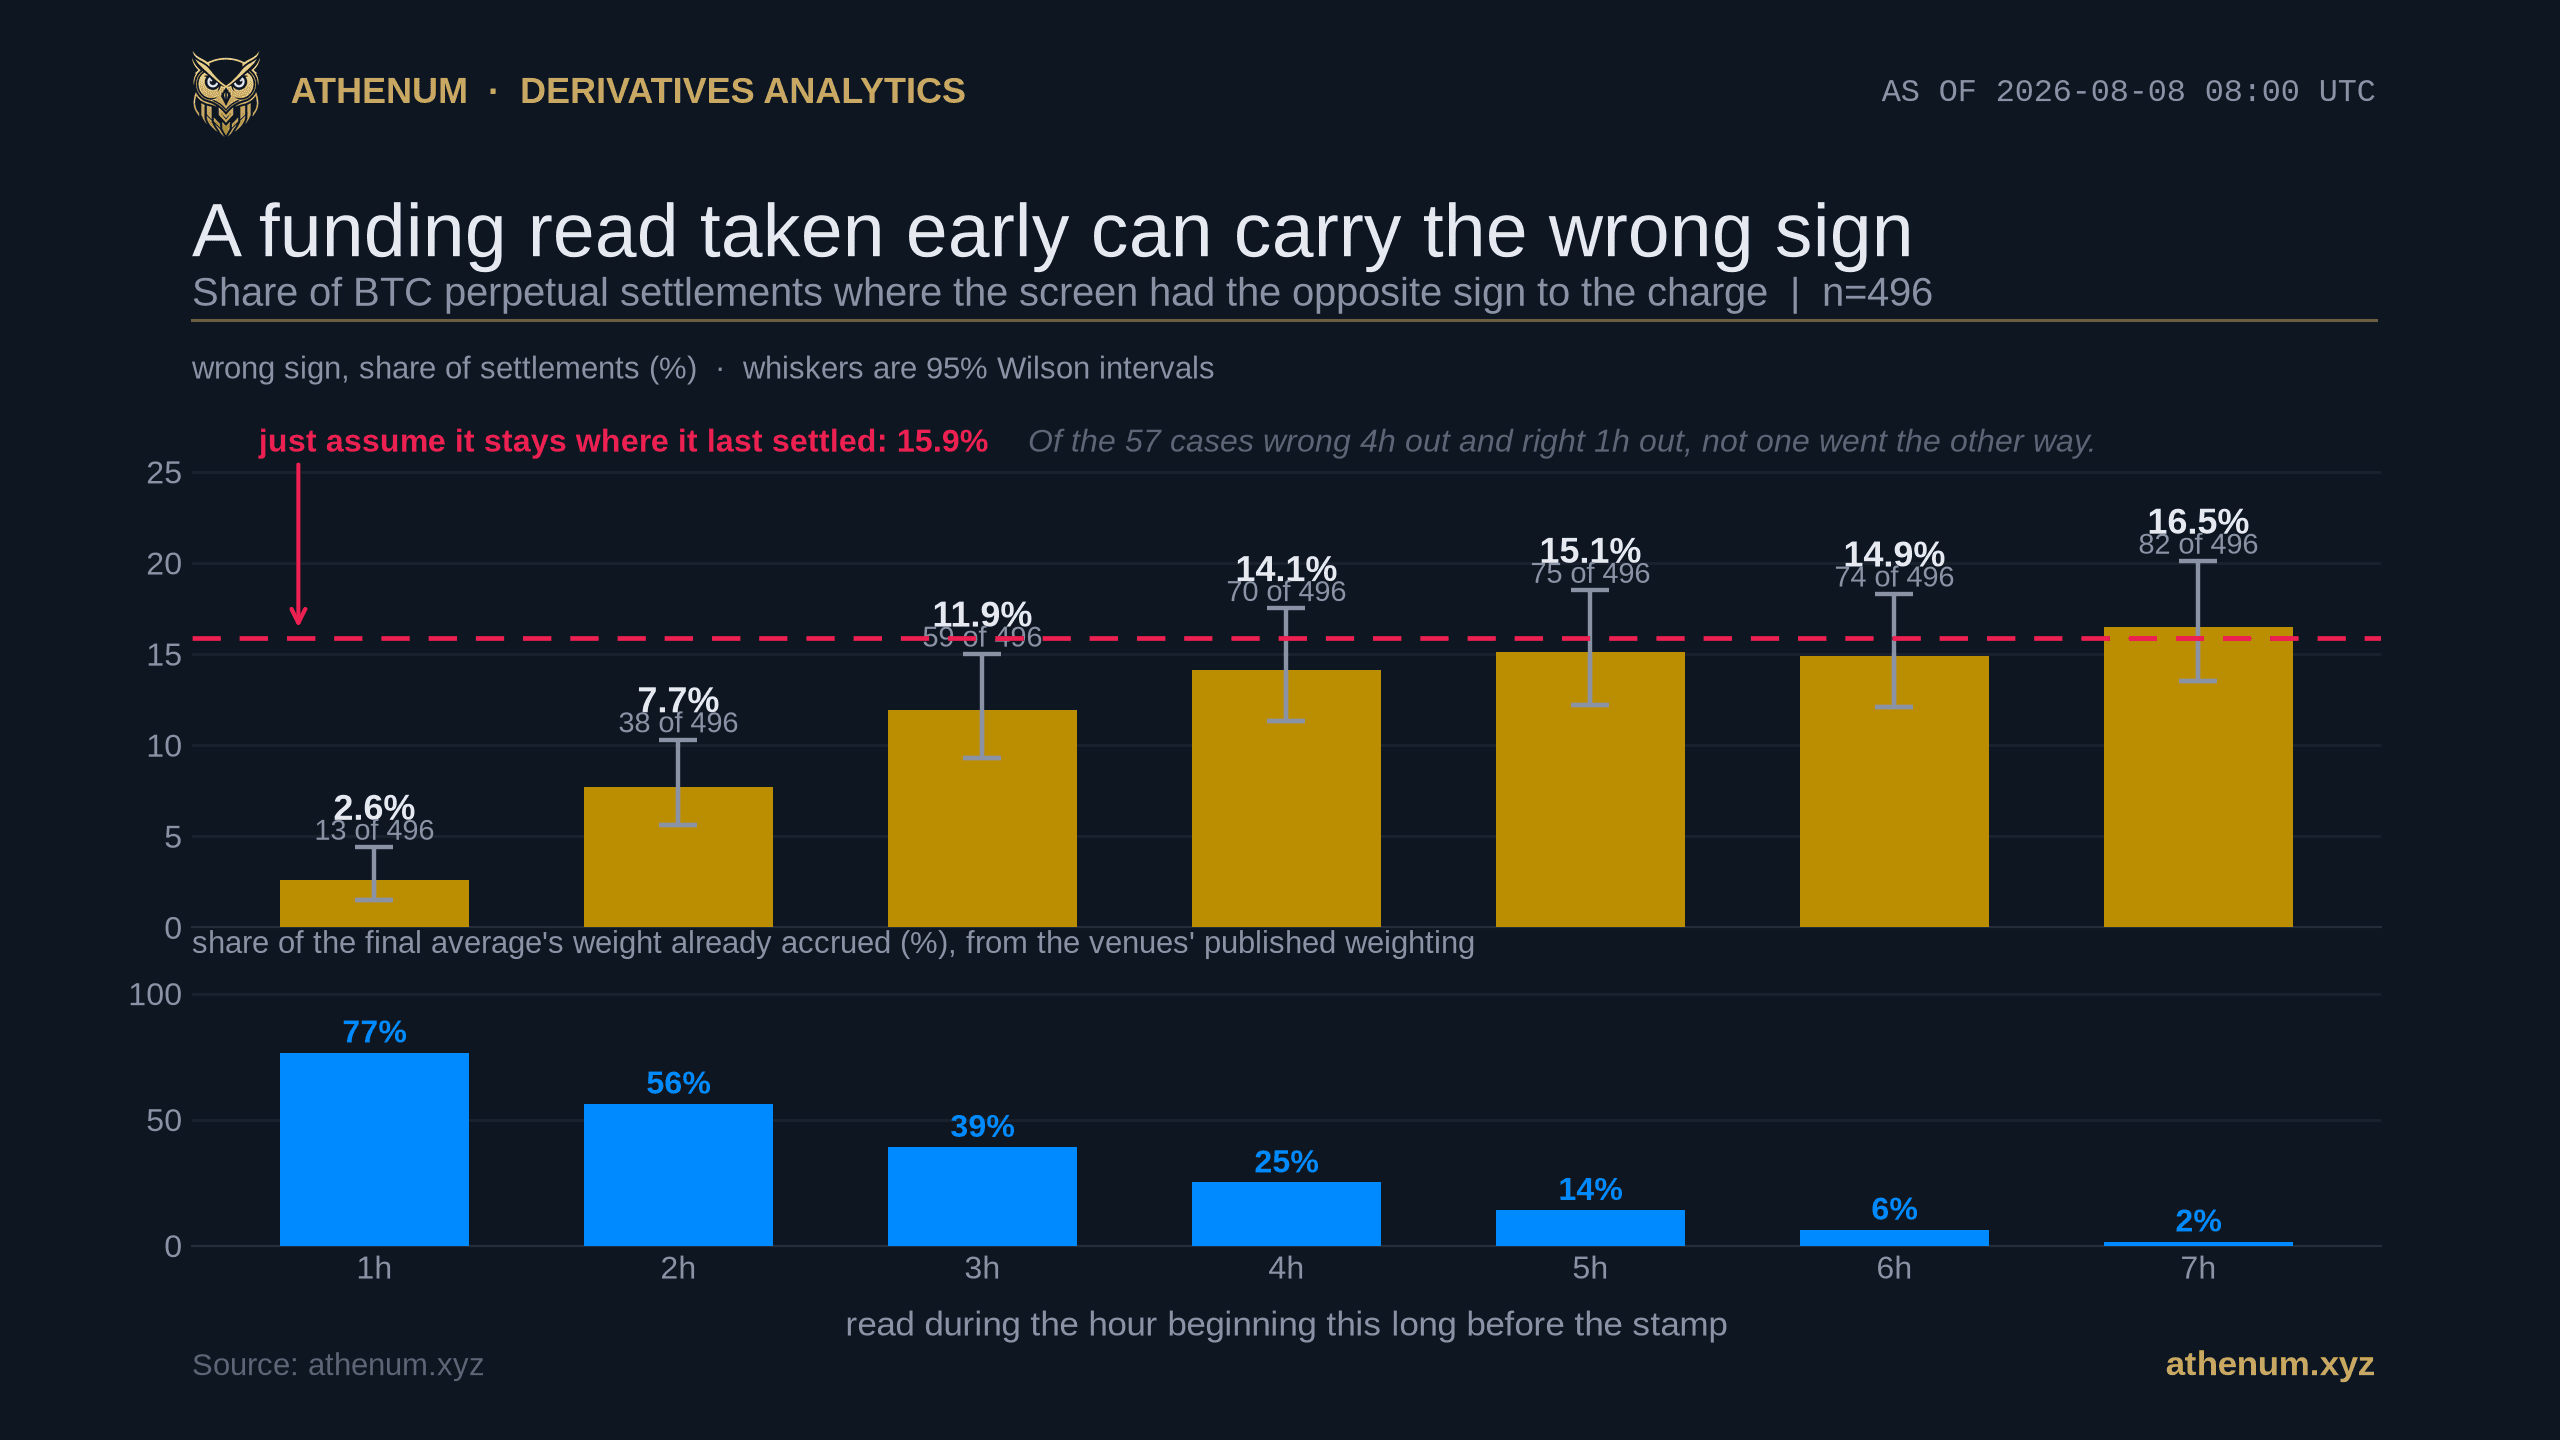
Bitcoin Funding Rates Only Beat the Last Settlement in the Final Three Hours
The funding rate a venue shows you before a settlement is a running average, not the rate it will charge. Over 496 Bitcoin perpetual venue-settlements to 2026-08-08, a read taken four hours out was no better than assuming the rate stays where it last settled. The screen only starts to separate inside three hours.
Athenum Analytics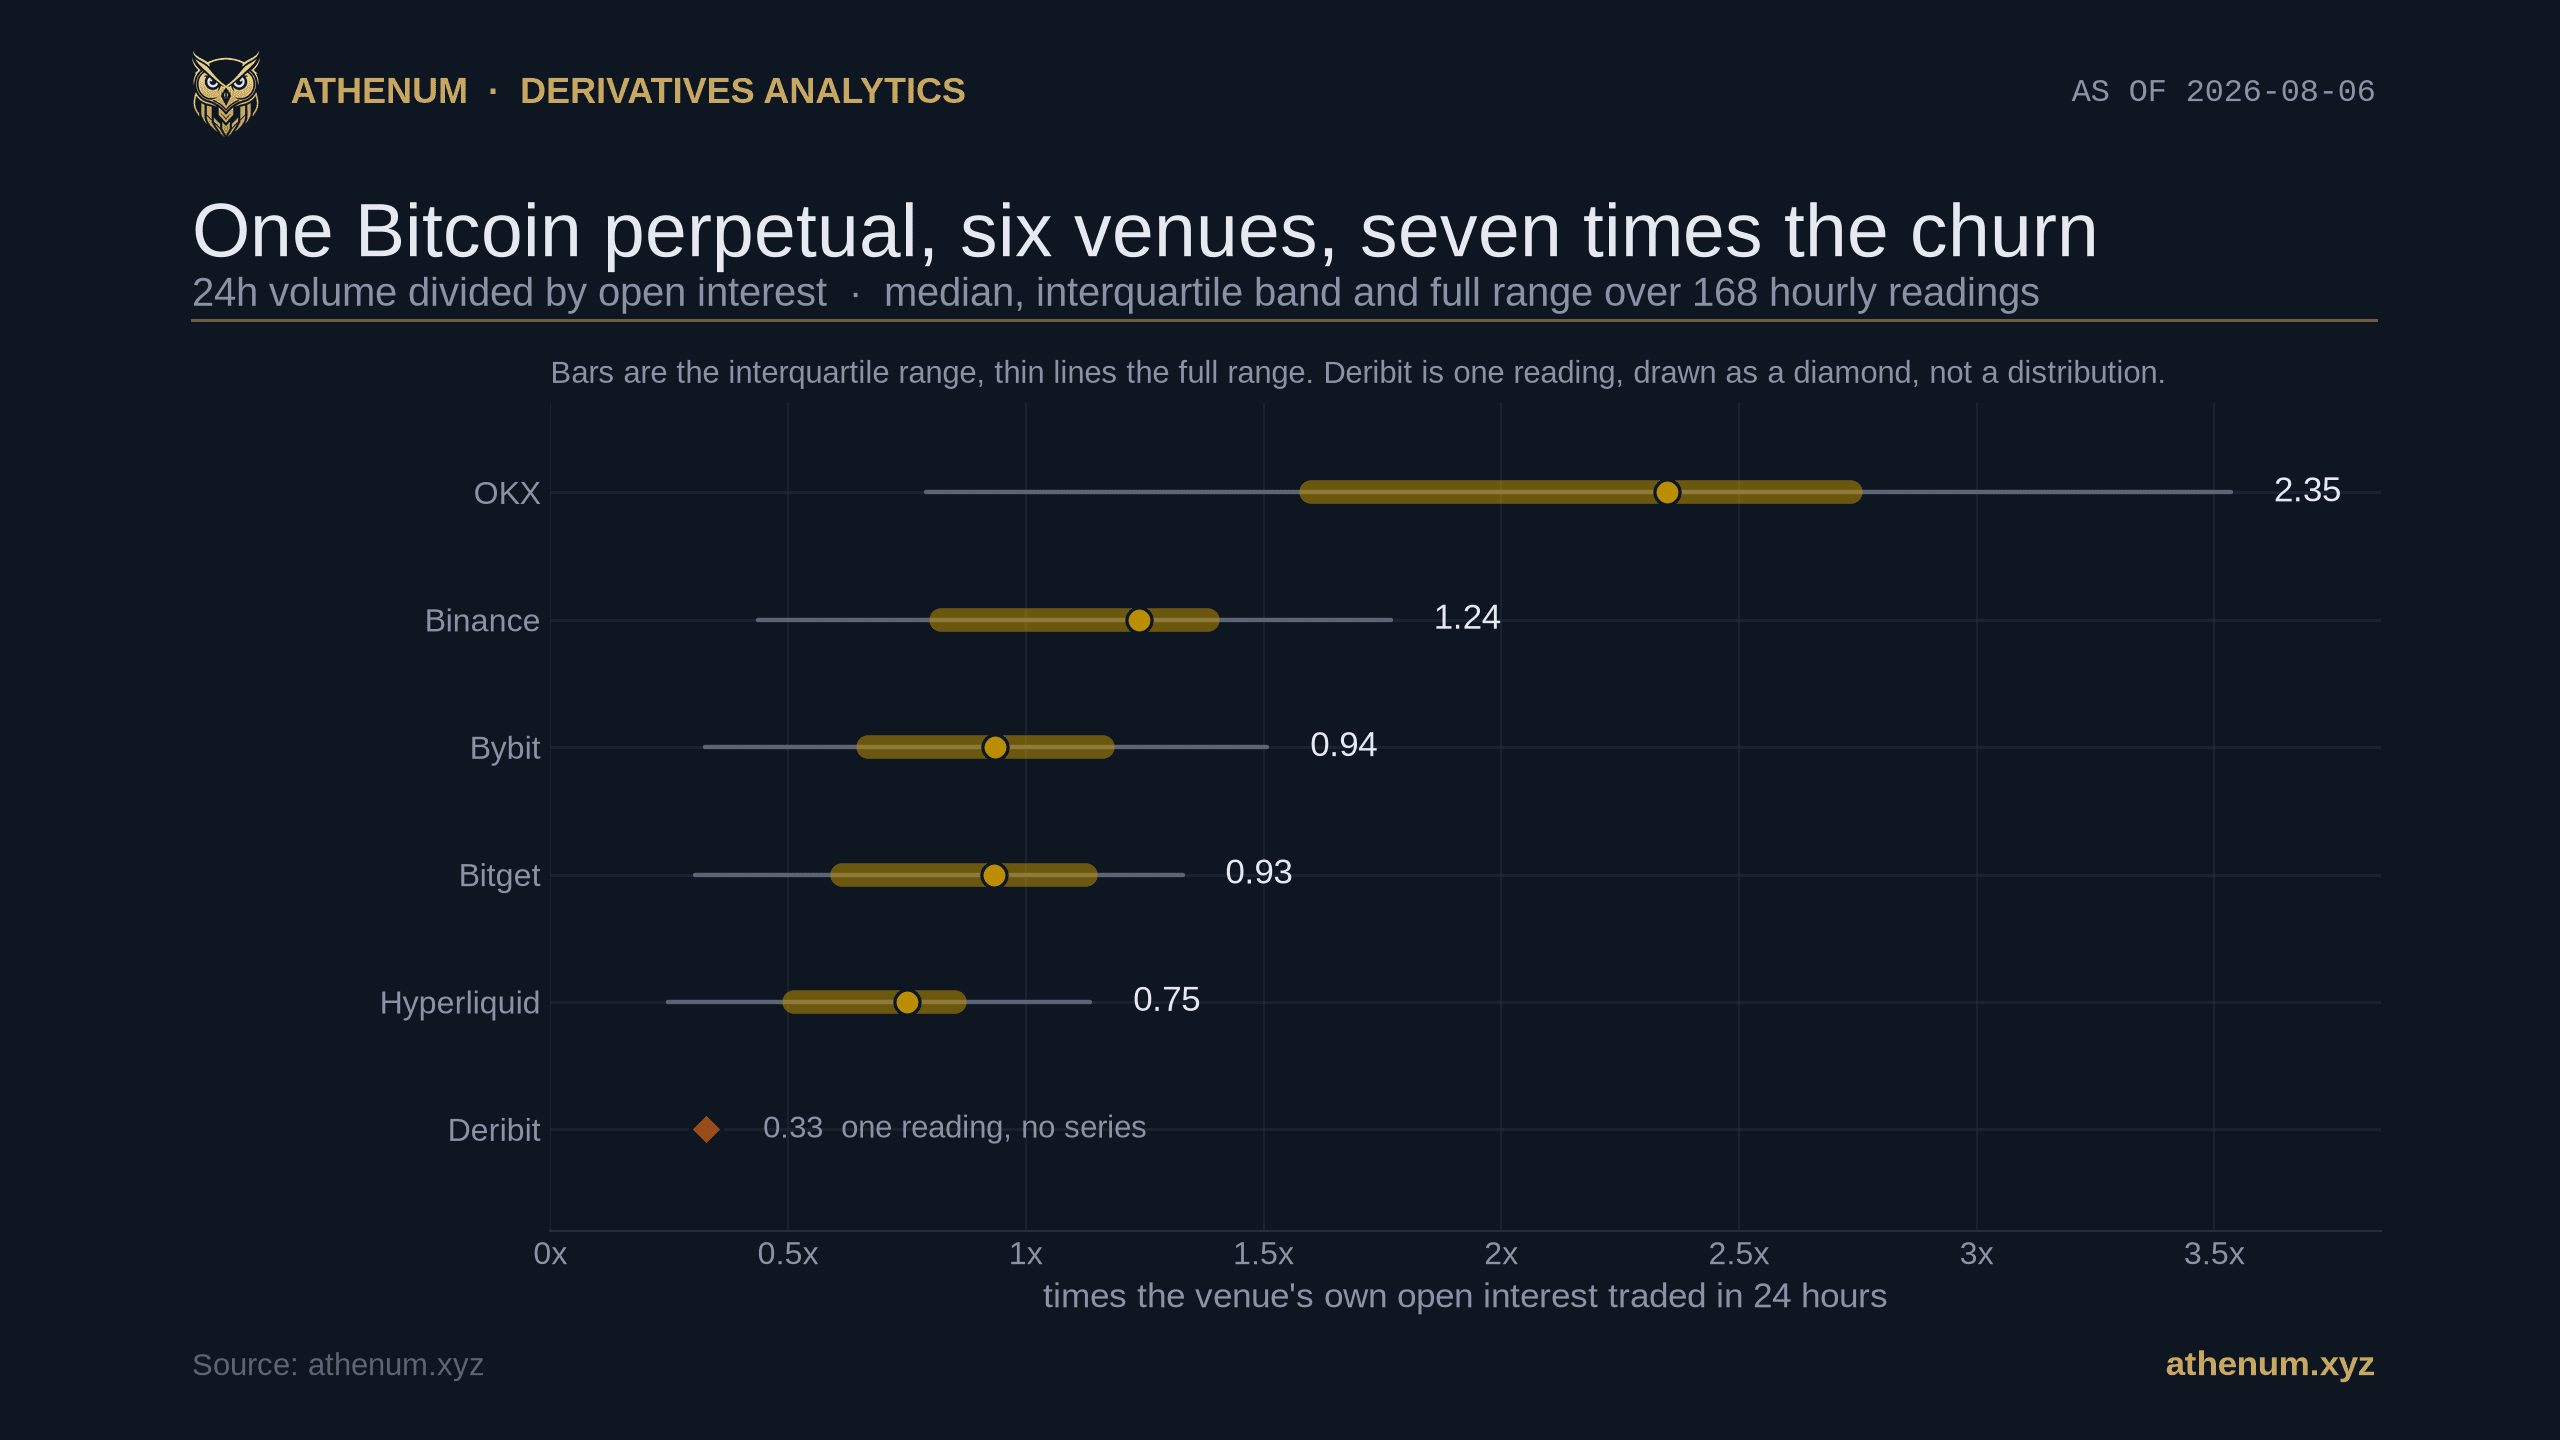
Bitcoin Perp Turnover Runs Three Times Faster on OKX Than on Hyperliquid
Turnover is the notional a venue traded in a day divided by the open interest still on its book. Run it on the same six Bitcoin perpetuals and the answers span a factor of seven, the two venues in the middle turn out not to be separable at all, and one venue's own open interest field doubles its own result.
Athenum Analytics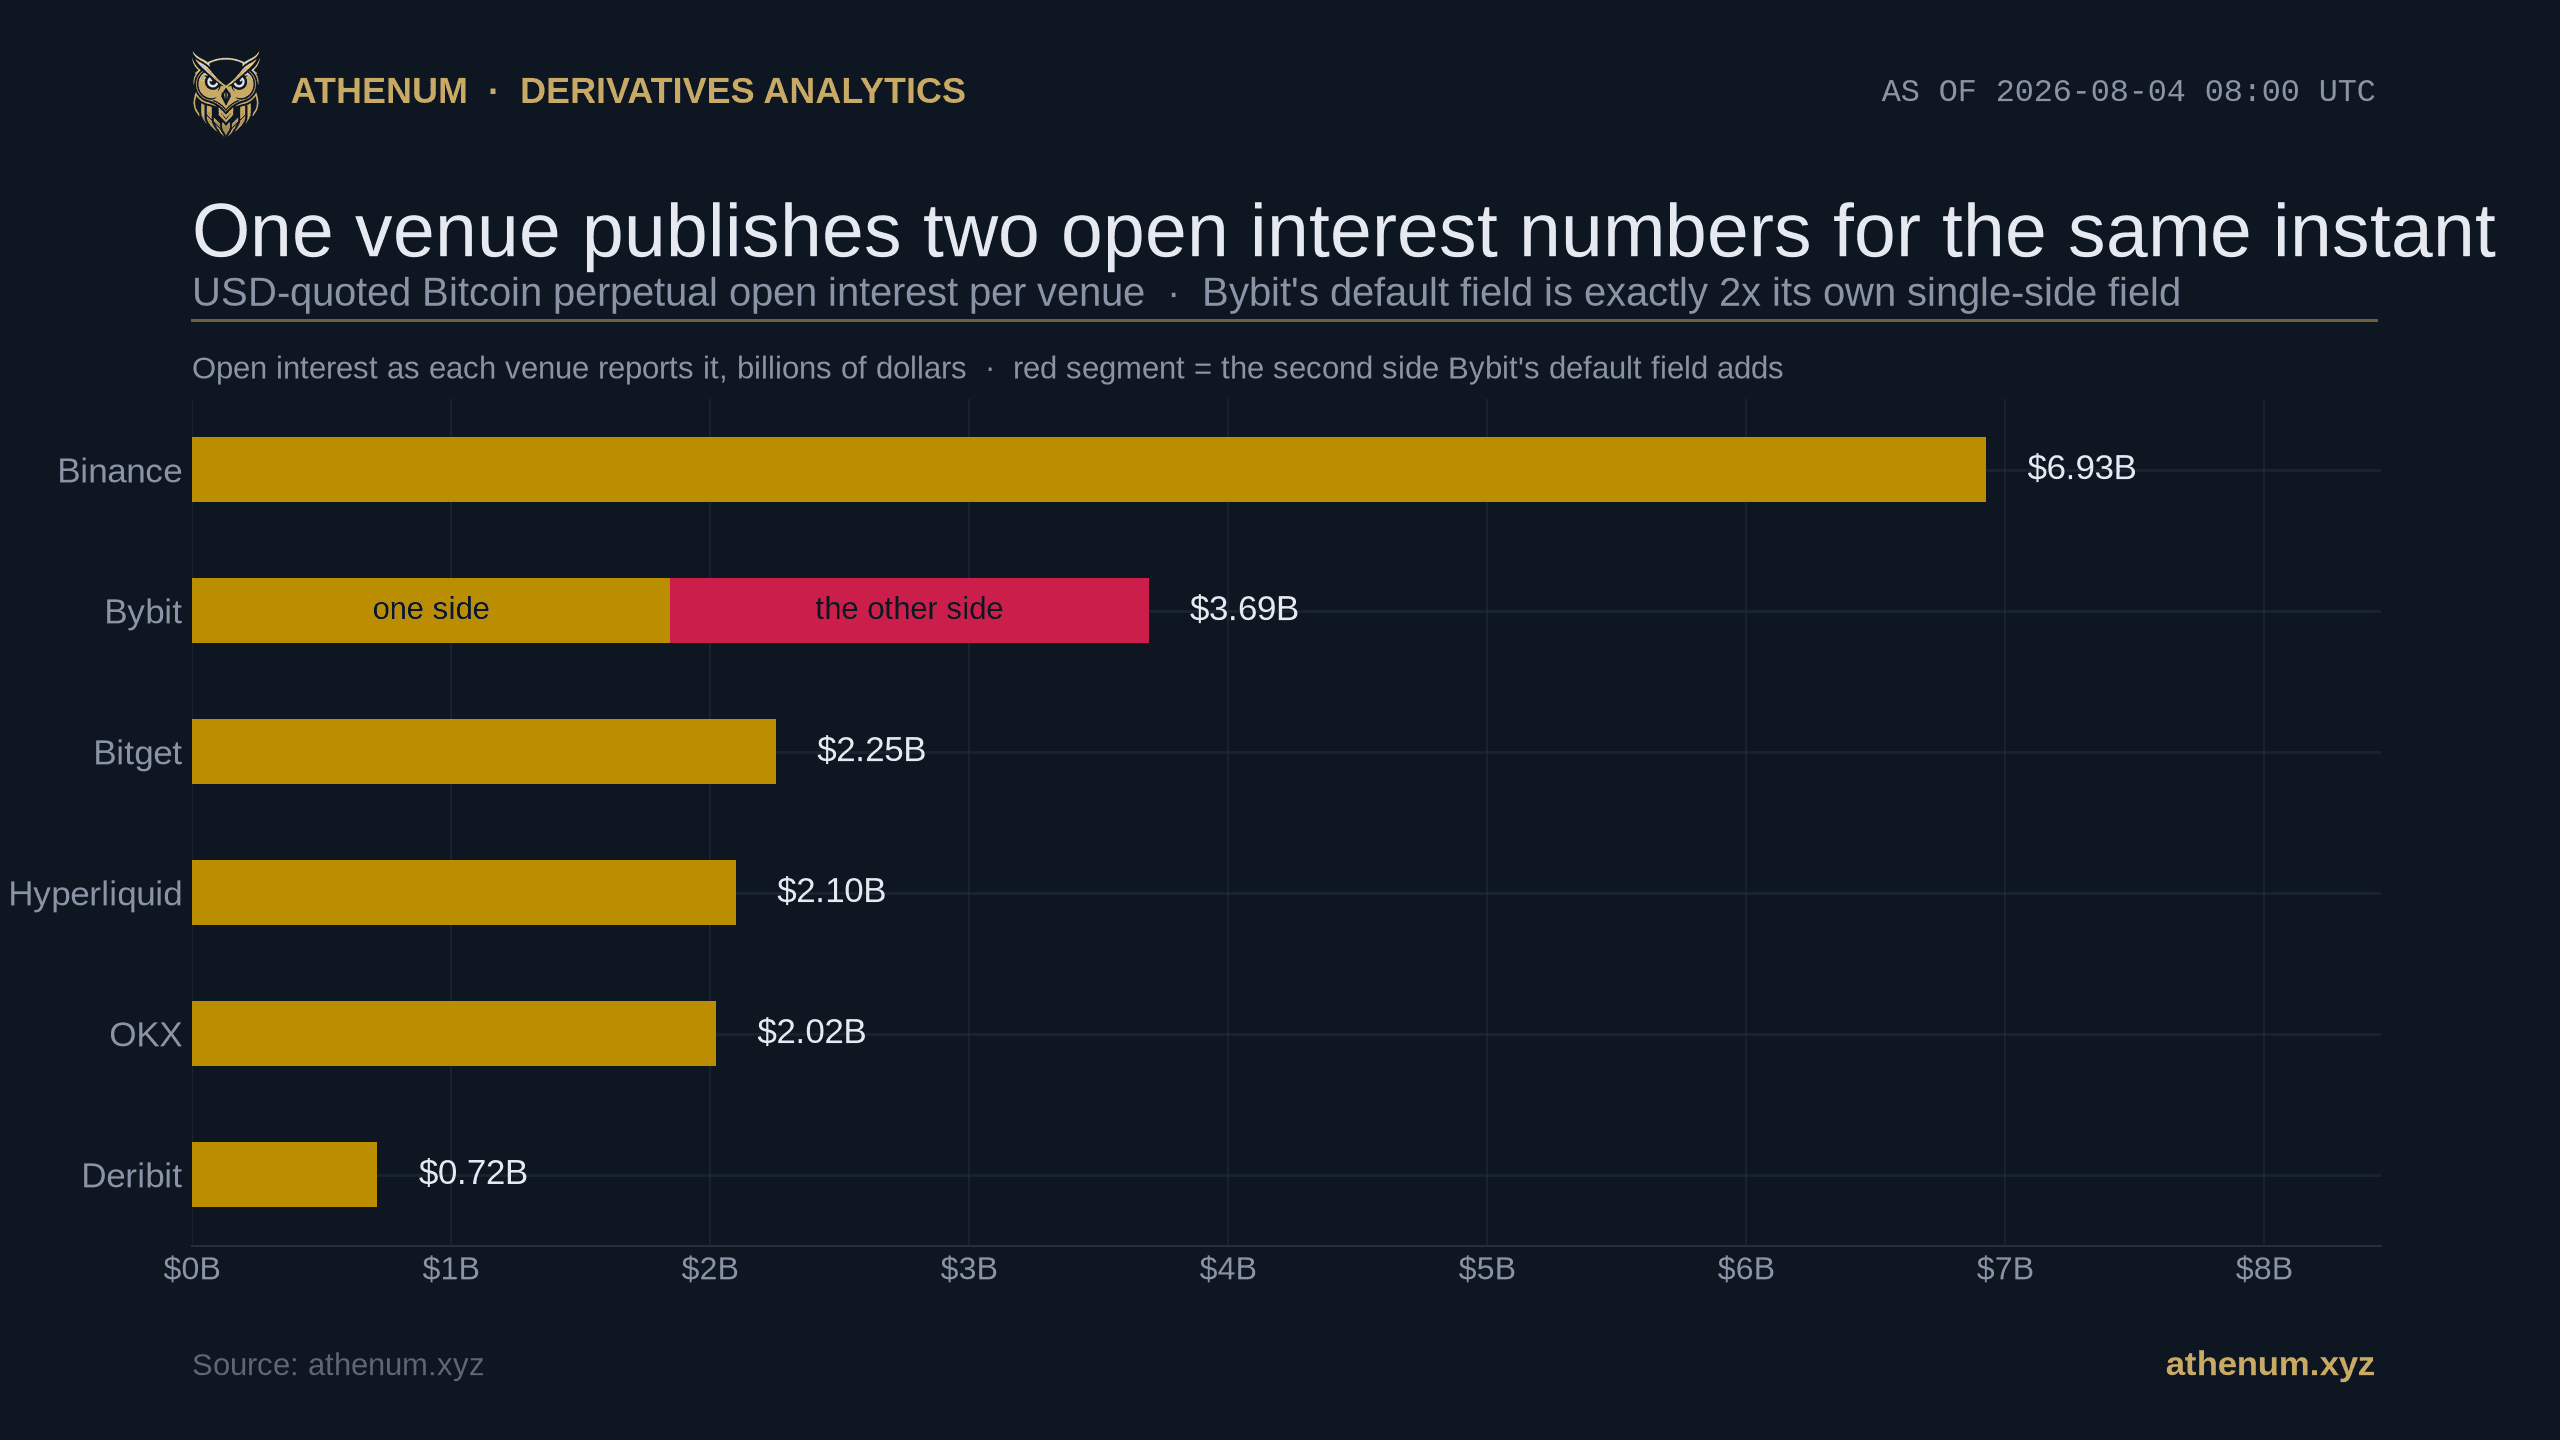
Open Interest One Side or Both, and Most Venues Never Say Which
Every futures contract has one long and one short, so a venue can report the open position once or twice and both are defensible. The problem is not that venues are silent about which they do. It is that the two venues here which do say both say they count twice, and adding their figures to the rest produces a total in no unit at all.
Athenum Analytics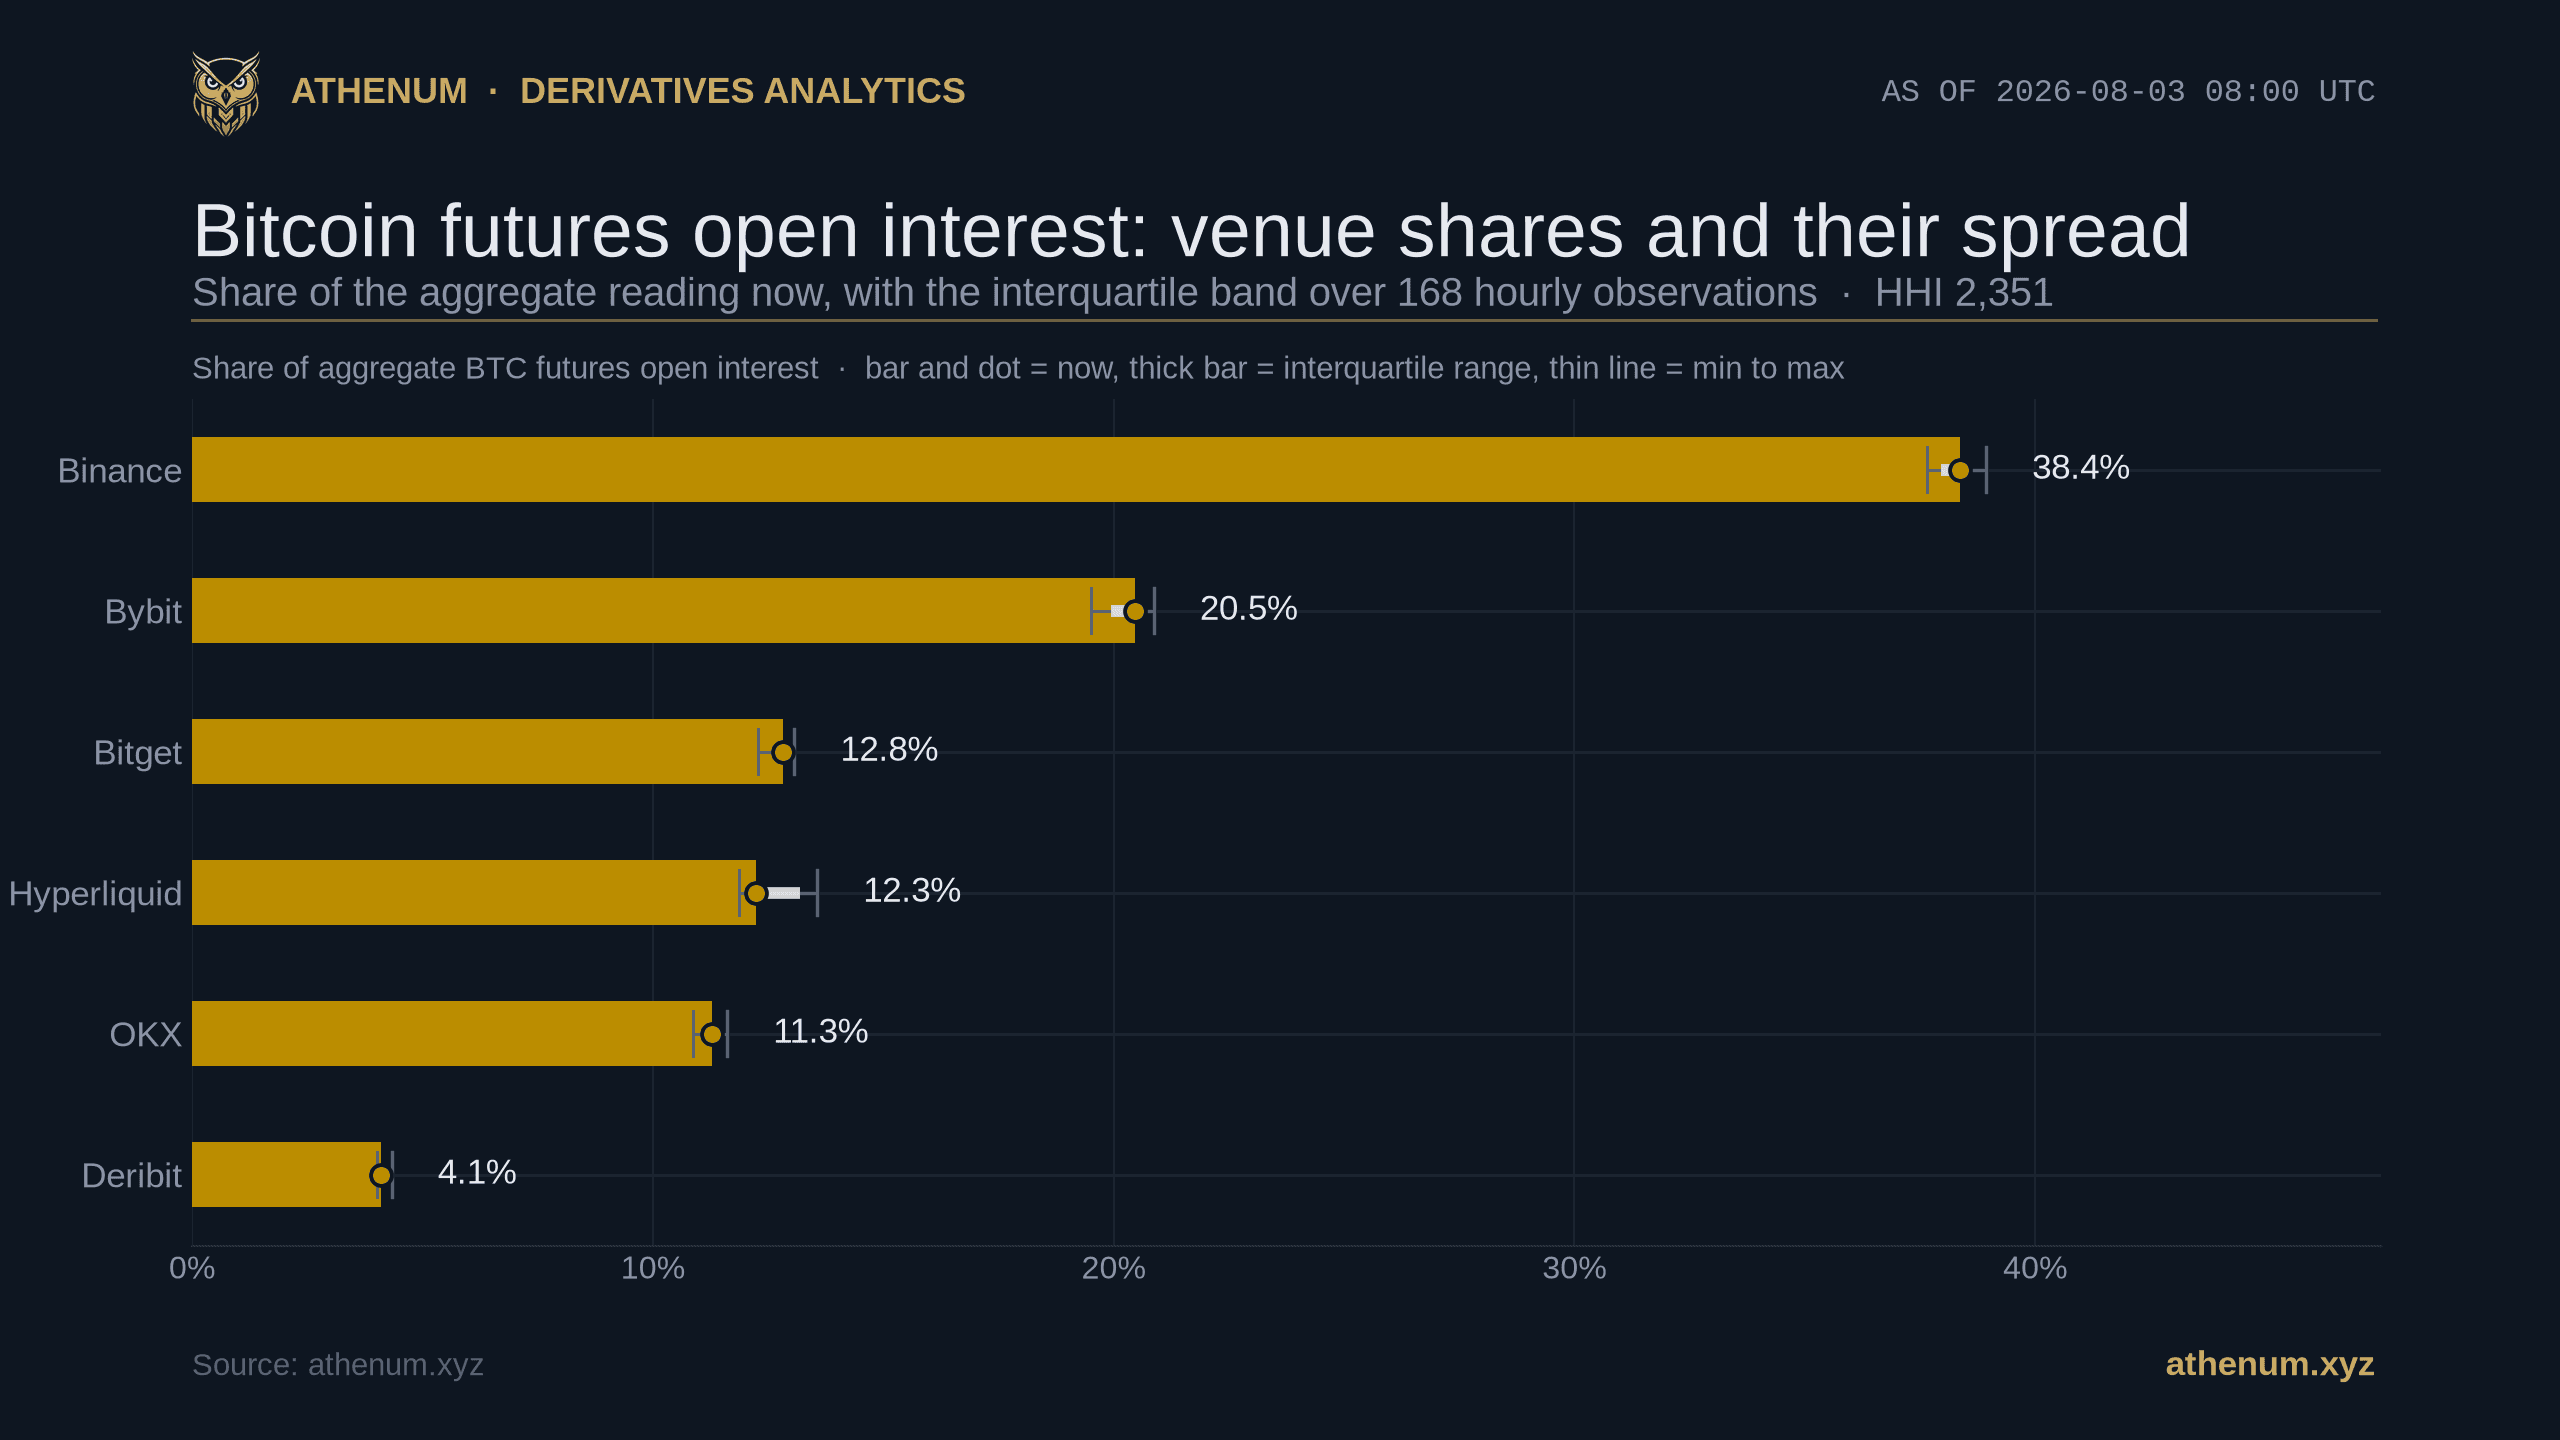
Bitcoin Open Interest Concentration: What the HHI Says About Venue Risk
On 2026-08-05 the same six venue readings give a Bitcoin open interest concentration index of 2,376, 2,552 or 2,784, depending on which of them count both sides of a contract. Only one of the six publishes a figure that settles it.
Athenum Analytics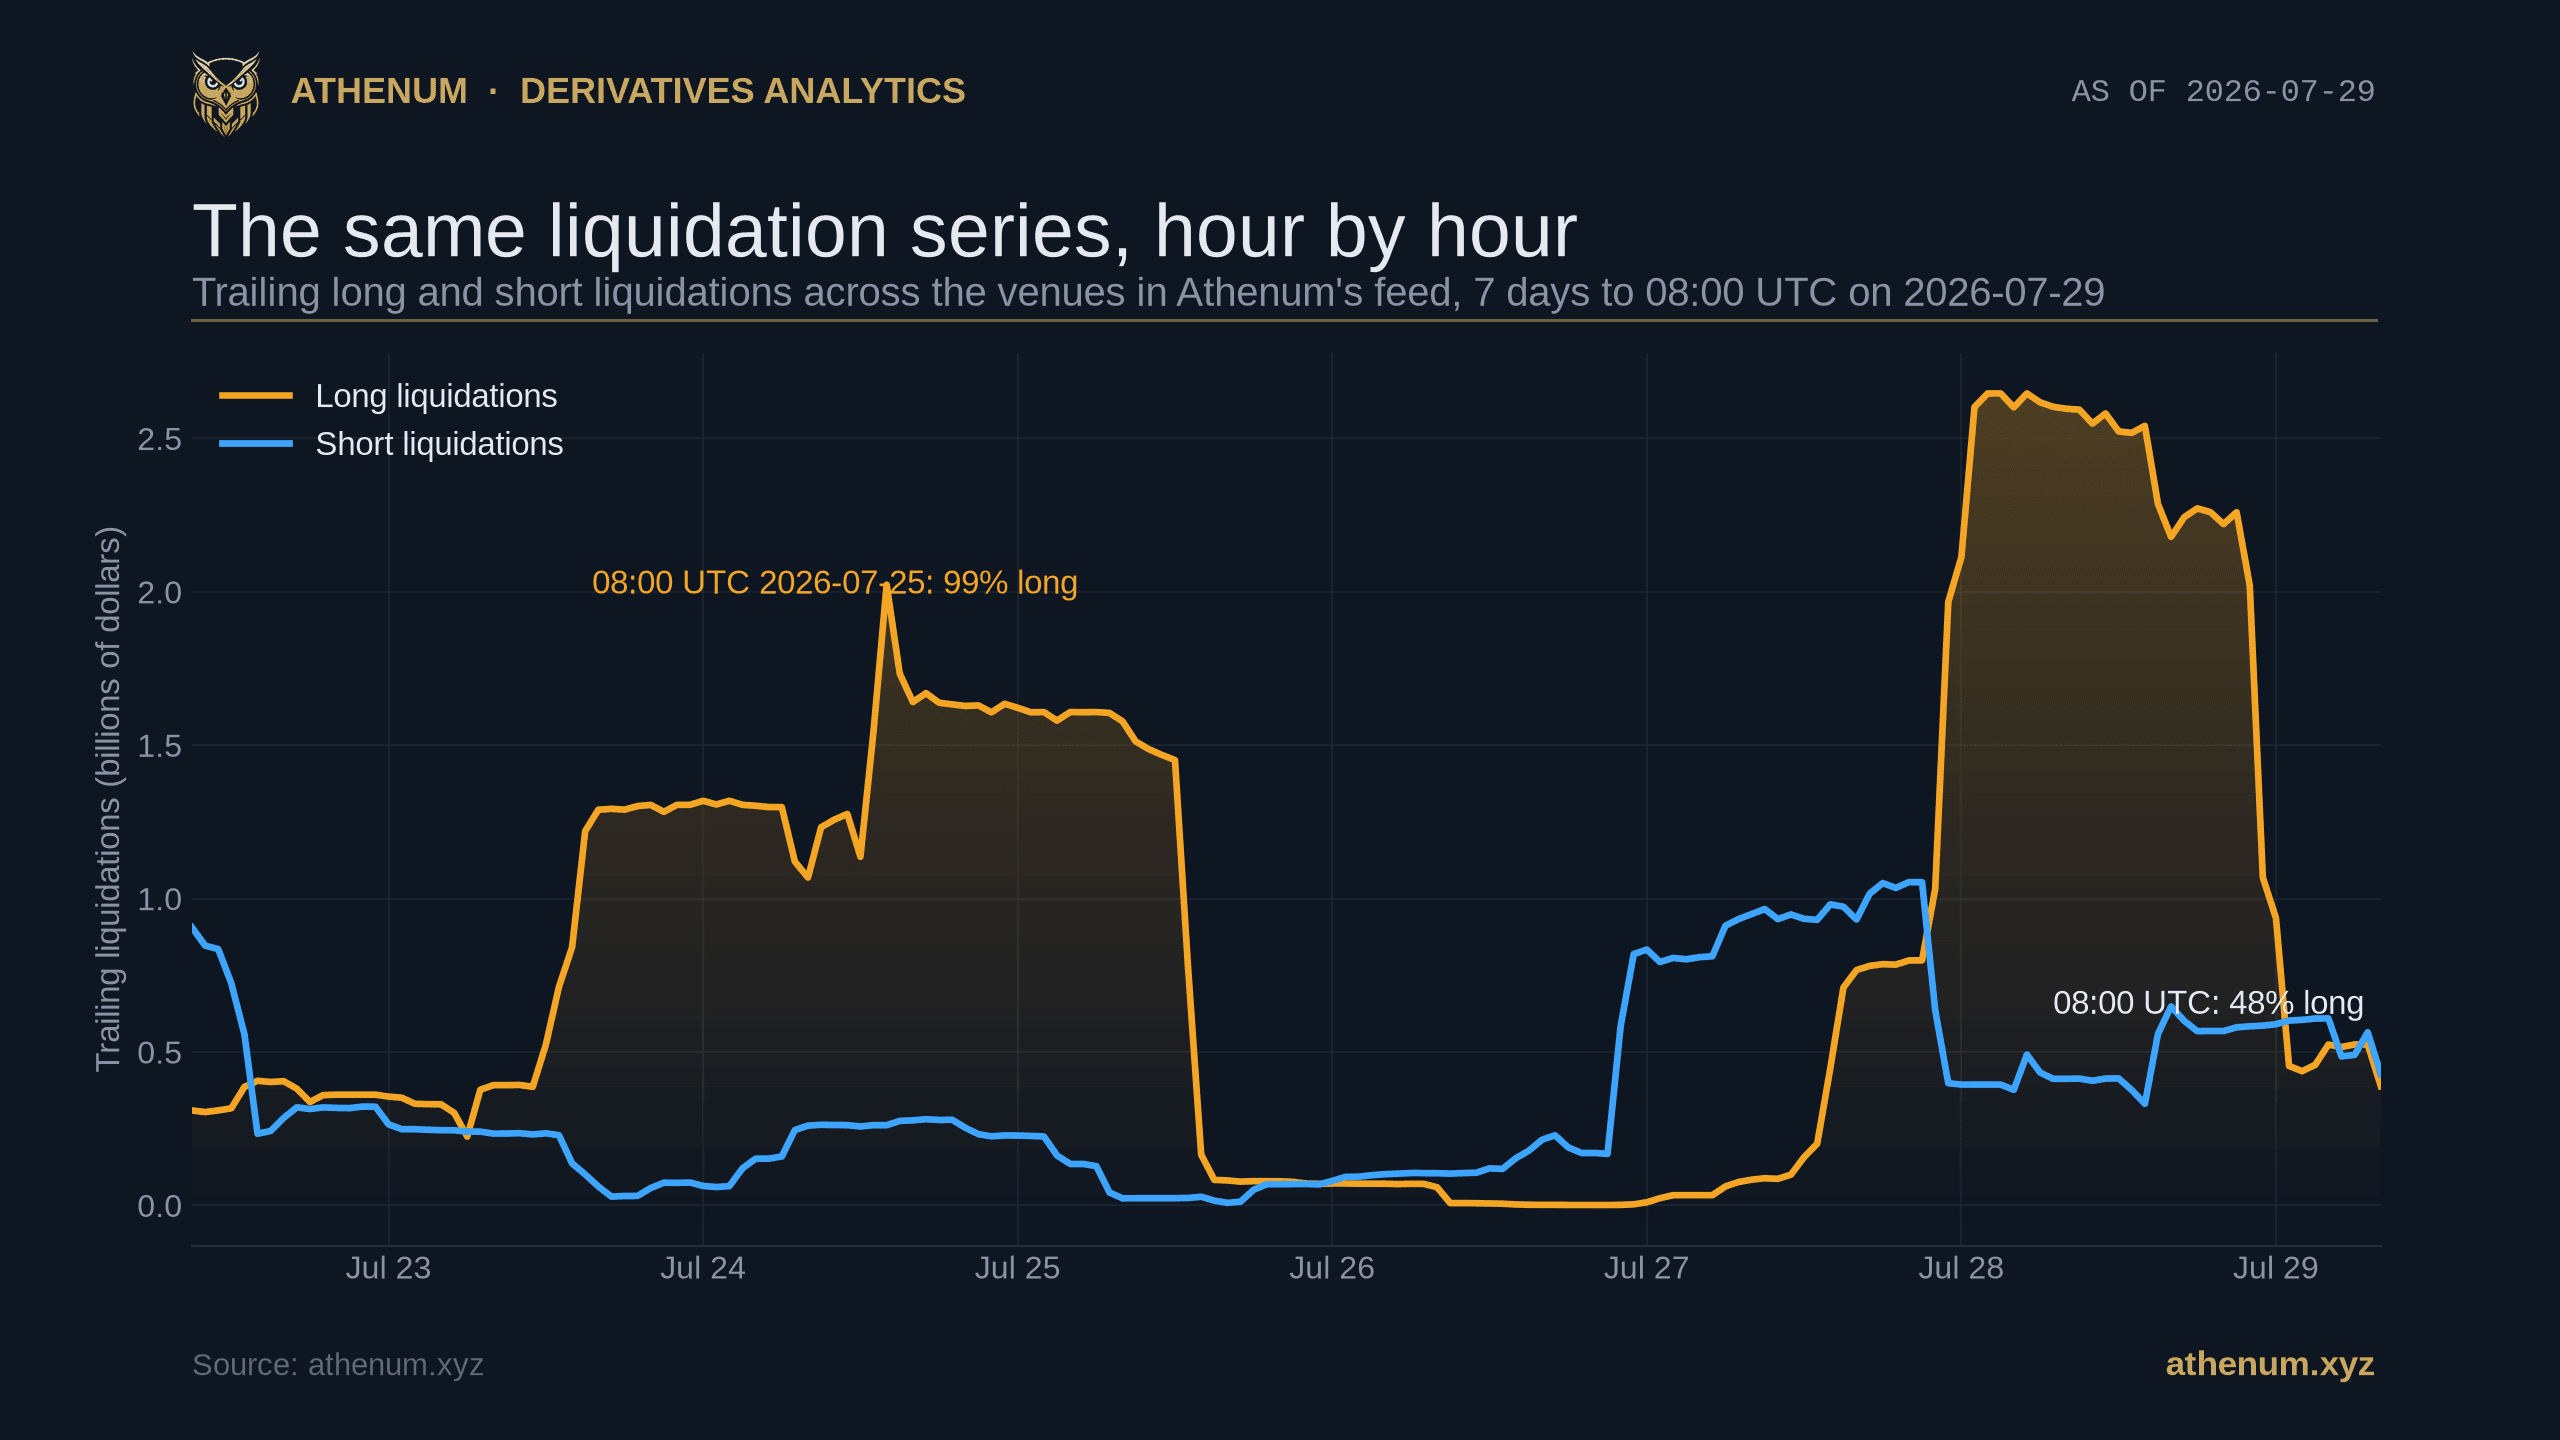
Crypto Liquidation Data: Why the Reported Number Is a Floor, Not a Total
A crypto liquidation total is a measurement, not a fact, and at least one major venue documents that its public feed pushes only one order per symbol per second. Here is what the number counts, what it drops, and the four checks that make it usable.
Athenum Analytics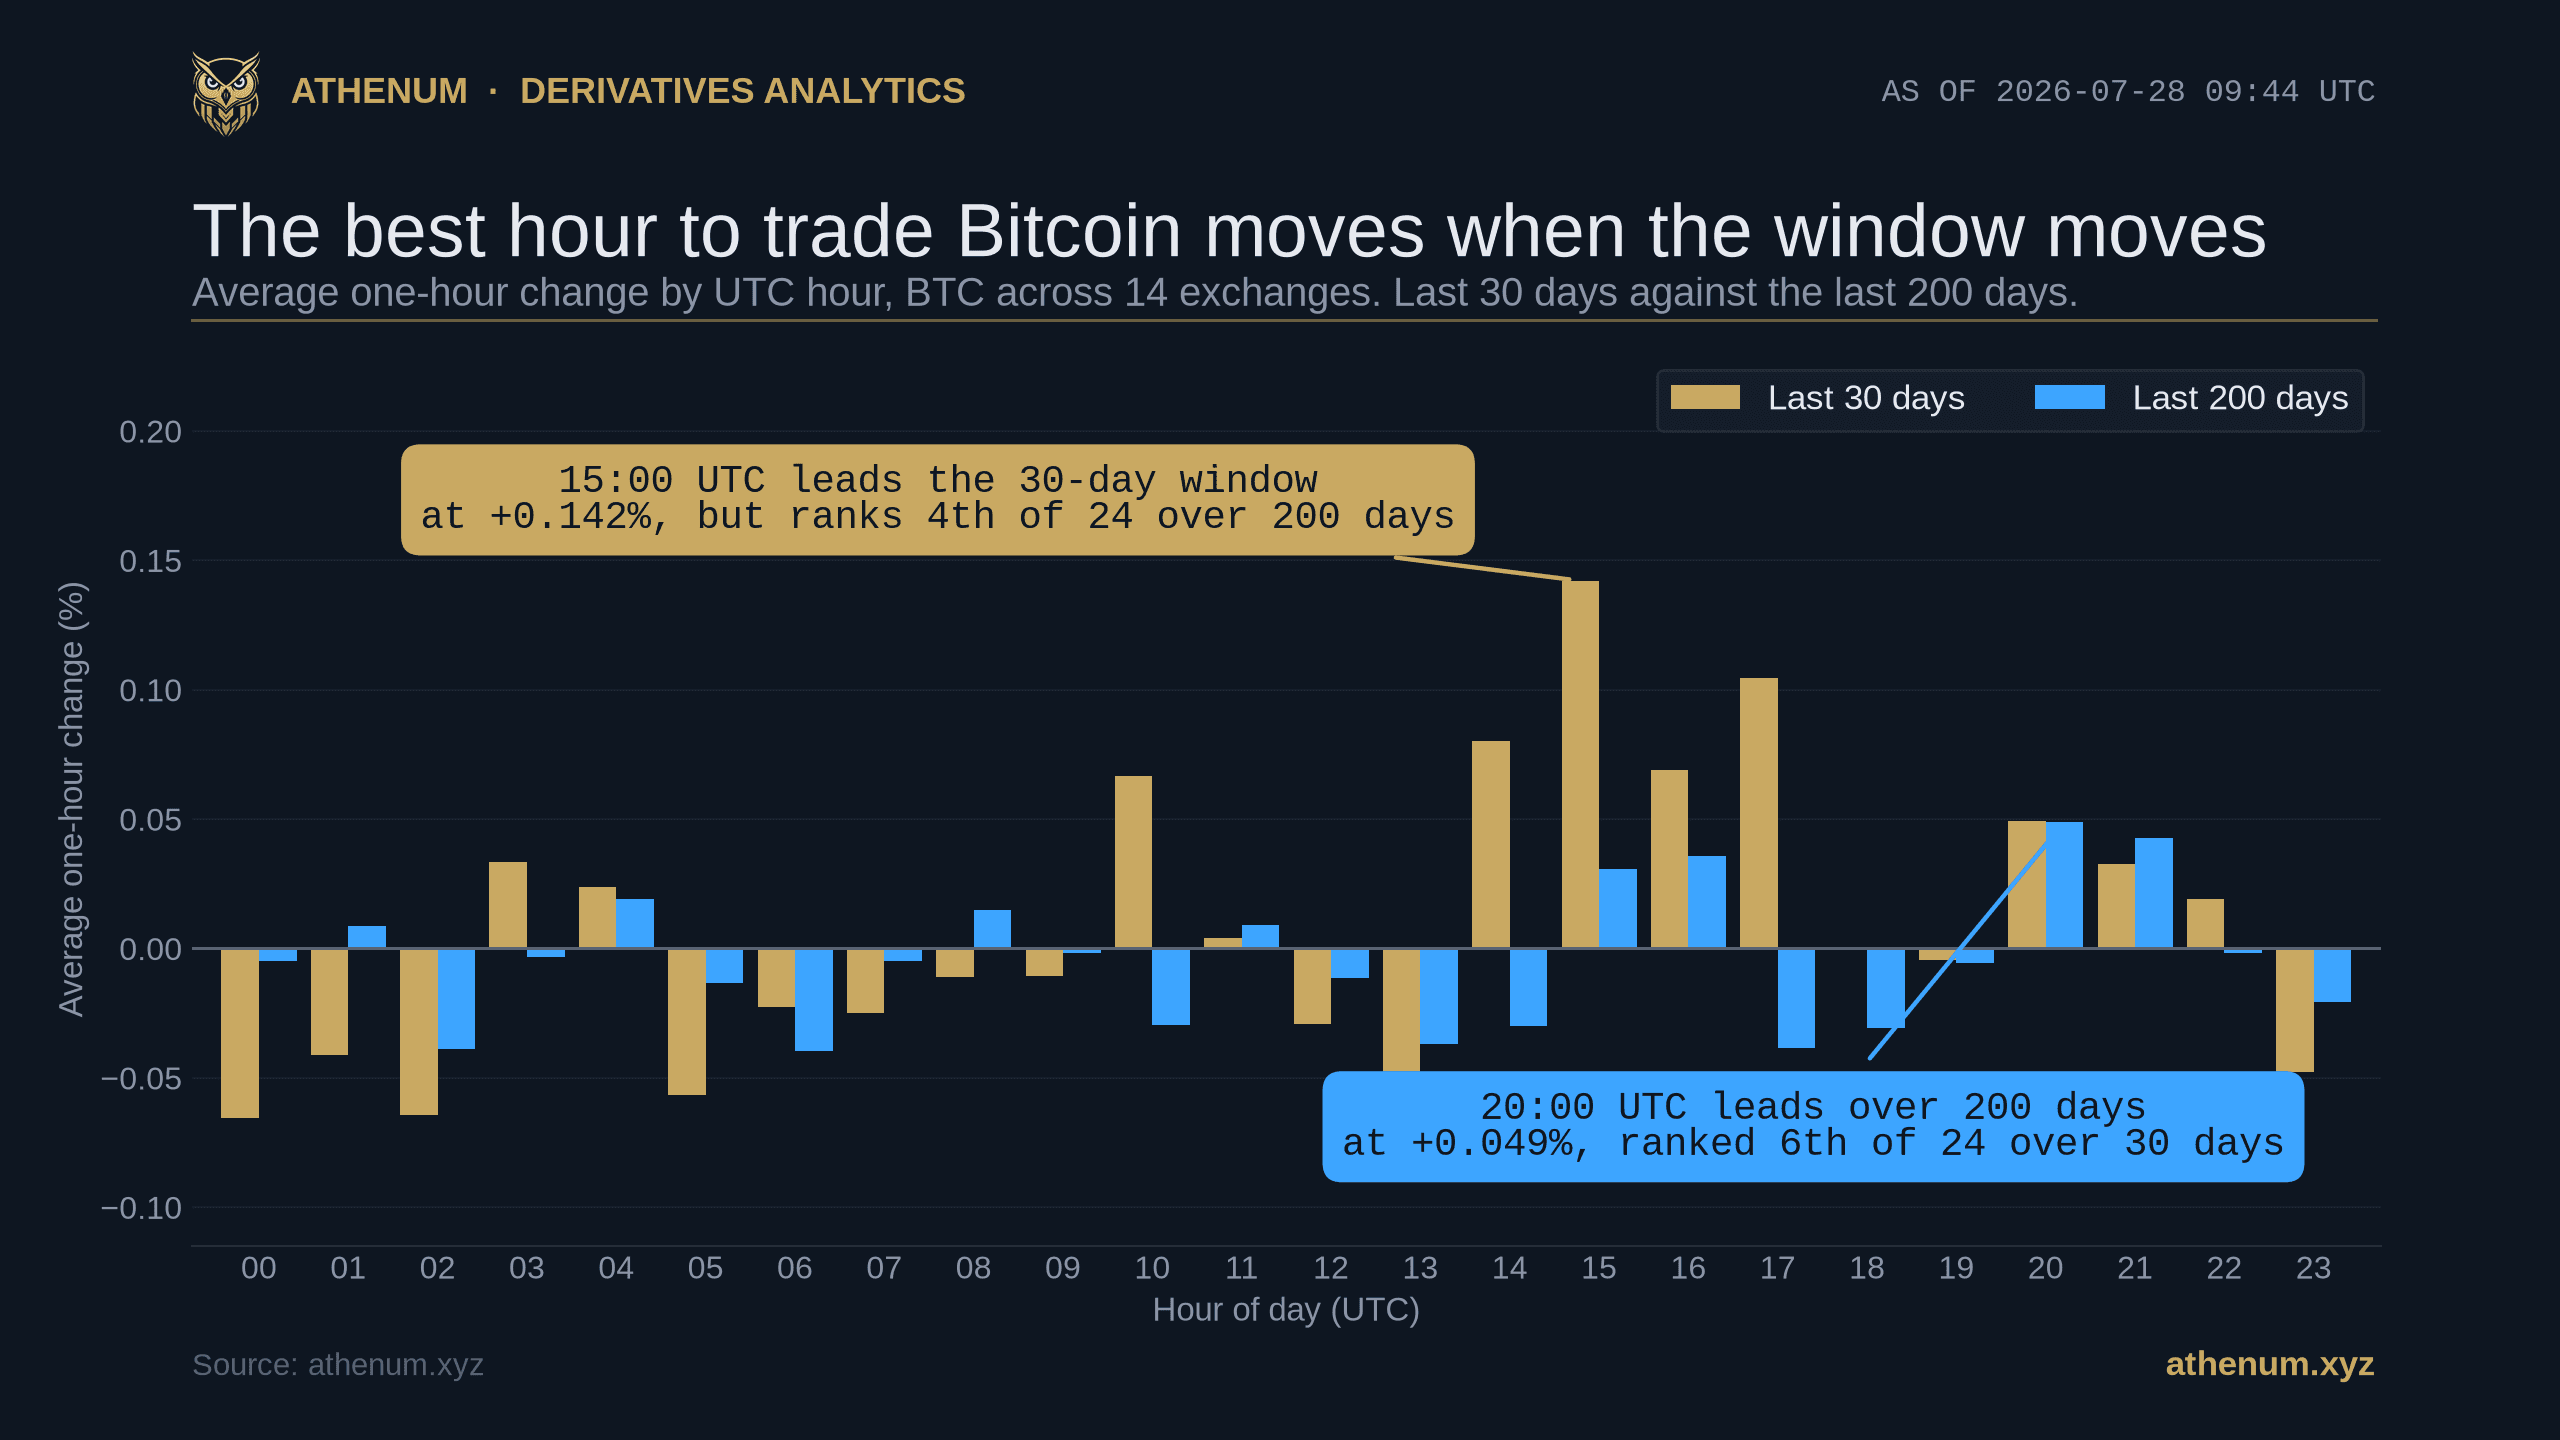
Crypto Trading Hours: Which UTC Hours Move Bitcoin, and Which Are Noise
Every crypto hour-of-day chart has a best hour. Change the window and it changes too. Here is Bitcoin's UTC clock measured two ways, and the sample-size test that says which part of it you can trade on.
Athenum Analytics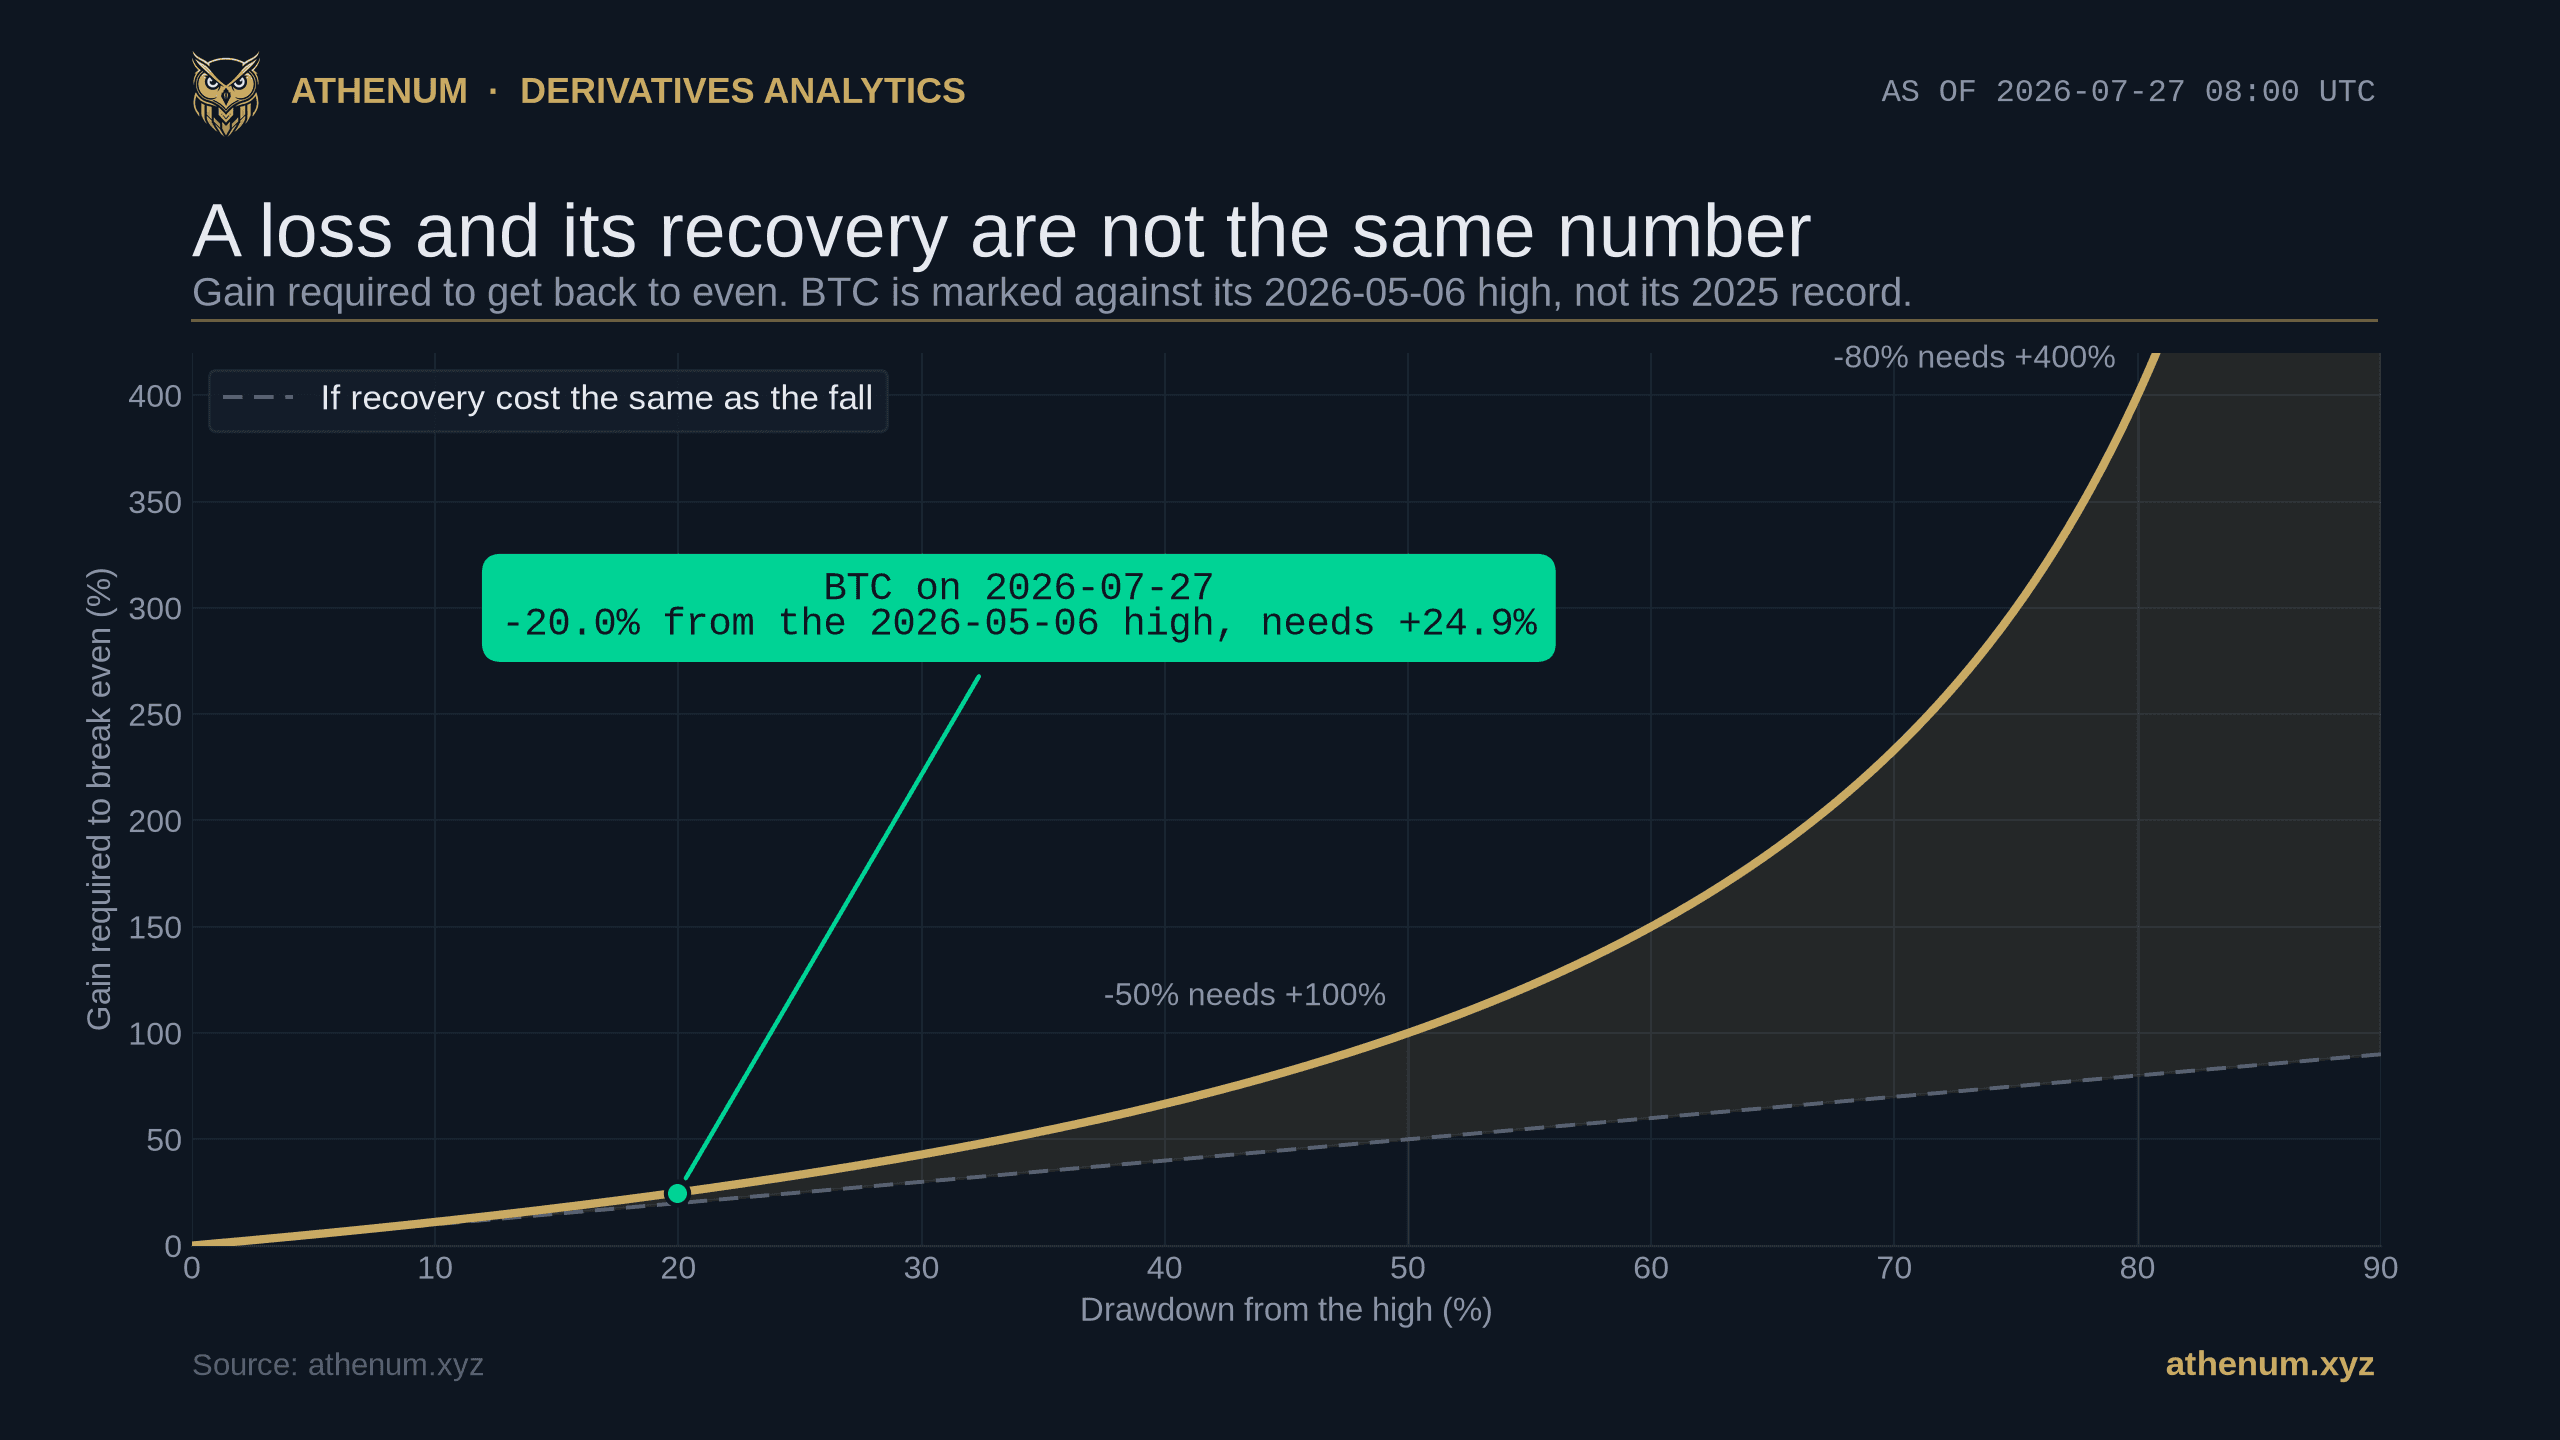
Crypto Drawdown Math: Why a 50% Loss Needs a 100% Gain to Break Even
Recovering a drawdown always costs more than the drawdown itself, and leverage widens the gap until liquidation ends it. Here is the recovery math, measured against Bitcoin's own live drawdown.
Athenum Analytics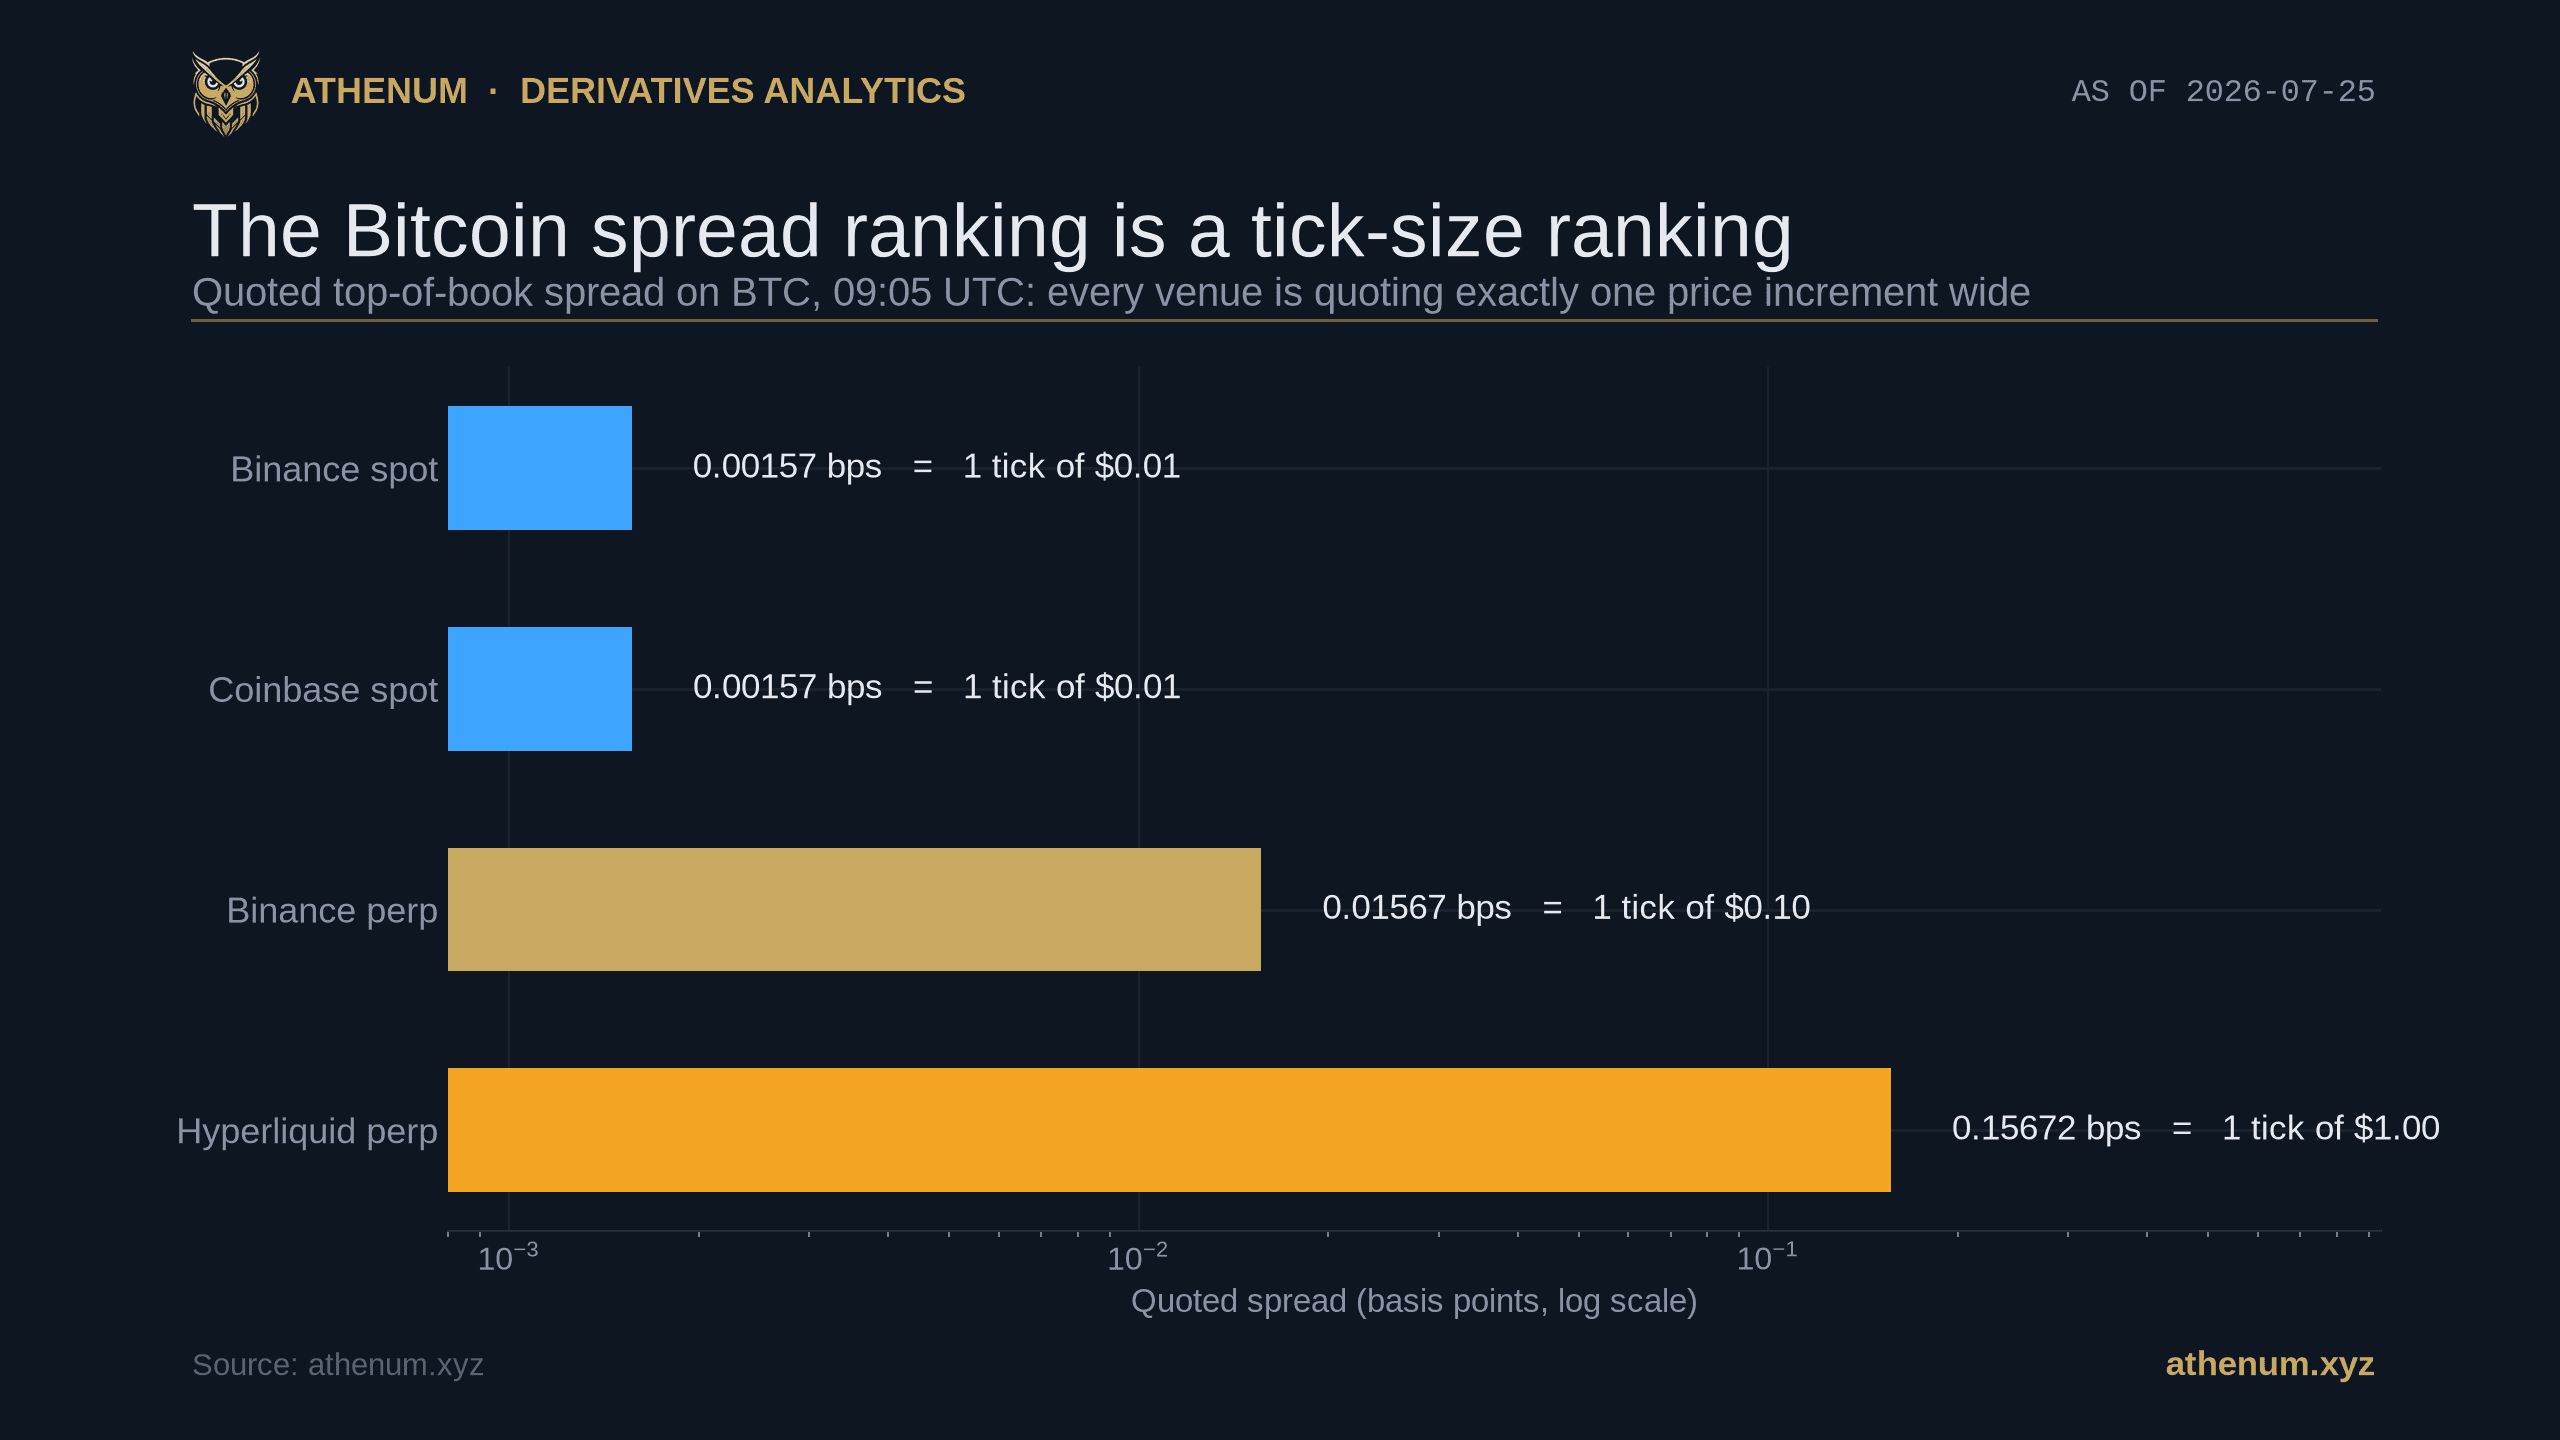
Crypto Bid-Ask Spread: Why the Tightest Quote Is Just the Smallest Tick
The quoted spread on a liquid crypto book is almost always exactly one tick wide, which makes a cross-venue spread ranking a tick-size ranking. Here is the live cross-venue evidence, and the two numbers to read instead.
Athenum Analytics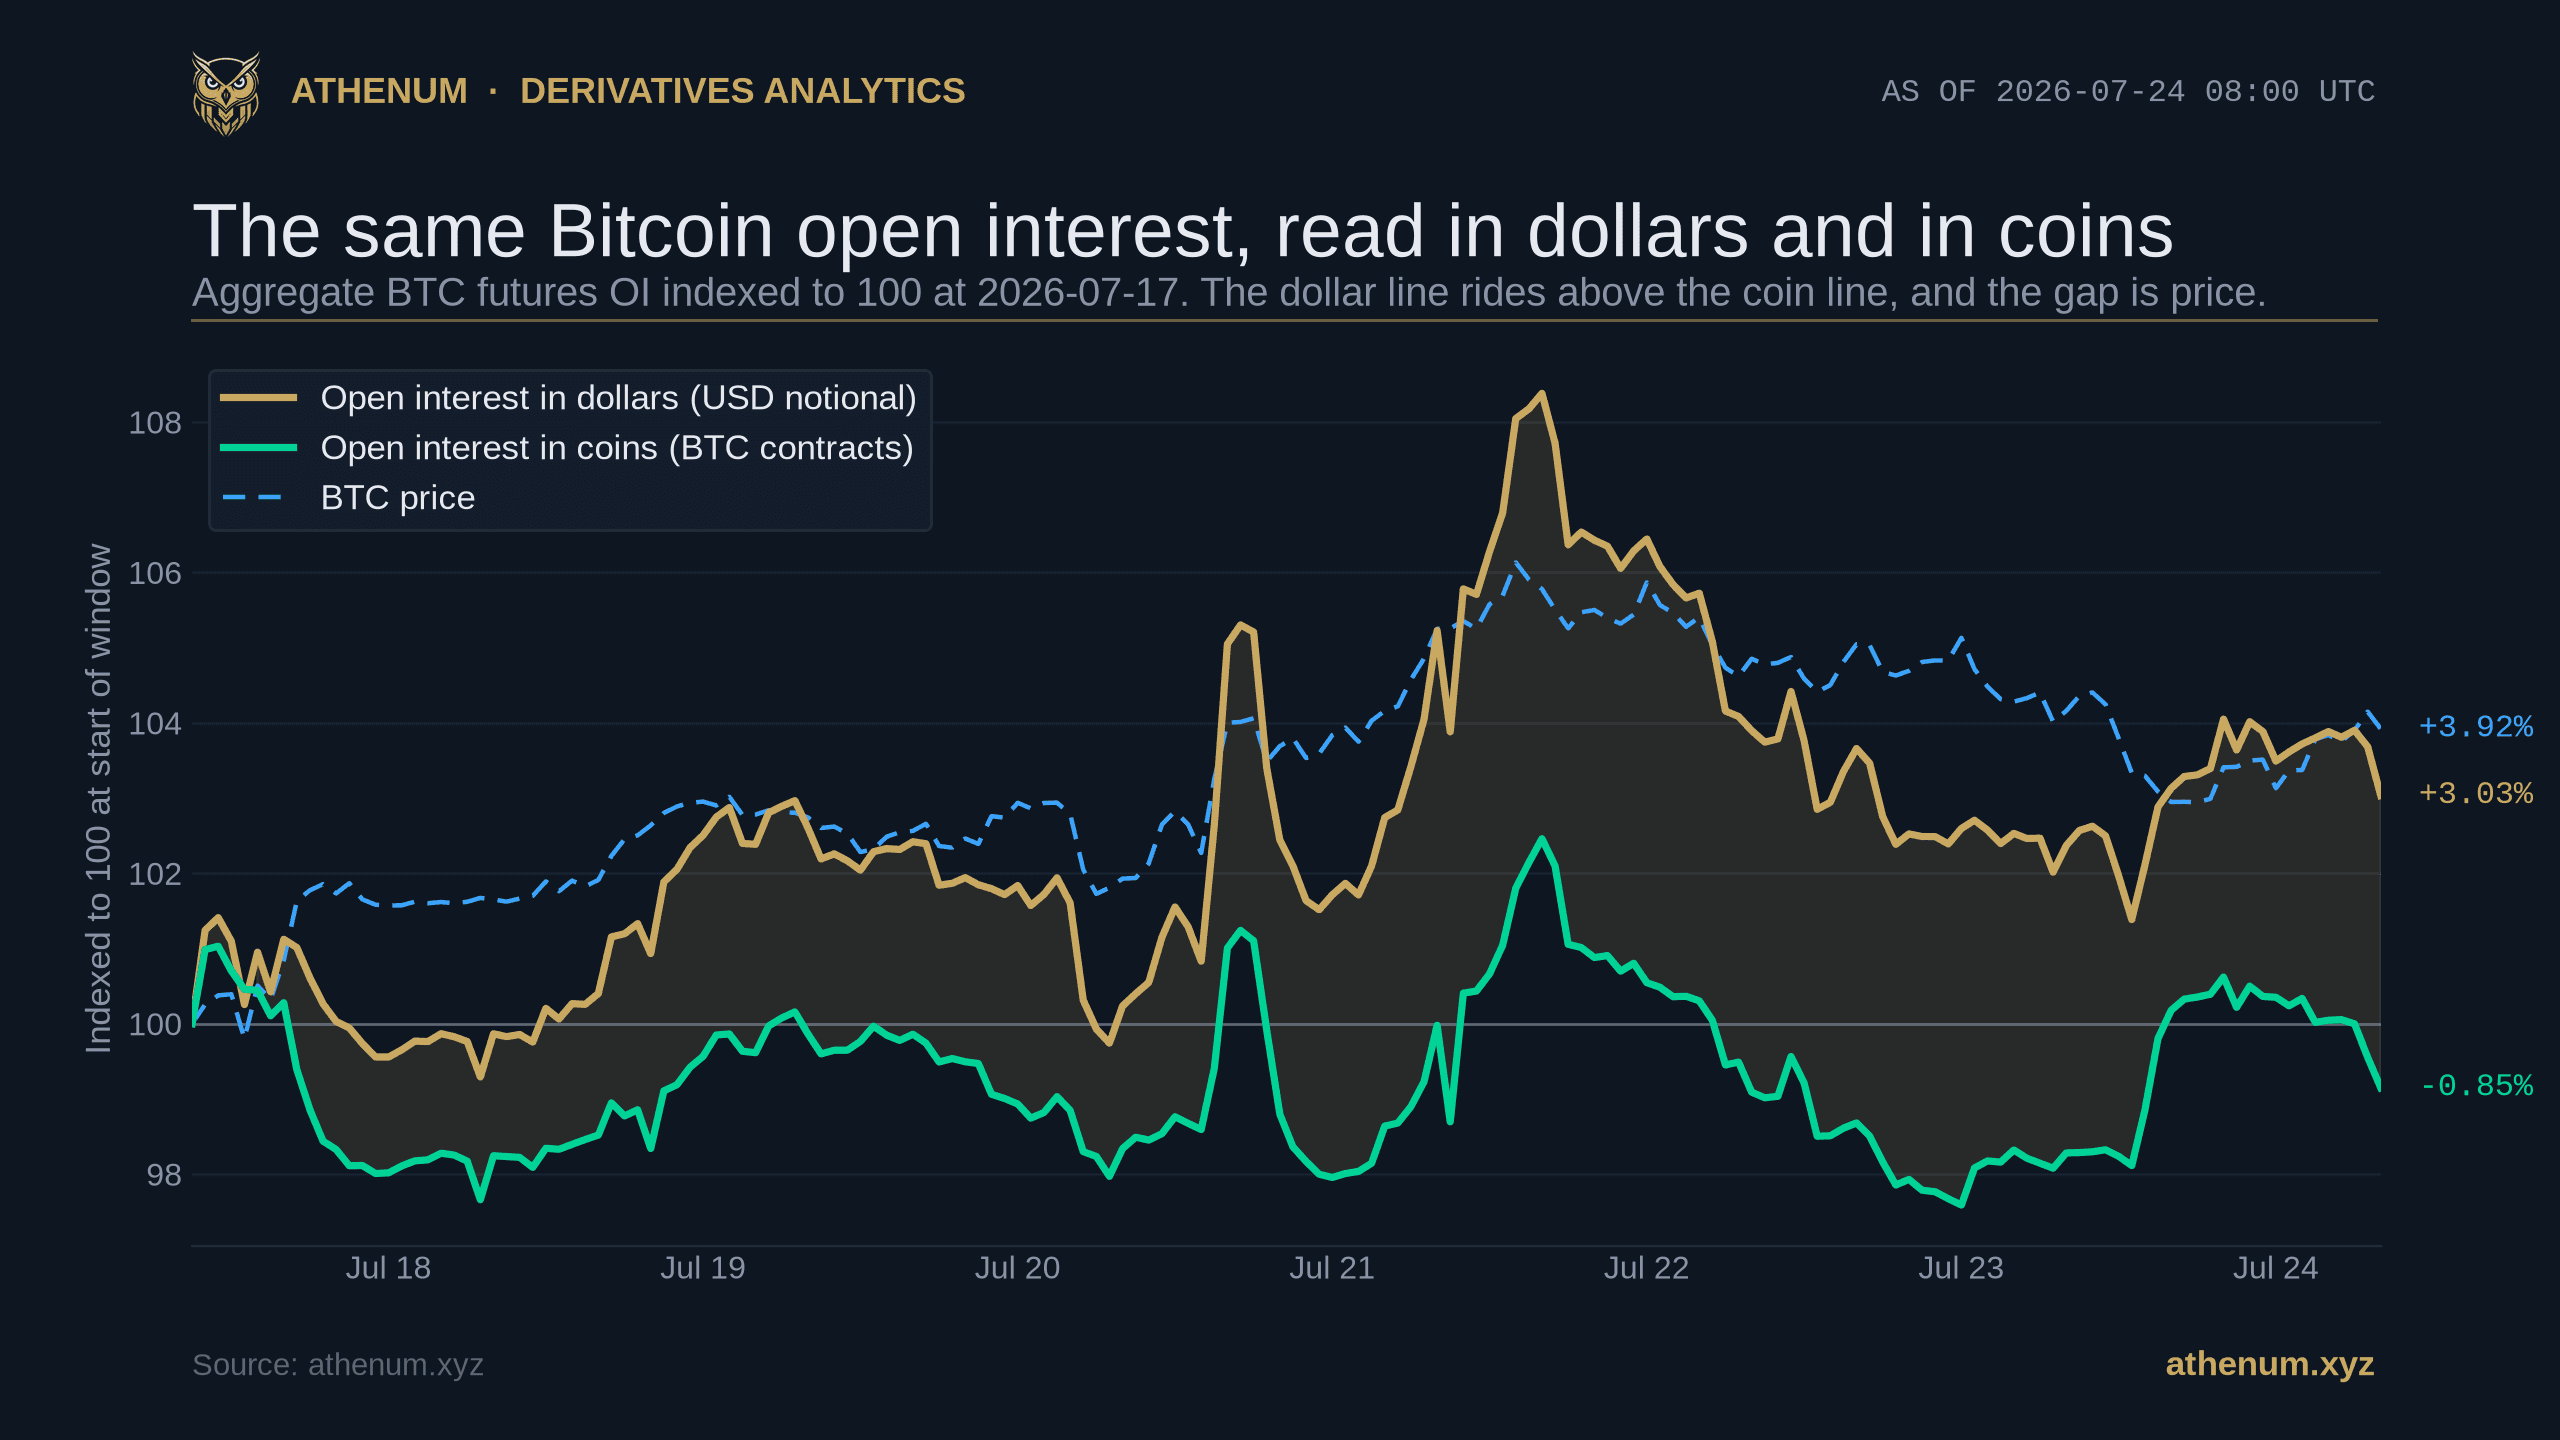
Open Interest in Coins vs Dollars: Why the Same Crypto OI Can Rise and Fall at Once
Crypto open interest is quoted two ways, in coins and in dollars, and the same OI can rise in one while it falls in the other. Here is why, worked on a live BTC reading, and which number to trust for what.
Athenum Analytics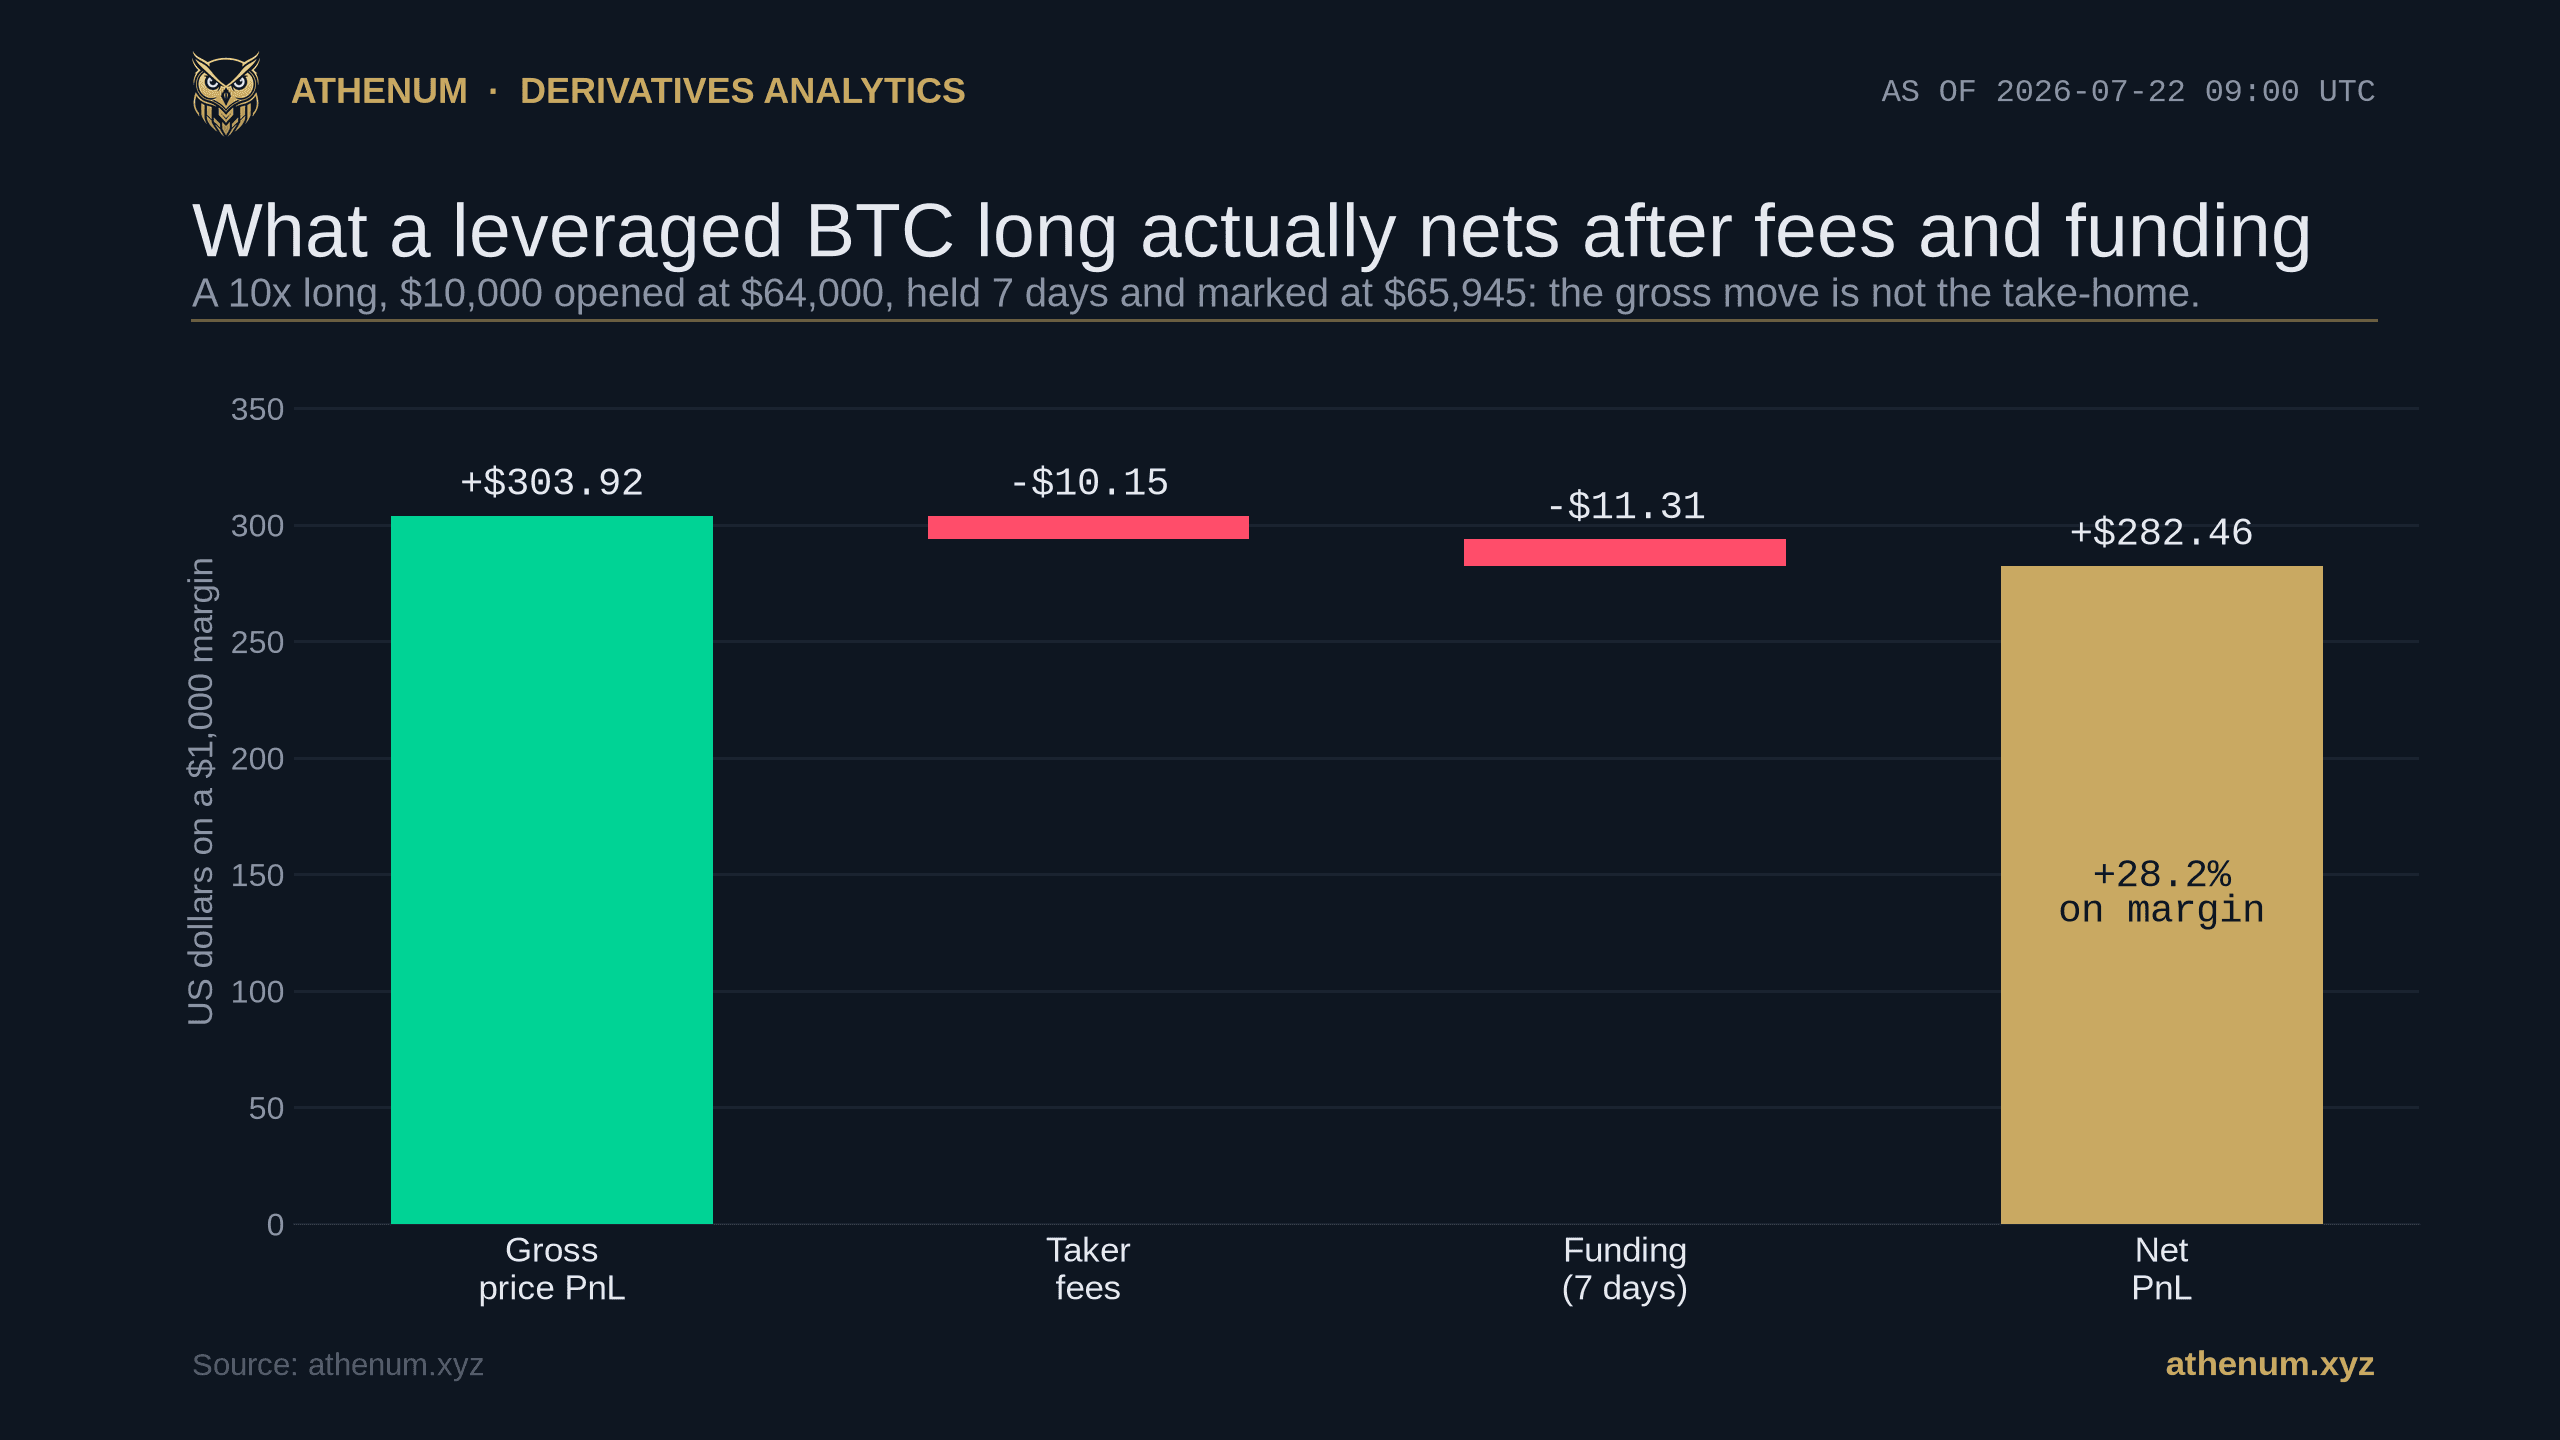
How to Calculate Crypto Futures PnL: Entry, Exit, Funding, and Fees
Your crypto futures PnL is four things, not one: direction and size, the price move, fees, and funding. Here is the full formula, worked on a live BTC long, and why funding quietly differs by exchange.
Athenum Analytics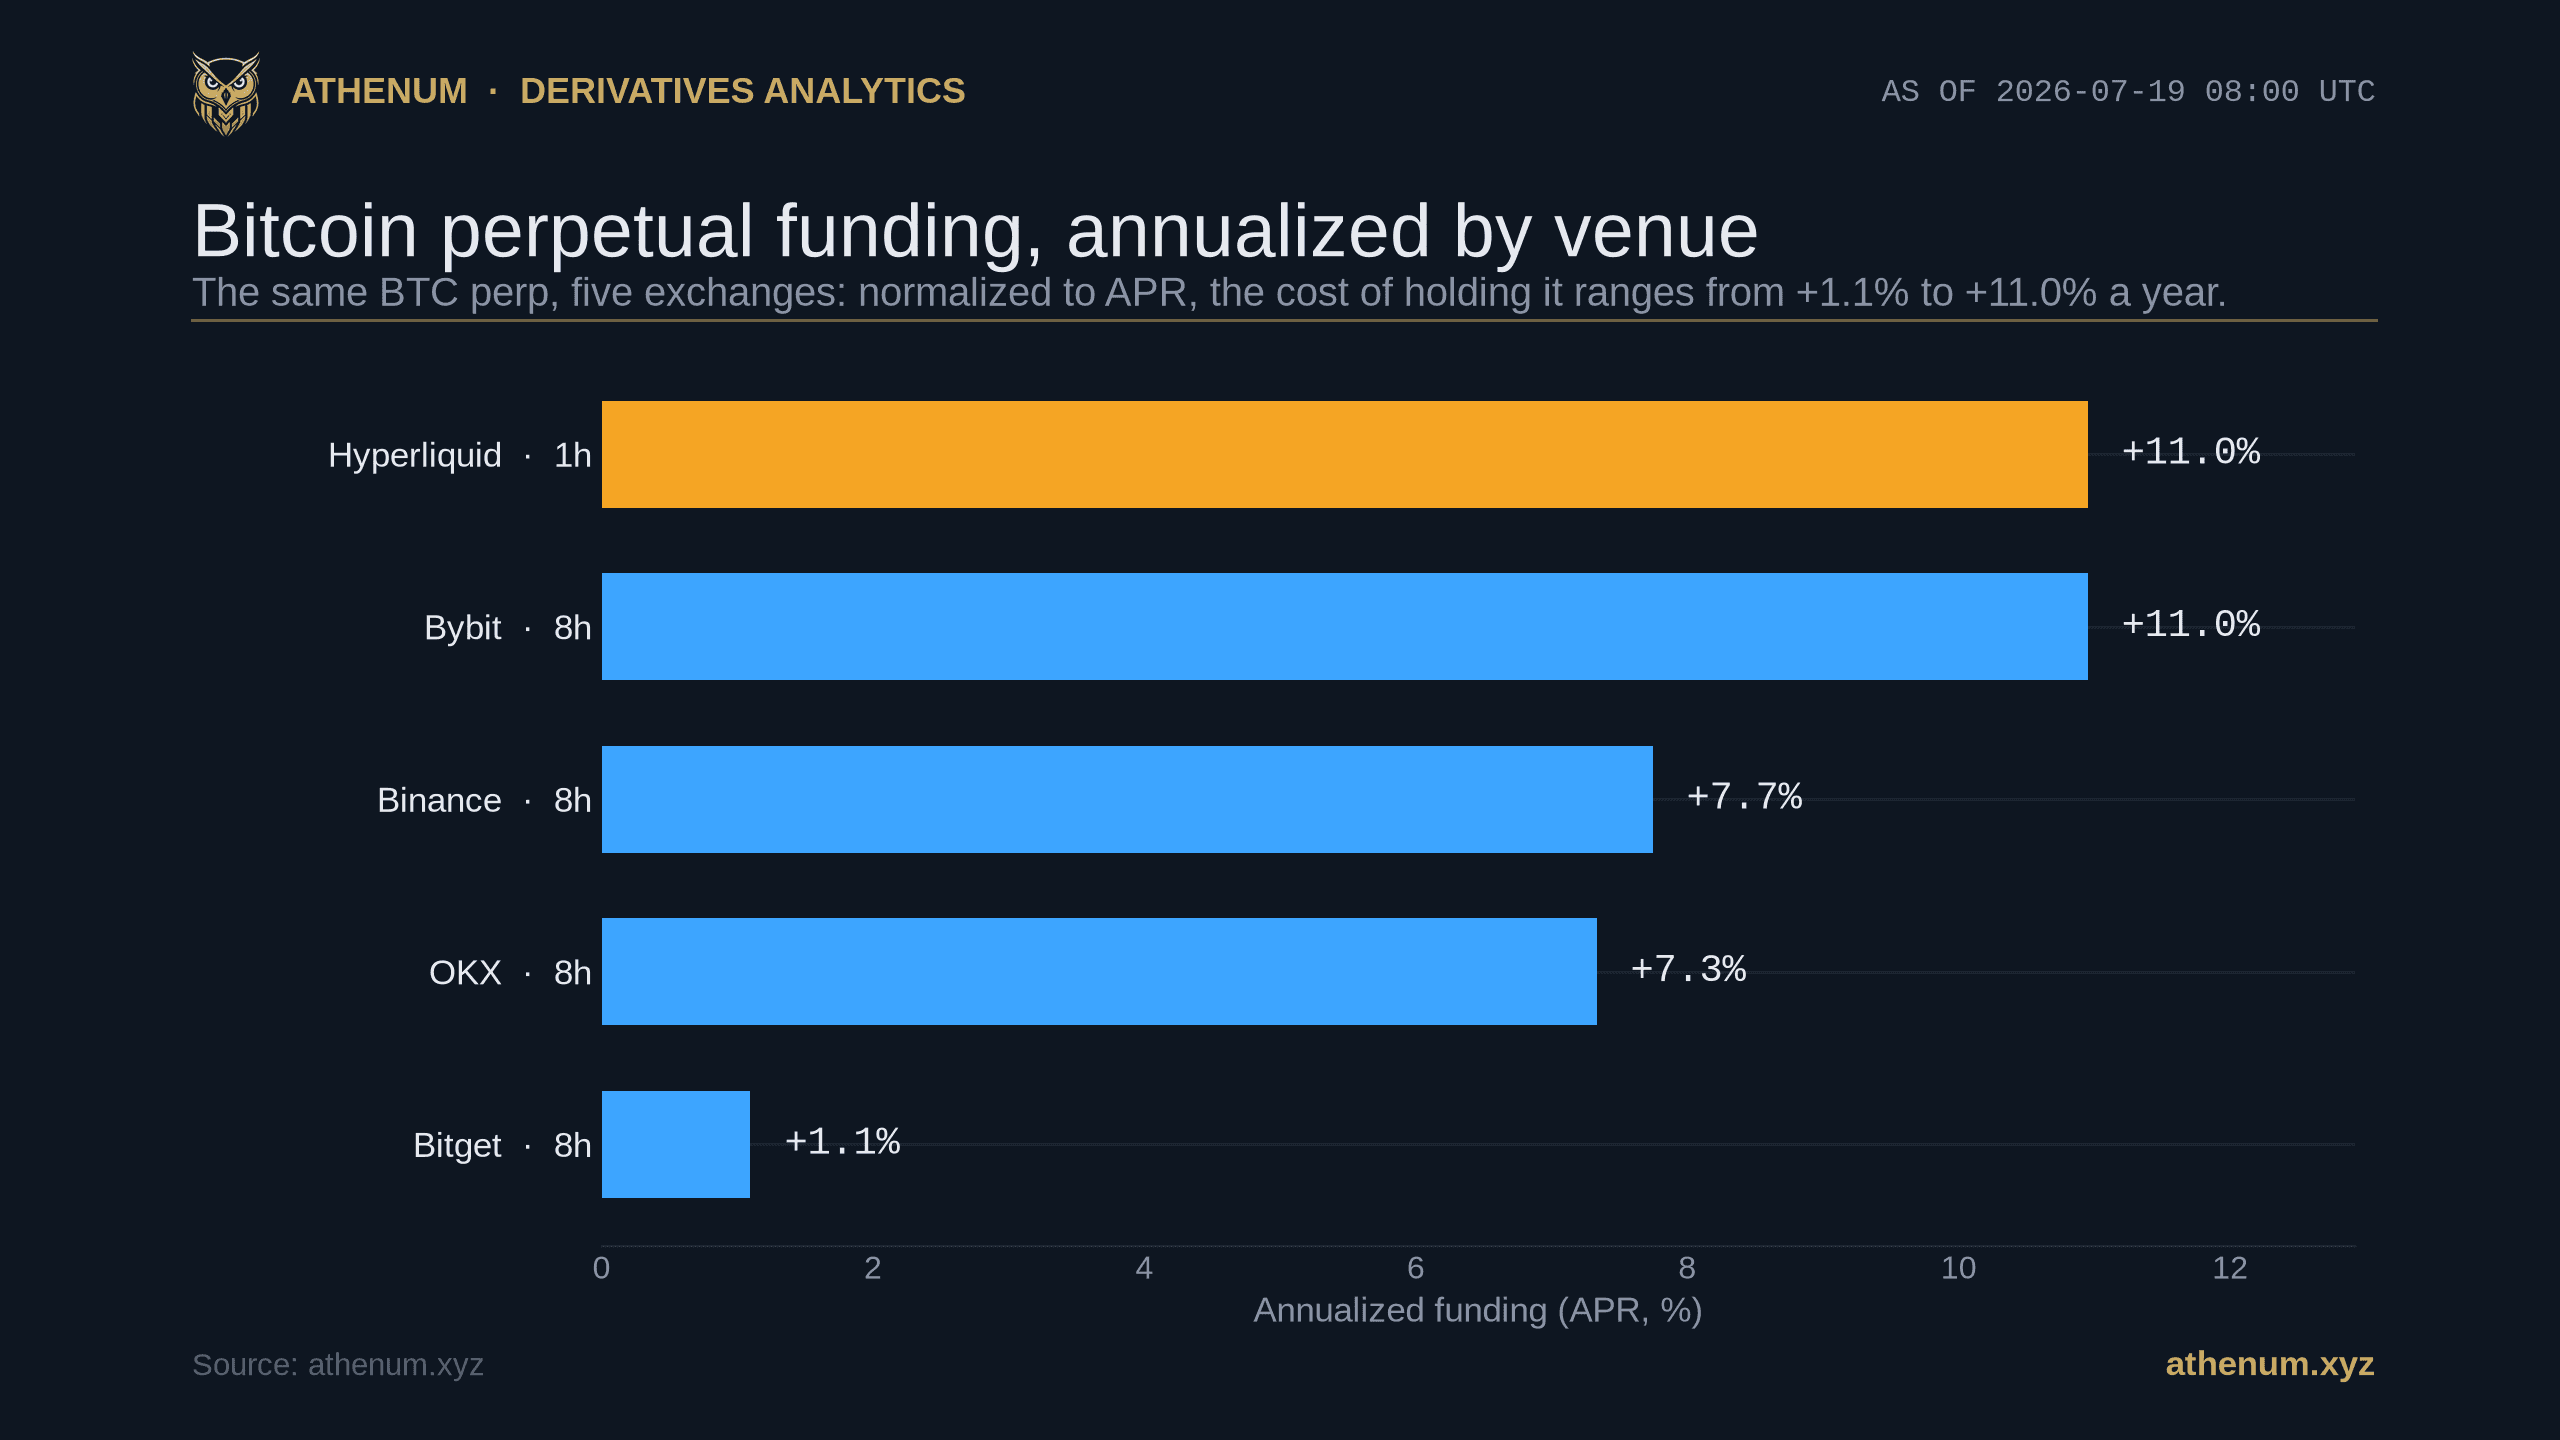
Funding Rate Intervals: Why the Same Crypto Perp Pays Differently on Each Exchange
Funding rate intervals differ by exchange: most crypto perps settle every 8 hours, some hourly. Normalize perp funding to APR to compare venues fairly.
Athenum Analytics