Table of Contents9 sections
- What is the funding number you see between settlements?
- Do these four venues share one settlement clock?
- Does an early read beat simply assuming nothing changed?
- How often does an early read carry the wrong sign?
- Where do the sign errors concentrate?
- Does the venue you use change the answer?
- How far off is the level, not just the sign?
- What did today's settlement actually look like?
- How do you check this yourself?
Practise with worked lessons
- Test a funding-settlement trade after all costs
Opening just before funding and closing just after looks easy. A 30 USDT receipt cannot cover 100 USDT of fees and slippage even before price moves.
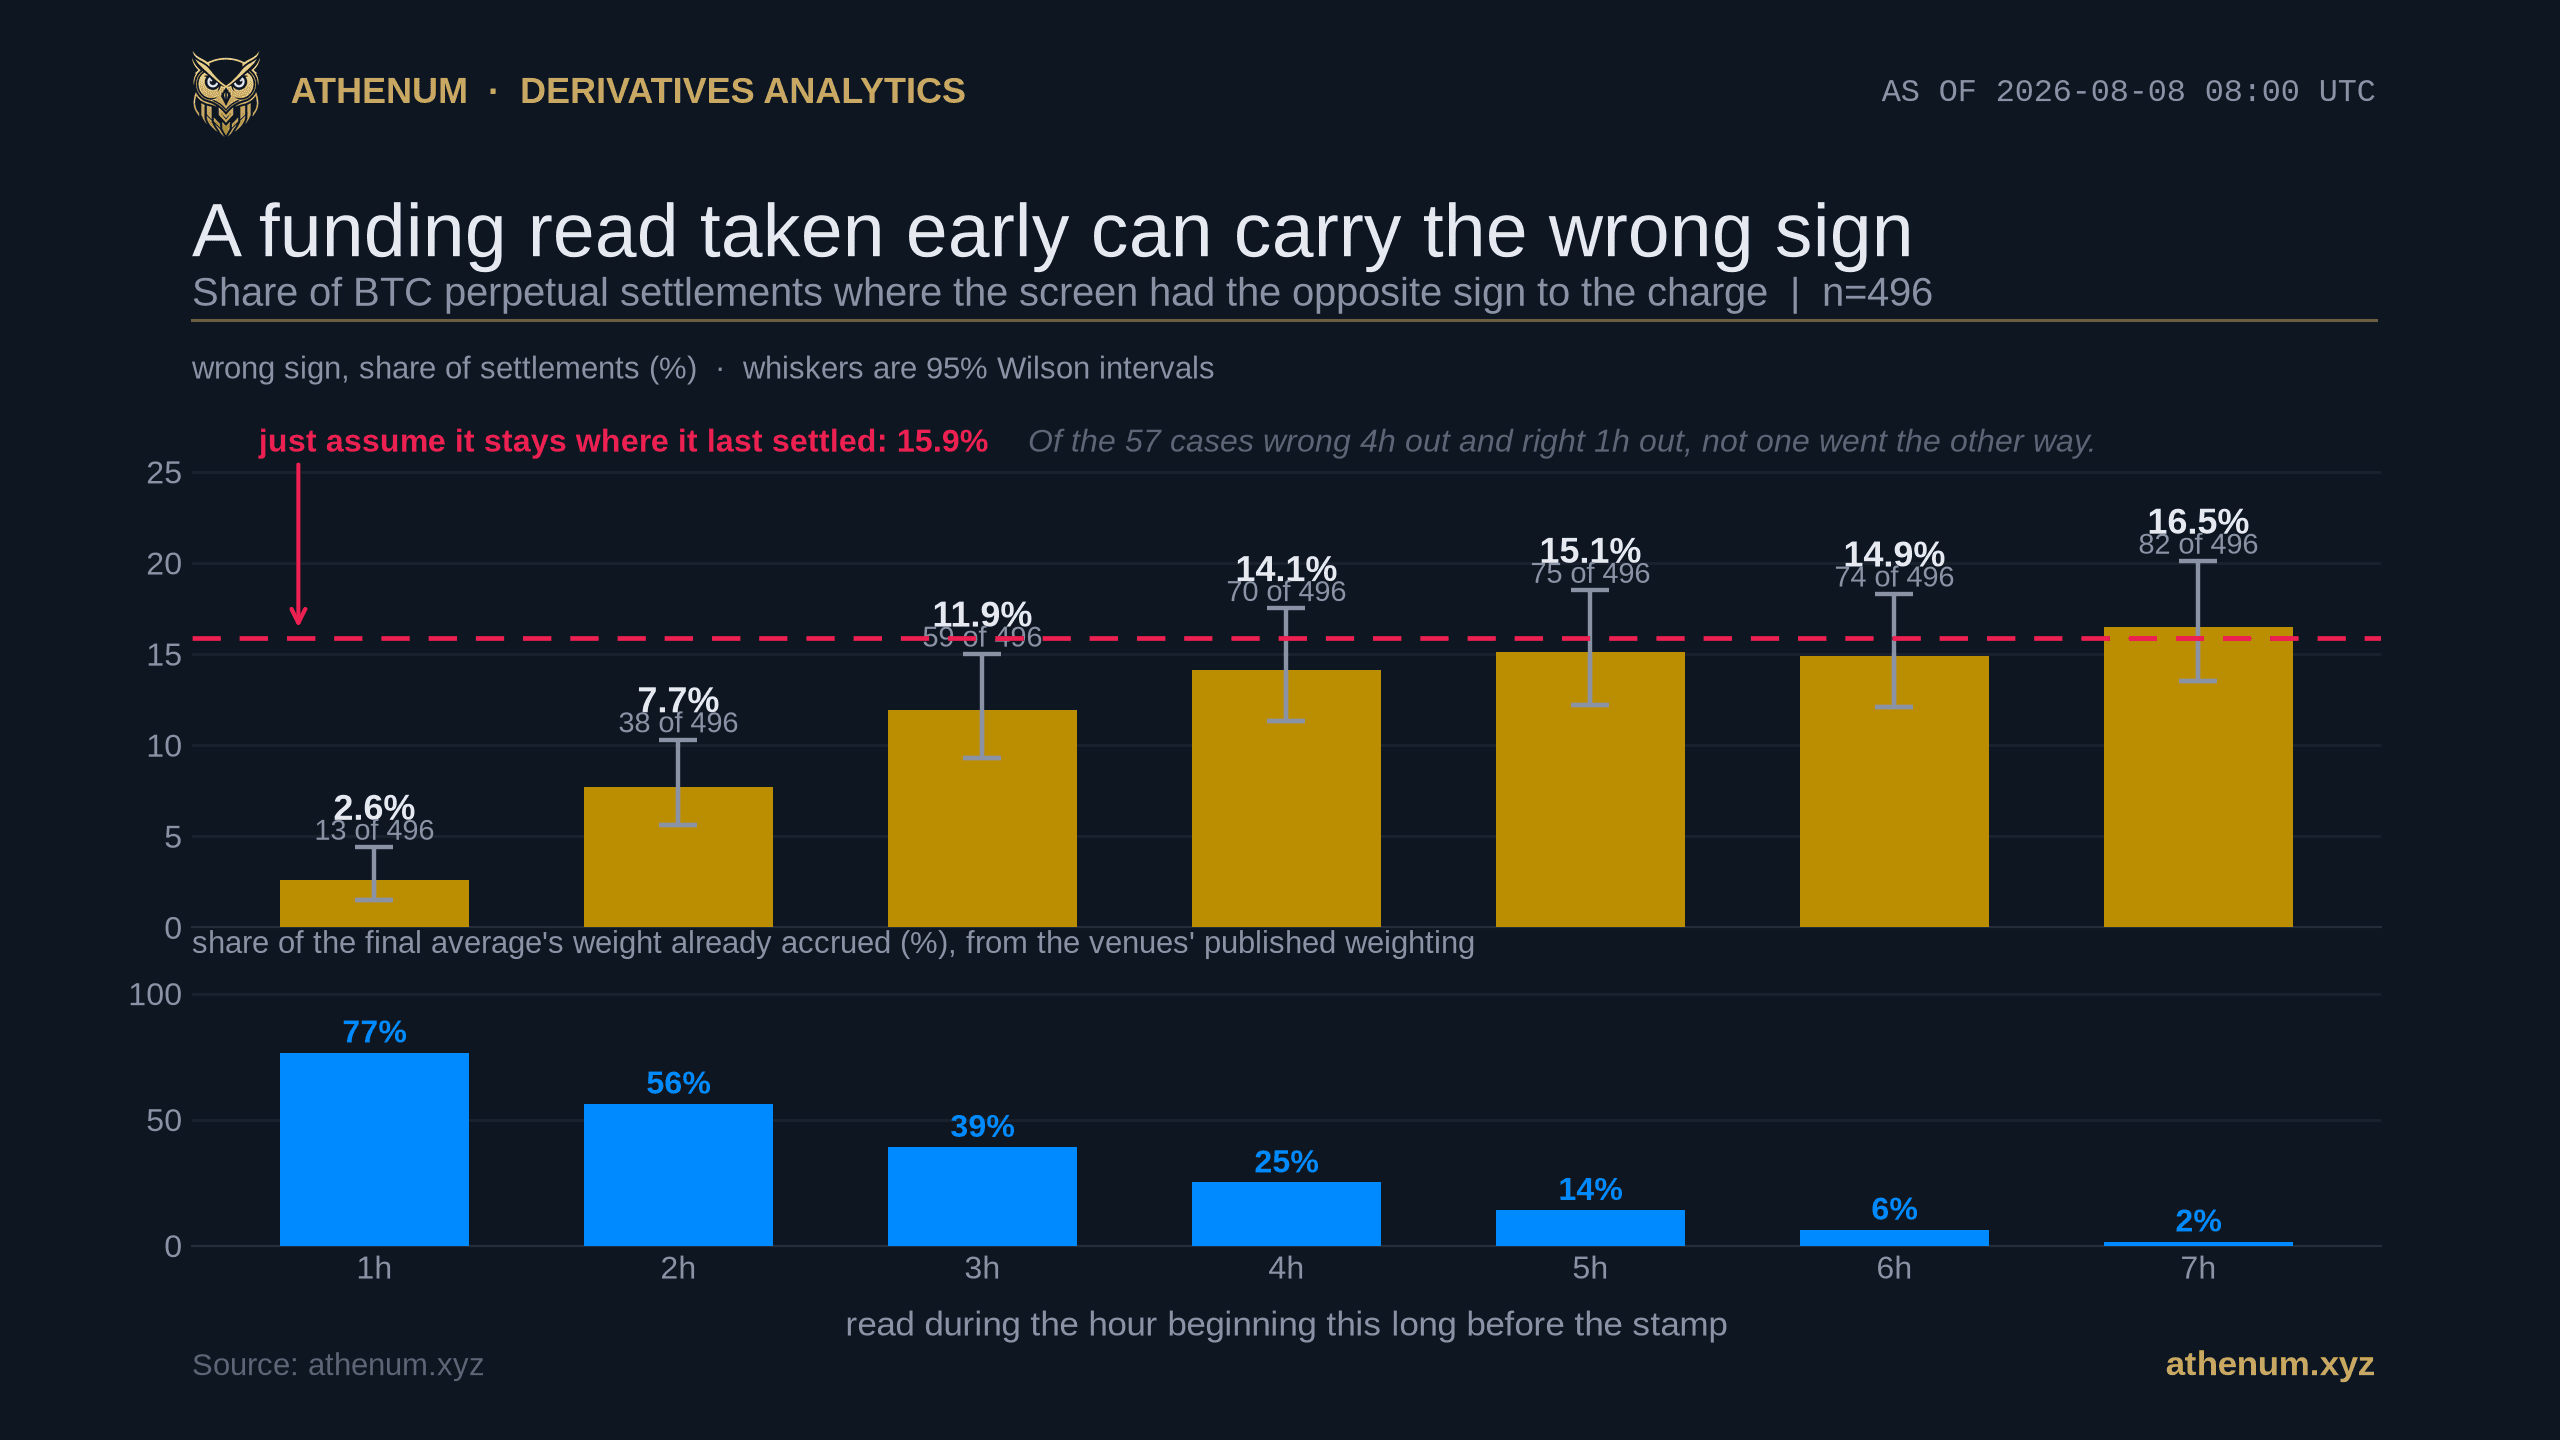
TLDR. The Bitcoin funding rate a venue shows you between settlements is a running average that keeps moving until the stamp, and read early it tells you almost nothing you did not already know. Measured across Binance, Bybit, OKX and Bitget over 496 venue-settlements between 2026-06-27 00:00 UTC and 2026-08-08 08:00 UTC, a read taken four hours out had the opposite sign to the rate that settled in 70 of 496 cases (14.1%). The benchmark that matters is not zero, it is the lazy alternative: simply assuming the rate stays where it last settled was wrong 79 of 496 times (15.9%), and the four hour read did not beat it (p = 0.33). The screen only separates from that rule inside three hours, and the margin grows fast: 43 against 23 at three hours (p = 0.019), 55 against 14 at two, 71 against 5 at one. The reason is in the venues' own published formula, where premium samples count for more the closer they land to the stamp, so at the start of the four hour window only 25% of the final number's weight has accrued. The errors are also not spread evenly. They sit almost entirely in settlements that land near zero, where a read is not a signal until it settles.
What is the funding number you see between settlements?
It is a running average aimed at the next stamp, not the rate you were last charged, and two requests twenty seven minutes apart are enough to watch it move. Read anonymously on 2026-08-08 at 08:37 UTC and again at 09:04 UTC, both inside the interval that settles at 16:00 UTC, every one of the four had moved: Binance from +0.006616% to +0.006820%, OKX from +0.004511% to +0.004951%, Bybit from +0.010000% down to +0.008352%, and Bitget from +0.000100% clean through zero to -0.000200%. Now set those eight readings against what the same venues had actually charged at the 08:00 stamp that morning, which was +0.00542% on Binance, +0.00356% on OKX, +0.00389% on Bybit and -0.00010% on Bitget. Not one of the eight equalled its venue's settled rate, and on Bitget the number a reader would have quoted flipped sign inside half an hour.
Two of the four say so in their own documentation, which is worth quoting because it means this post describes documented behaviour rather than alleging anything. OKX's REST API reference calls the field a predicted rate for the upcoming settlement period, says in as many words that it is a forecast and that the final settled rate may differ, and exposes the value that actually settled as a separate field on the same endpoint, settFundingRate, alongside a settState flag; the history endpoint carries the same settled value under a third name, realizedRate. Its WebSocket channel labels the same field a current rate, so the venue is not consistent with itself, but the REST reference is the one that documents the distinction. Bybit's help centre says the funding rate traders see fluctuates in real time until the funding timestamp, that it is not fixed, and that it is updated every minute. Binance's field is named lastFundingRate, which reads like the opposite, and the reading above is what settles the ambiguity: it did not equal the 08:00 UTC settlement.
Scope this to the venues measured, because the convention is not universal. BitMEX documents the opposite arrangement, taking the premium index value at the end of the PREVIOUS eight hour window, which means the upcoming payment is settled before the period it applies to even begins. BitMEX still averages, so what is reversed is the lag rather than the averaging. The theoretical literature on perpetuals generally assumes that design too, treating the funding payment as known at the start of the period. That is precisely why the question is worth measuring on the venues people actually trade rather than assuming.
The mechanism itself is not new and we have published it before. The premium component is sampled repeatedly and averaged across the interval, so the number reflects a window of samples rather than the current instant, as the Athenum explainer on how the premium index keeps a perpetual tethered to spot sets out, and the Athenum walkthrough of the funding formula itself takes the arithmetic apart. What follows is not that mechanism restated. It is a measurement of what it costs a reader who acts early.
Do these four venues share one settlement clock?
For the Bitcoin perpetual, on the day measured, yes, and each venue says so on its own public endpoint. Every field below was read anonymously on 2026-08-08, and they agree on an eight hour interval with stamps at 00:00, 08:00 and 16:00 UTC. That matters because a lead time is only comparable across venues that settle on the same clock, and it is the first thing to confirm before putting any two funding numbers side by side.
Venue | Endpoint field | Interval it reports |
|---|---|---|
Binance | fundingInfo returns fundingIntervalHours | 8 hours |
Bybit | instruments-info returns fundingInterval | 480 minutes, which is 8 hours |
OKX | funding-rate returns fundingTime and nextFundingTime | 28,800,000 ms apart, which is 8 hours |
Bitget | funding-time returns ratePeriod | 8 hours |
Hyperliquid | predictedFundings carries a fundingIntervalHours field | 1 hour |
Three qualifications on that table. It is the Bitcoin perpetual on each venue and not every contract they list, several of which run four hour and one hour intervals. The word the venues use is default, so eight hours is the normal case rather than a guarantee: OKX and Bybit both document an automatic switch to more frequent settlement when the rate reaches its cap or floor, OKX stepping down one level at a time through four hours and two hours to one, Bybit switching straight to hourly. And Hyperliquid is the useful control in that table because its payload also carries other venues' intervals, returning one hour for itself and eight hours for both Binance and Bybit in a single response, so the clock is attested by a third party rather than only by each venue about itself. One caveat on that row: the interval field is present in the live response but does not appear in Hyperliquid's published documentation, so treat it as a runtime observation rather than a documented contract, and read every interval off the API rather than assuming it is fixed.
Hyperliquid is then excluded from the study, for a mechanical reason: every lead tested here, from one hour to seven, equals or exceeds its entire funding interval, so "four hours before settlement" is not a question that can be asked on a one hour clock. Deribit is excluded for the reason an earlier Athenum post on perpetual costs already gave, that its funding updates continuously rather than on a fixed clock. We have also already covered the separate point that raw quoted numbers are not comparable across different clocks, and the Athenum guide to funding rate intervals makes that case. This post sharpens that guide rather than restating it: the rate does not only change at the stamp, it drifts the whole way there, which means a mid-interval read of the kind that guide tabulates is not yet the rate anyone will be charged.
Does an early read beat simply assuming nothing changed?
Only inside three hours, meaning the three hour read and later, and that is the finding. A bare wrong-sign percentage is a weak result on its own, because the honest comparison is not against a coin flip, it is against the laziest rule available: ignore the screen entirely and assume the rate will settle where it last settled. Over these same 496 settlements that rule was wrong 79 times, or 15.9%. Every reading from four hours out and earlier sits statistically on top of it.

Only the settlements where the screen and the previous-settlement rule disagree, so agreements cannot pad either side. Inside three hours the screen wins the disagreements decisively. At four hours out and earlier the two are statistically tied, and by seven hours the rule is nominally ahead, 22 against 19.
Tested pairwise on the same settlements, the split is clean. In the final hour the screen was right and the rule wrong 71 times, against 5 the other way, an exact two-sided sign test at p below 0.001. At two hours it is 55 against 14, again below 0.001. At three hours it is 43 against 23, p = 0.019, which still separates. At four hours it is 38 against 29, p = 0.33, which does not. At seven hours the rule is nominally ahead, 22 against 19.
Reading later is what helps, and the direction is one-sided. Of the settlements that were wrong four hours out and right in the final hour, there were 57. Going the other way, right at four hours and wrong at one, there were none at all. A paired test on that comparison returns p below 0.001. In this window there was no case in which waiting cost you the sign.
How often does an early read carry the wrong sign?
In 70 of 496 settlements four hours out, and in 13 of 496 read in the final hour. The panel is four venues watched at the same 124 settlement stamps, restricted to stamps that carry a usable reading at every lead from one to seven hours and a previous settlement to compare against, so every row below has the same denominator of 496.
Read taken | Weight accrued | Wrong sign | Share | 95% interval | Beat the lazy rule? |
|---|---|---|---|---|---|
in the final hour | 77% | 13 of 496 | 2.6% | 1.5% to 4.4% | Yes, p < 0.001 |
2 hours before | 56% | 38 of 496 | 7.7% | 5.6% to 10.3% | Yes, p < 0.001 |
3 hours before | 39% | 59 of 496 | 11.9% | 9.3% to 15.0% | Yes, p = 0.019 |
4 hours before | 25% | 70 of 496 | 14.1% | 11.3% to 17.5% | No, p = 0.33 |
5 hours before | 14% | 75 of 496 | 15.1% | 12.2% to 18.5% | No, p = 0.69 |
6 hours before | 6% | 74 of 496 | 14.9% | 12.1% to 18.3% | No, p = 0.58 |
7 hours before | 2% | 82 of 496 | 16.5% | 13.5% to 20.1% | No, p = 0.76 |
The weight column is computed rather than measured, and it comes from the venues' own published formula. All four publish, for the eight hour contract measured here, a time-weighted average premium index in which samples nearer the stamp count for more, and all four publish the coefficients outright: the first sample counts once, the second twice, and the last counts n times. The scope matters: Binance applies that weighting only to intervals longer than an hour and uses a plain unweighted average on its one hour symbols, so the column below is a statement about eight hour contracts and not about funding in general. The sample counts are not the same: Binance and Bitget average 5,760 samples taken every five seconds, while Bybit and OKX average 480 taken every minute. That difference turns out not to matter here, because the share of the final number already fixed is the sum of the weights so far divided by the total, and for a linear weighting that is very nearly the square of the fraction of the interval elapsed. Half way through, a quarter of the number is written: 25.05% on 480 samples and 25.00% on 5,760, identical to the whole percent. Seven hours out it is under 2%. A number three quarters of which has not yet been written is not a forecast anyone should act on, and the measured error tracks that curve closely.
Two honest limits on those 496. They are four venues watched at the same 124 stamps, not 496 independent draws. At the four hour lead the flips fell across the stamps as 73 with none, 34 with one venue, 16 with two, none with three, and 1 where all four flipped together, and that last case is essentially impossible under independence, so the intervals above are optimistic rather than conservative. And the hourly series carries two gaps inside the window: six hourly readings missing on 2026-07-01 for three of the four venues and seven for Bitget, whose gap opens an hour earlier, and twenty one missing across a twenty two hour break from 2026-07-31 03:00 UTC to 2026-08-01 01:00 UTC. Those cost four settlement stamps between them. A fifth is lost at the very start of the feed, whose earliest hourly bar is 2026-06-26 14:00 UTC, so the stamp at 16:00 that day has no seven hours of history behind it. That is why 129 stamps fall inside the feed's range and 124 survive into the panel.
Where do the sign errors concentrate?
Almost entirely in the settlements that end up near zero, and this is the single most useful thing in the post. Split the same 496 at the median absolute settled rate, 0.0048% per eight hours, and the halves behave nothing alike. In the larger half the sign was right in all 248 cases read in the final hour and all 248 read at two hours. In the smaller half it was wrong 13 times at one hour and 65 times at four.

The same 496 settlements split at the median settled magnitude. In the larger half the sign was right in all 248 cases at one hour and all 248 at two hours. By seven hours even the larger half was wrong 13 times, so this is a gradient rather than a guarantee.
At the four hour lead that is 26.2% against 2.0%, separated at an exact two-sided p below 0.001. The gap holds at every lead tested, and it is still there in the final hour, where 13 of 248 against 0 of 248 gives p = 0.0002.
That is the rule worth taking away, and it is more useful than the headline that produced it. A funding read far from zero can be acted on hours early; a read near zero is not a signal until it settles. Note which way the caveat cuts. It makes the number less alarming, not more, because the settlements where the early read misleads you are also the ones where being wrong costs least.
Does the venue you use change the answer?
In the raw counts yes, and the honest answer takes two steps rather than one. At the four hour lead the counts are Binance 9 of 124, OKX 15 of 124, Bybit 23 of 124 and Bitget 23 of 124. Binance separates from both Bybit and Bitget at an exact Fisher p of 0.013. Overlapping confidence intervals are not a test, and on 124 settlements per venue this ordering is not noise.

Wrong-sign share at a four hour lead, by venue, with 95 percent Wilson intervals. Left bar of each pair is all 124 settlements, right bar is only that venue's near-zero settlements. Binance beats Bybit and Bitget on the full set at p = 0.013, and once both are restricted to their near-zero settlements not one of the six pairs separates, the smallest p being 0.073.
But the ordering is not a fact about the screens, and the control that shows this is the same near-zero mechanism from the section above. A venue whose funding rarely approaches zero cannot produce many sign errors. Taken from each venue's own settled history with no Athenum data involved, Binance's Bitcoin funding sat below the pooled median in only 42 of 124 settlements, against 77 for Bybit, 66 for OKX and 63 for Bitget, and Binance was positive at 123 of 124 stamps with a median absolute rate of 0.00585%, against 0.00380% for Bybit. Binance had the easier six weeks, repeatedly.
So condition on the hard cases. Restrict every venue to its own near-zero settlements and compare like with like: Binance 7 of 42, OKX 14 of 66, Bitget 21 of 63, Bybit 23 of 77. Not one of the six pairwise comparisons separates, the smallest p being 0.073. The venue gap is a fact about where each venue's funding sat, not about the quality of the number it puts on screen, and anyone ranking these four on the raw column is ranking a market condition.
Two further measurable things push the same way. All 124 of Bitget's settled rates here are exact multiples of 0.000001, six decimal places, while Binance and Bybit publish eight and OKX up to twelve, so near zero a coarser grid can push a rate across the line on rounding alone. And the venues do not sample identically, so this is not one number measured four ways: Binance and Bitget take a sample every five seconds while Bybit and OKX take one a minute. That last split is newer than it looks. Bitget announced on 2026-07-02 that it would move from one minute to five seconds effective 2026-07-10 in UTC+8, subject to the actual deployment, which falls inside this window, so its screen does not behave the same way in the first two weeks of the panel as in the last four. Bitget is also the venue where the three hour result is individually strongest, so treat that particular row with more caution than the pooled figure.
One more caveat belongs in this section rather than in a footnote, because it cuts against the headline. The three hour horizon is a pooled result, and no single venue's 124 settlements can establish it alone. At three hours out the screen beats the previous-settlement rule 18 to 7 on Bitget (p = 0.043), 13 to 6 on OKX (p = 0.17) and 12 to 7 on Bybit (p = 0.36), and on Binance it loses, 0 to 3. At four hours out Binance's lazy rule beat its screen 7 to 0 (p = 0.016). That is what a one-sided stretch does: when a venue's funding almost never crosses zero, assuming nothing changes is an excellent rule and a drifting estimate can only add mistakes. The pooled finding is not carried by Binance, though. Drop it entirely and the other three still separate at three hours, 43 to 20 on 372 settlements (p = 0.005). Read the horizon as a statement about these four venues together, not as a promise about any one screen.
How far off is the level, not just the sign?
Further, and it degrades steadily. The median absolute gap between the read and the settled rate runs 0.036 basis points in the final hour, 0.140 at three hours and 0.180 at four, against settled rates whose own median magnitude is 0.48 basis points. In other words a four hour read typically misses by more than a third of the size of a typical settled rate, which is a large miss on a small number.

Absolute error in basis points, median with the 25th to 75th percentile band. Shown in absolute terms deliberately: as a share of the settled rate the same error looks enormous only because that rate is often close to zero.
This is deliberately in absolute terms. Dividing the error by a settled rate that is frequently near zero produces percentages in the hundreds and flatters the point rather than testing it. In basis points the reading is sober: at the four hour lead the middle half of readings misses by between 0.065 and 0.339 basis points, and even in the final hour the middle half misses by between 0.013 and 0.072.
What did today's settlement actually look like?
Like one venue crossing zero by the full width of the number in the last three hours, a second grazing it, and only one of the four never coming close. Into 2026-08-08 08:00 UTC, Bybit's running Bitcoin perpetual rate read -0.00665% seven hours out and was still at -0.00162% four hours out, both saying shorts would pay, then crossed to +0.00009% three hours out and settled at +0.00389%, longs paying instead. A reader who acted on the four hour screen had the direction backwards.

The 2026-08-08 08:00 UTC settlement. Each line is one venue's running rate averaged over the hour beginning that many hours before the stamp, and the large hollow marker is what the venue actually charged. Read four hours out, only Bybit had the sign wrong, and it was wrong by the full width of the number.
The other three behaved. Binance read +0.00434% seven hours out and charged +0.00542%, right in sign the whole way but a fifth below what it charged. OKX read +0.00210% seven hours out, dipped to -0.00008% five hours out, which is a sign error at that lead by the width of a rounding, and charged +0.00356%. Bitget read -0.00226% seven hours out and charged -0.00010%, correct in sign but essentially zero, which is exactly the near-zero regime where the sign carries the least information.
For scale on the same instant, the last complete hourly bar before that stamp, 07:00 UTC on 2026-08-08, carried Bitcoin at $64,956.24. We are deliberately not putting an aggregate open interest figure next to it: the Athenum post on whether open interest counts one side or both showed that a raw cross-venue sum runs about 20% high because some venues count both legs of every contract, and nothing in this post needs the number. Hyperliquid quoted +0.00045% on its one hour clock at that bar, which is not on the same scale as the others and should not be lined up beside them.
How do you check this yourself?
Every input is public and none of it needs an account.
1. Get the settled series. Binance fapi/v1/fundingRate, Bybit v5/market/funding/history, OKX api/v5/public/funding-rate-history where the settled value is realizedRate, Bitget api/v2/mix/market/history-fund-rate. Each returns the Bitcoin settlements inside your window. 2. Watch one number move. Request any venue's live funding endpoint twice, twenty minutes apart, inside an interval. If the two values differ, that venue's displayed rate is not the rate it last charged. 3. Confirm the clock before comparing anything. Pull the interval fields in the table above. A venue on a one hour clock cannot be set beside one on eight hours without converting both, and the free Athenum funding rate calculator carries an explicit eight hour, four hour and one hour selector for exactly that. 4. Record the lead time with every reading. The most useful column is not the rate, it is how many hours were left before the stamp when you wrote it down. 5. Benchmark against the lazy rule, not against zero. A method that beats "assume it stays where it last settled" is worth something. In this window only the readings inside three hours did. 6. Check the distance from zero before trusting the sign. Above 0.0048% per eight hours in magnitude, the sign was right in all 248 readings at one hour and all 248 at two hours. Below it, a quarter of four hour reads were wrong. 7. Condition before you rank. If one venue looks better than another, check whether its funding simply sat further from zero over your window. Here that accounted for the entire gap.
Three limits worth stating rather than burying. The Athenum hourly bar is an average over its hour and not an instantaneous sample, which we established by watching the newest bar move while every completed bar stayed put to within floating-point noise, so each lead above is an hour-long window labelled by where it opens rather than a snapshot at exactly that moment. Seven leads were tested against the same benchmark, and that multiplicity matters: hold the family-wise error rate at 5% by the Holm method and the one hour and two hour results survive comfortably while the three hour separation does not clear its adjusted threshold. Two re-tests that respect the clustering agree with the unadjusted figure, a stamp-level bootstrap at about p = 0.017 and a stamp-clustered permutation at p = 0.022, so the three hour result is real but it is the weakest of the seven and should be read as nominal. Six weeks of one asset on four venues is still a limited sample, and the intervals printed above are the honest width of it. And the levels here belong to this window: the median absolute settled rate of 0.0048% per eight hours is under half the 0.01% that sits in the venues' own formula as the interest component, so a more directional stretch would very likely produce a lower flip rate. What is durable is the shape rather than the boundary: the screen is decisively better than doing nothing inside two hours, indistinguishable from it at four hours and earlier, and the crossover sits around three. The exact percentages are this window's.
One last note on where this sits, stated narrowly because the broad version would be unfalsifiable. The predicted-versus-realized distinction is itself well documented: Coin Metrics and Amberdata both sell the two series separately, and OKX labels them fundingRate and realizedRate in its own API. What we could not find is anyone publishing the magnitude of the gap, meaning an exchange research note, vendor study or paper that quantifies how far a venue's running read sits from the rate it then charges. The nearest academic work goes at adjacent questions: one paper forecasts the next settled rate from the history of settled rates and scores itself against a no-change benchmark, and another measures funding-rate spreads across dozens of venues on tens of millions of observations. Neither asks how far the exchange's own displayed number sits from the rate that exchange then charges, which is the only question here. If such a measurement exists we would like to see it. The numbers above are ours, and they are meant to be re-run rather than believed.
Nothing above needed a paid data terminal and none of it needed permission: every settled rate came from a venue's own public history endpoint, and the hourly path between the stamps came from Athenum's live cross-venue derivatives feed, with the 34 calculators beside it free to use, no account, no email and no usage limits. The funding rate calculator linked above turns a per-interval rate into an annual one; if you want to go the other way and compound an annual rate, that is the free Athenum APR and APY calculator. Or take a free 7 day Athenum Pro+ trial and watch the next stamp arrive instead of reading about the last one.
One terminal. All the data.
Liquidations, orderbook depth, whale walls & open interest from 4 exchanges, all real-time, in one place.
No credit card required

Athenum Analytics
Athenum Analytics is our three-person editorial team covering crypto derivatives, market data and macroeconomic context.