Table of Contents8 sections
- How much of the Bitcoin order book does one public request return?
- Why do two routes on the same exchange disagree by 18 times?
- Does a deeper route mean a cheaper fill?
- What happens when a route runs out of book mid-measurement?
- Are the venues even quoting the same unit?
- How should a cross-venue depth comparison be run, then?
- Do these venues disagree about anything else this much?
- What this post does not say
Practise with worked lessons
- Calculate execution VWAP by walking order-book depth
Walk a market order through order-book depth. Calculate the average execution price (VWAP) and slippage in basis points before costs outweigh the setup.
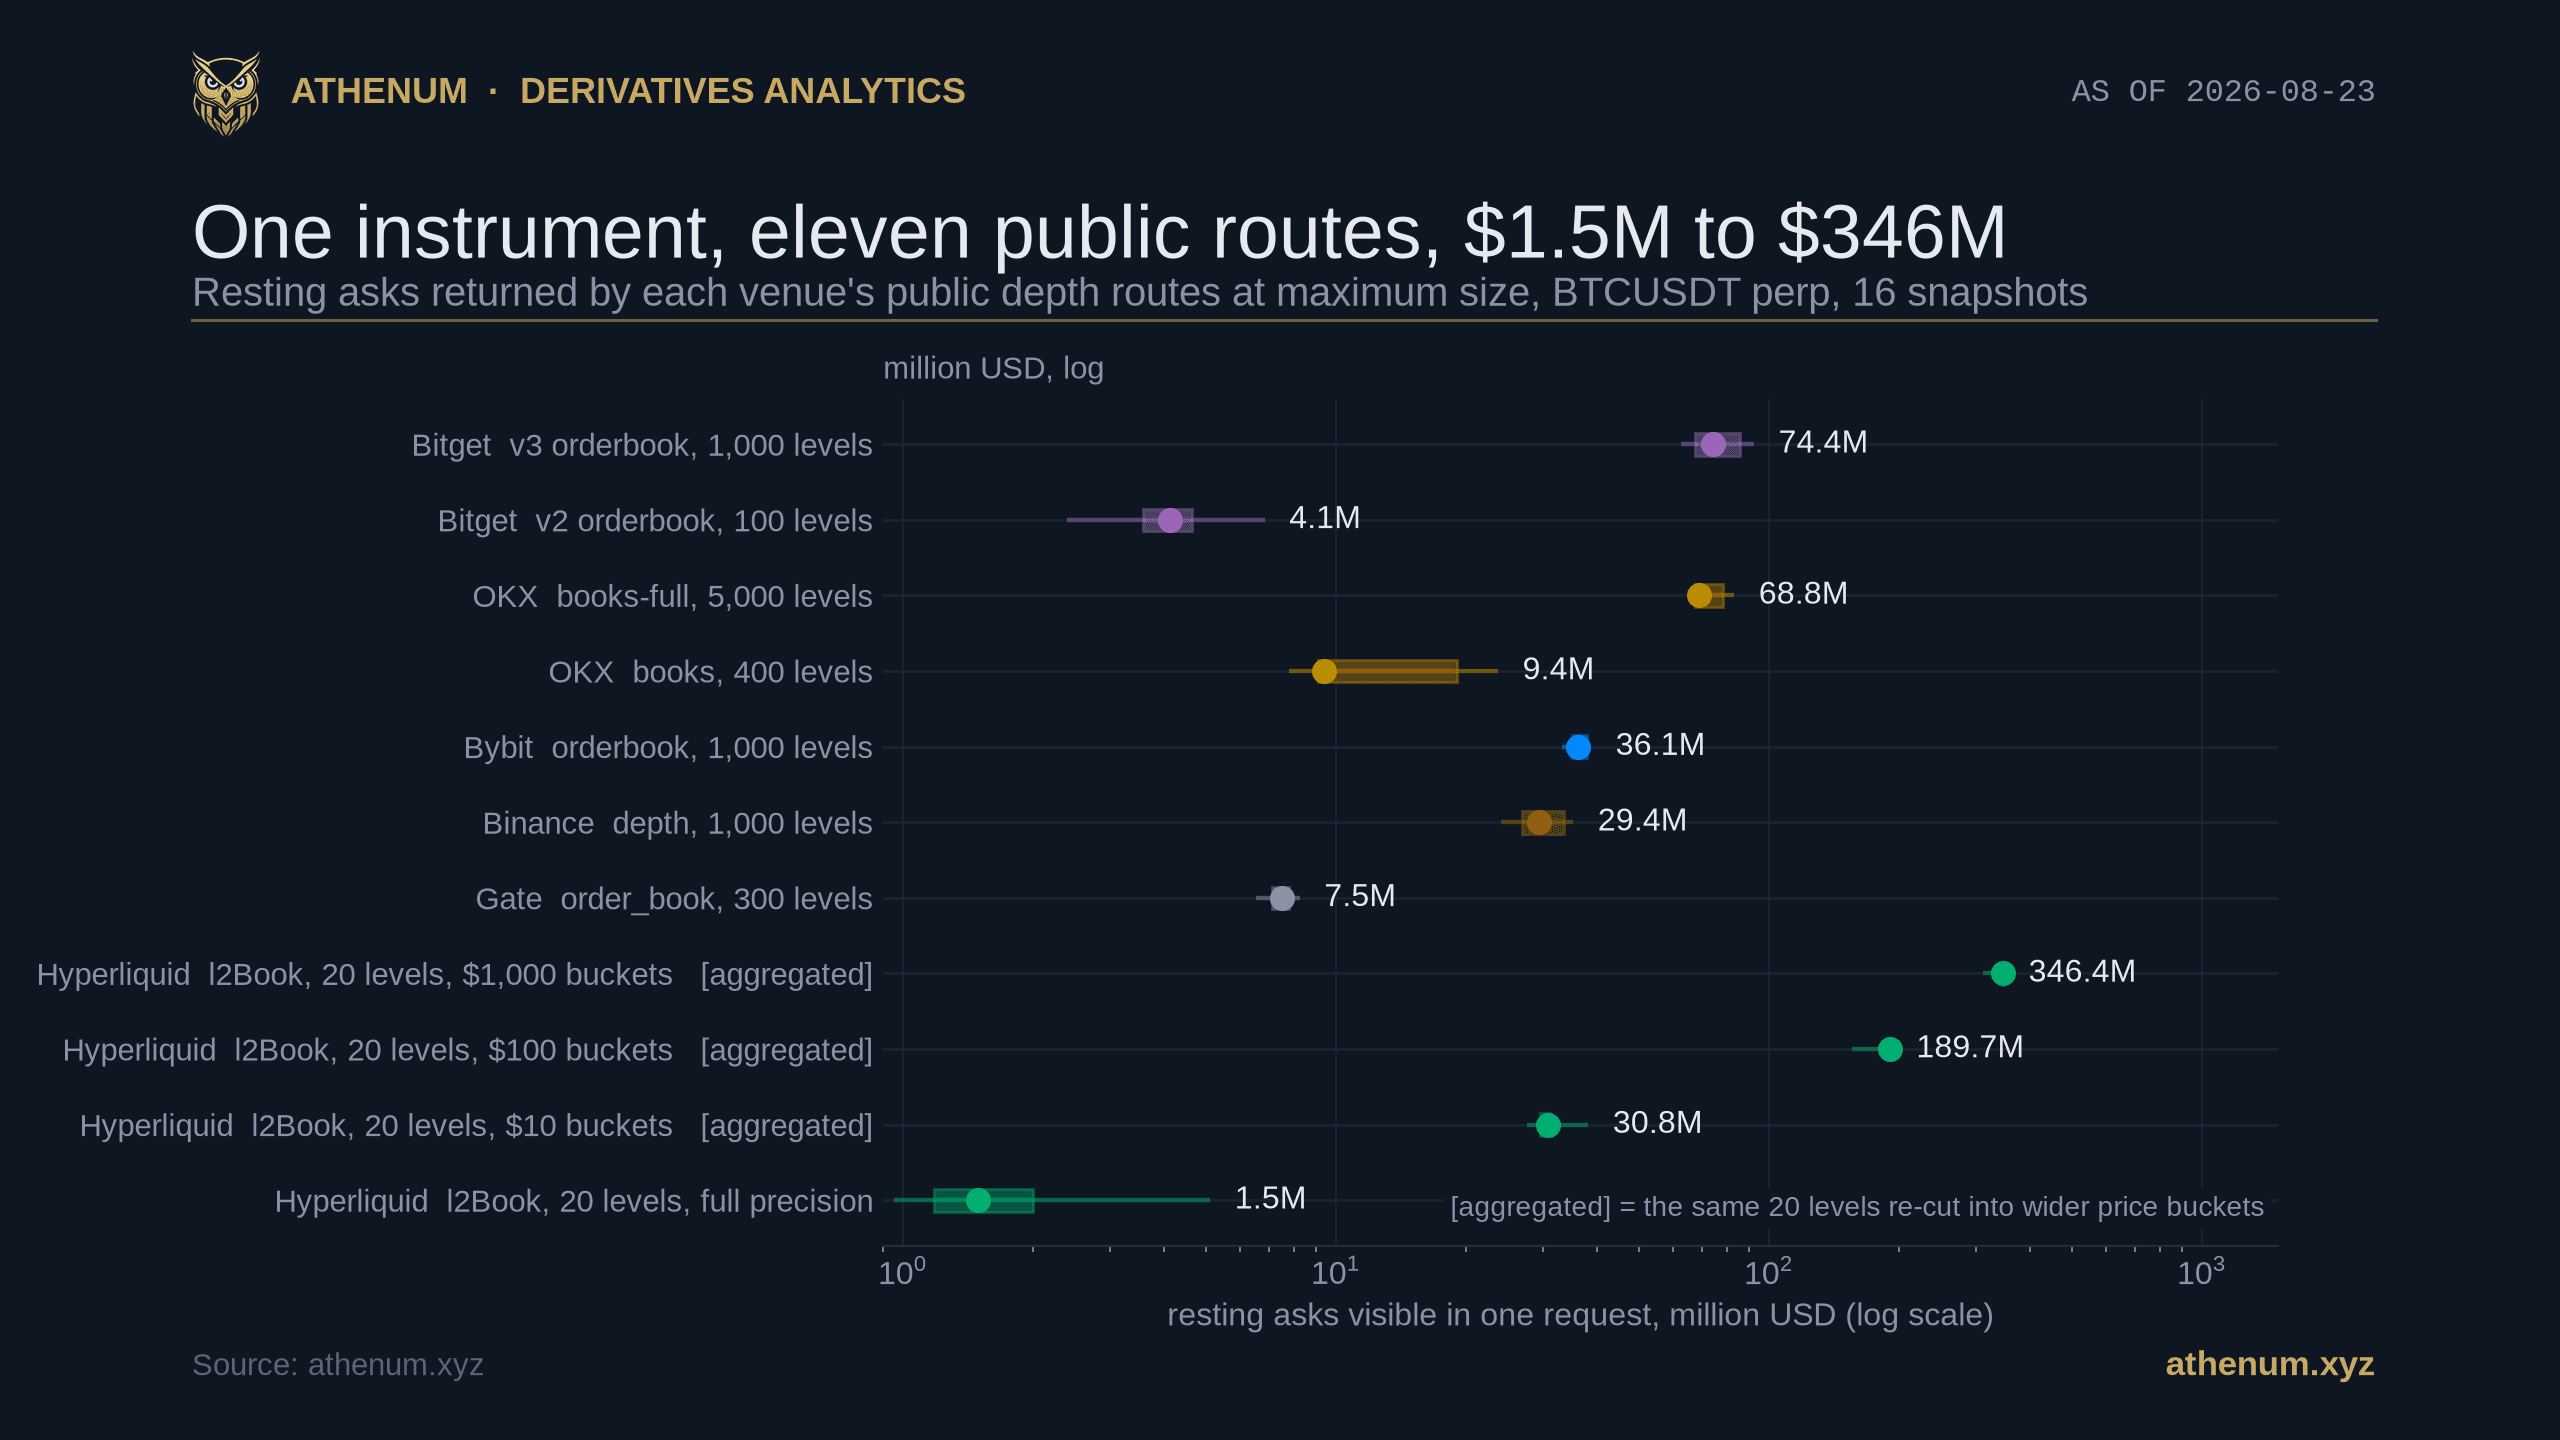
TLDR. Every comparison of exchange liquidity starts by downloading an order book, and almost nobody checks that the download is a choice. Measured on 2026-08-23 across 11 public depth routes on six Bitcoin perpetual venues, 16 simultaneous snapshots each, the resting asks returned by one request run from 1.49M USD to 346.37M USD. The largest single gap is not between exchanges. It is inside one: Bitget's older public route returned a median 4.15M USD of asks while its current route returned 74.37M USD, 17.9 times more, from the same book at the same instants. OKX's two routes differ by 7.4 times. Hyperliquid returns exactly 20 levels on every request, and one optional parameter moves what those 20 levels contain from 1.49M to 346.37M USD, a factor of 233, without changing the level count at all. Against that, the four venues that expose a route of 1,000 levels or more differ from each other by 2.53 times. So among those four, on 2026-08-23, the route you picked moved the answer roughly 7 times more than the exchange you picked. Widen the venue set and that particular comparison changes, which we take apart at the end. Everything downstream inherits it: a 5,000,000 USD market buy is fillable on Bitget's current route in 16 of 16 snapshots and on its older route in 3, and the older route reports the cheaper price precisely because it only answers when it is deep.
Every number below was measured by us on 2026-08-23 from each venue's own public endpoint, and the cross-venue derivatives feed we run beside them is Athenum. The instrument is the Bitcoin perpetual on each venue: BTCUSDT on Binance USD-M, Bybit, Bitget and Gate, BTC-USDT-SWAP on OKX, and the BTC perpetual on Hyperliquid. The measurement window is 16 snapshots between 09:08 and 09:16 UTC, all 11 routes requested in parallel on every snapshot, 0 failed requests out of 176. Each figure quoted as a single number is the median across those 16 snapshots, and each chart draws the spread behind it.
How much of the Bitcoin order book does one public request return?
Anything from 1.49M to 346.37M USD of resting asks, and the choice of route decides more of that than the choice of exchange. This is the full matrix as measured on 2026-08-23:
Venue and route | Levels returned | Resting asks, USD | Deepest ask, bps from mid |
|---|---|---|---|
Bitget `v3/market/orderbook` | 1,000 | 74.37M | 39.32 |
OKX `market/books-full` | 5,000 | 68.83M | 103.08 |
Bybit `v5/market/orderbook` | 1,000 | 36.14M | 25.25 |
Binance USD-M `fapi/v1/depth` | 1,000 | 29.42M | 18.17 |
OKX `market/books` | 400 | 9.36M | 7.72 |
Gate `futures/usdt/order_book` | 300 | 7.52M | 19.94 |
Bitget `v2/mix/market/orderbook` | 100 | 4.15M | 2.86 |
Hyperliquid `l2Book` full precision | 20 | 1.49M | 2.55 |
Hyperliquid `l2Book` in 10 USD buckets | 20 | 30.81M | 25.45 |
Hyperliquid `l2Book` in 100 USD buckets | 20 | 189.70M | 254.40 |
Hyperliquid `l2Book` in 1,000 USD buckets | 20 | 346.37M | 2,549.02 |
Read the venue column rather than the ranking. Bitget appears twice, 17.9 times apart. OKX appears twice, 7.4 times apart. Hyperliquid appears four times across a factor of 233, and its level count is 20 in every one of those rows. Meanwhile the four venues that expose a route of 1,000 levels or more, Bitget's `v3`, OKX's `books-full`, Bybit and Binance, sit between 29.42M and 74.37M USD, a factor of 2.53. That is the comparison worth holding on to: on 2026-08-23 the within-exchange route gap on Bitget was about 7 times the entire between-exchange gap among the four deep routes.
Why do two routes on the same exchange disagree by 18 times?
Because they are different products of different ages, and nothing in either response says so. Three distinct mechanisms produced the three gaps above, and they are worth separating because only one of them is a page size.
An API version. Bitget's `v2` mix route returned exactly 100 levels on all 16 snapshots of 2026-08-23: it honours smaller requests, we measured 5, 15, 50 and 100 coming back as asked, and silently caps anything above, so 200 and 1,000 both return 100. Its `v3` route accepts up to 1,000 and returns them. Both are live, both are public, both describe themselves as the order book. A comparison written against the older route and re-run today gets 4.15M USD where the newer one gets 74.37M.
A second endpoint. OKX publishes `market/books`, capped at 400 levels, and `market/books-full`, capped at 5,000. On 2026-08-23 those returned 9.36M and 68.83M USD of asks. Same exchange, same instrument, same instant.
An aggregation parameter. Hyperliquid returns 20 levels per side and offers no way to ask for more. What its optional significant-figures parameter changes is the width of each of those 20 buckets: at full precision they are 1.00 USD wide and hold 1.49M USD, at three significant figures they are 100.00 USD wide and hold 189.70M, and at two they are 1,000.00 USD wide and hold 346.37M, reaching 2,549 basis points from mid. Nothing about the book changed. The window did.

How far each route sees, measured on 2026-08-23. The four Hyperliquid rows are the same 20 levels every time: only the bucket width changes, and it moves the reach from 2.55 basis points to 2,549. Nothing about the book changed between those two rows.
That third case is the one most likely to be misread in both directions. Hyperliquid genuinely publishes only 20 price points, which is a real constraint if you want the shape of the ladder. It does not follow that its book is thin: at two significant figures those 20 points span a quarter of the price and hold 346.37M USD of asks, more than any other route in this test. Anyone who calls Hyperliquid shallow on the strength of its default response has measured the default and not the venue. The honest statement is narrower and stranger: on Hyperliquid you choose your resolution and your reach with the same knob, and you cannot have both.
The caps themselves are not published consistently either. We asked every route for one level more than its maximum on 2026-08-23 and got three different behaviours. Binance USD-M rejects it outright, and rejects any value not on its list: `limit=1001` returns error -1130 and `limit=999` returns error -4021, "999 is not valid depth limit". Binance spot, the same exchange, silently truncates instead: `limit=5001` returns 5,000 rows and `limit=999` returns 999. Bybit silently clamps 1,001 to 1,000. OKX and Bitget's `v3` reject with an error code. Gate rejects with `TOO_BIG` and the message `limit 300`, which is the only place we saw that ceiling stated at all.
Does a deeper route mean a cheaper fill?
At small size nothing distinguishes them, and at large size the question stops being answerable on half the routes. These are volume weighted costs of a market buy walked through the visible asks, in basis points against mid, median across the 16 snapshots of 2026-08-23, with the number of snapshots in which the order was fillable at all:
Route | 100k USD | 1M USD | 5M USD | 25M USD |
|---|---|---|---|---|
Bitget `v3` | 0.007 | 0.671 | 2.019 | 4.349 |
Bitget `v2` | 0.007 | 0.730 | 1.594 in 3 of 16 | no book |
OKX `books-full` | 0.007 | 1.048 | 2.743 | 9.500 |
OKX `books` | 0.007 | 0.972 | 2.711 | no book |
Binance | 0.007 | 0.748 | 2.428 | 9.266 in 15 of 16 |
Bybit | 0.011 | 1.600 | 3.765 | 9.788 |
Gate | 0.007 | 1.342 | 4.497 | no book |
Hyperliquid | 0.095 | 1.143 in 15 of 16 | 1.083 in 1 of 16 | no book |

The cost of a market buy on 2026-08-23, and where it stops existing. At 100,000 USD six of the eight raw routes charge exactly half a tick and the other two barely more. At 25,000,000 USD four of the eight have no visible book to answer with, which is a coverage fact and not a price.
The 100,000 USD column is not a liquidity measurement. Half of one ten cent tick at a mid near 76,500 USD is 0.0065 basis points, and six of the eight raw routes return exactly that, because an order that size never leaves the best offer; Bybit's 0.011 is the seventh, barely above it. Hyperliquid's 0.095 is not a liquidity measurement either: its Bitcoin tick is 1.00 USD rather than the 0.10 every other perpetual in this test uses, so its quoted spread is ten times wider in relative terms and a small order pays at least half of it. That is the same result our earlier piece on the crypto bid-ask spread reached at the top of the book: ranking venues by quoted spread mostly ranks their tick sizes.
The 1,000,000 USD column is the last one every route answers in nearly every snapshot, and there the spread is 0.671 to 1.600 basis points, a factor of 2.4. From 5,000,000 USD upward the table stops being a ranking and becomes a coverage report, and the two things look identical unless the coverage is printed. A cost that could not be computed is not an expensive cost.
What happens when a route runs out of book mid-measurement?
It stops reporting, and what it stops reporting is not a random sample. This is the part of the exercise that changed our own mind, and Bitget supplies the control, because both of its routes read the same book at the same instants.
Bitget's `v2` route could fill a 5,000,000 USD order in 3 of the 16 snapshots of 2026-08-23, and on those three it posts a median 1.594 basis points, cheaper than its own `v3` route's 2.019 across all 16. Read as a ranking, the shallow route wins. Now match the instants. On exactly those 3 snapshots the `v3` route cost 1.406 basis points, and the discount is gone. Be precise about what that does and does not show. Paired instant by instant, `v3` was dearer by 0.060 basis points in one, identical in another and cheaper by 0.188 in the third, so the median paired difference is 0.000 and three matched instants are not a sample. What carries the point is not the cost comparison, it is the depth underneath it: the `v2` route's visible asks on the three snapshots it could answer were a median 5.69M USD against 3.79M on the other thirteen, and that is a large effect measured on 16 observations rather than 3.

The control, on 2026-08-23: two public routes reading the same Bitget book at the same instants. The shallow route looks cheaper at 1.594 against 2.019 basis points until the instants are matched, and then the gap disappears. Paired across those three instants the median difference between the two routes is 0.000 basis points, so the finding is the coverage and the depth behind it, not a price advantage.
Hyperliquid at full precision shows the same effect in its extreme form. It could fill 5,000,000 USD in 1 of the 16 snapshots, and posts 1.083 basis points, the cheapest number in the whole table. That single snapshot held 5.12M USD of visible asks; the other fifteen had a median of 1.41M and a maximum of 2.51M. One reading, drawn from the deepest instant of the window, presented as a venue's execution cost.
The mechanism is general and it has a direction. The filter deciding which snapshots yield a number is the same quantity being measured, so the surviving observations are the deep ones, and every statistic computed on them is biased toward cheap. It bites hardest exactly where the visible book is thinnest, which is where an analyst most wants an answer. The defensible reporting is the one used in the table above: publish the coverage next to the number, or publish no number. Our post on liquidation data is the same defect one layer up, where a reported total is a floor because the venues throttle what they report.
Are the venues even quoting the same unit?
No, and this one silently multiplies errors rather than biasing them. Of the eight raw routes measured on 2026-08-23, five return quantities in Bitcoin and three return them in contracts, OKX on both of its routes and Gate on its one. OKX's swap contract is 0.01 BTC, so its raw sizes are 100 times the coin amount. Gate's BTC_USDT contract multiplier is 0.0001 BTC, so its raw sizes are 10,000 times the coin amount. Read both raw and against each other and the two venues are wrong by a factor of 100 relative to one another and too large by up to 10,000 against the five that quote in Bitcoin.
Nothing in either payload says which it is. The multiplier lives on a different endpoint, `public/instruments` on OKX and `futures/usdt/contracts` on Gate, and a depth response that arrives as an array of price and size pairs looks identical either way. Our post on open interest in coins versus dollars is the same trap on a different field, and the rule transfers: read the contract specification before the number, every time, because the number will not tell you.
How should a cross-venue depth comparison be run, then?
Inside a band that every route in the comparison actually reaches, with the coverage printed next to every figure. On 2026-08-23 the binding constraints were Hyperliquid at 2.55 basis points and Bitget `v2` at 2.86, so any statement covering all eight raw routes that day had to live inside about 2.5 basis points of mid.

The only band all eight raw routes can be compared in on 2026-08-23 is about 2.5 basis points wide, and inside it the ranking is not the one the raw totals give. Bitget's 100 level route is first at 2.240M and its 1,000 level route second at 2.203M, which is what two routes reading the same top of book should look like, while Bybit falls from third on visible book to last at 0.631M.
That band is narrow and unglamorous, and it is also where the ranking stops being an artifact. Inside 2 basis points on 2026-08-23 the eight routes hold between 0.631M and 2.240M USD of asks, a factor of 3.6 rather than 233, and the order is different from the raw totals: Bitget's `v2` route, seventh of eight on visible book, is first inside the band at 2.240M against `v3`'s 2.203M, a difference of 1.7%, which is what two routes reading the same top of book should look like. Bybit, third of eight on visible book at 36.14M, is last inside the band at 0.631M. Its deep total is real and so is its thin front, and only one of those two facts survives a comparison that every venue can join.
Our own earlier piece on order book imbalance and liquidity walls makes the neighbouring argument, that the band you pick decides the number. It is worth reading with one thing added. The depth figures in it count resting walls above a size filter across the whole book, which is a different measurement from the ladder here, and the piece itself does not say which route produced the snapshot underneath it. The band matters, and so do the venues you include, which that page says outright; the route is the third thing, and it is the one nobody states.
One correction is owed closer to home, and it needs stating carefully. Our earlier explainer on Bitcoin liquidity and orderbook dynamics carries a third party league table in which Binance leads on depth near the mid. Our ordering on 2026-08-23 is the other way round, at both bands that bracket the distance that table uses: within 1 basis point of mid Bitget's `v3` route held 0.824M USD of asks against Binance's 0.599M, and within 2 basis points 2.203M against 1.478M. Three things keep that from being a refutation. The older figures are spot and two sided, ours are a perpetual and ask only, and the older page itself notes that perpetual books are often deeper than spot. Different instrument, different side, different day. What the two readings do have in common is the defect this post is about: neither of them says which route produced it, so neither can be checked against the other. Ours at least names its route.
Three rules follow, and none needs a data vendor:
1. Enumerate the routes before you pick one. Ask whether the venue publishes a second depth endpoint, a newer API version, or an aggregation parameter, because on 2026-08-23 those three moved the answer by 7.4, 17.9 and 233 times respectively. 2. Compare inside the shallowest route's reach. A depth figure quoted at 50 or 100 basis points is a real reading for the routes that extend that far and a capture limit dressed as liquidity for the ones that do not. 3. Print coverage with every fill cost. State the fraction of snapshots in which the order was fillable, because a route that answers 3 times out of 16 is not a route that is cheap.
If you would rather size an order against these constraints than read about them, our position size calculator and leverage and margin calculator are free and ask for nothing, and the liquidation calculator does the same job for the level a filled position gets closed at.
Do these venues disagree about anything else this much?
Barely, and the contrast is the reason any of this matters. Read from our own cross-venue feed for the 08:00 UTC hour of 2026-08-23 and converted to a common eight hour basis, Bitcoin perpetual funding was 0.01318% on Deribit, 0.01096% on Hyperliquid, and exactly 0.01000% on Binance, Bybit, OKX and Bitget. The whole spread is 0.00318 percentage points, 0.318 basis points per settlement. That is the 08:00 hour, which had already closed when we read it; the hour still in progress is a partial average and moves after you quote it.
That agreement is not consensus. Four venues sit on 0.01000% because the standard funding formula clamps the rate to its fixed interest rate component whenever the perpetual trades close enough to its index, so those four identical readings are the clamp and not four independent measurements agreeing. Hyperliquid's figure needed converting before it could be compared at all, because it settles funding hourly rather than every eight hours, so its native 0.001370% per hour becomes 0.01096% on the eight hour basis the others use; the mechanics are in our post on funding rate intervals.
Set the two side by side, in their own units, and the asymmetry is the finding. The quantity every terminal prints for these venues sat inside 0.318 basis points per settlement. The quantity almost nobody prints, how much of the book a public request will even show you, spanned a factor of 233 on the same day, and the widest gap inside it, 233 times, sits within a single venue. Those are different quantities on different scales and we are not adding them together. The point is that the visible agreement is on the metric that is easy to publish.
What this post does not say
It does not say a venue with a small page size has a small book. Every figure here is what a public request returned, and nothing measures what sits beyond it. Bitget's `v2` route showing 4.15M USD is a fact about that route on 2026-08-23, not about Bitget, as its own `v3` route demonstrates in the same table.
It does not cover websocket depth channels. Several of these venues also publish incremental depth streams, and a client that maintains a local book from one is not bound by the snapshot caps measured here. We did not measure those streams and make no claim about them. What is bound is every comparison built from a single public request, which is most of the comparisons that get published, including screenshots, spreadsheets and third party dashboards.
It does not say these are the costs of trading. A market order does not walk a frozen ladder. The book reprices while the order executes, other participants react, and hidden or iceberg size that no snapshot shows will fill part of it. Every cost here is what the visible ladder would have charged had it stood still, which is a lower bound in a calm market and can land either side of the truth in a fast one. It is also not a fill price on the aggregated routes, where a level's price is a bucket boundary rather than a quote, which is why we computed no fill costs on those three rows.
It does not generalise past one instrument and one window. 16 snapshots over 7 minutes and 31 seconds on one Bitcoin perpetual is enough to show that the route dominates the venue by an order of magnitude and not enough to rank the venues. An interquartile range across that window measures how much a book flickers minute to minute, not how these routes compare on another day, at another hour, or on a smaller asset, where the caps would bind harder rather than softer.
It does not survive every definition of the between-exchange gap, and this is the limit a reader should press hardest. The 2.53 times figure covers the four venues that expose a route of 1,000 levels or more, each on its deepest route, which is the set where the comparison is like for like. Define it instead as every venue's deepest raw route across all six and the between-venue spread on 2026-08-23 is 50.0 times, larger than any within-venue gap except Hyperliquid's, because Hyperliquid's deepest raw route is 20 levels and that is itself the artifact. Drop Hyperliquid and it is 9.9 times, which still exceeds OKX's 7.4. So the claim that survives every definition is the narrow one: the largest single gap in the matrix, 233 times, is inside one venue rather than between two. The roughly sevenfold multiple is a statement about the four deep venues, not about all six.
It does not claim the caps are stable. They are product decisions and they move: two of the routes here differ from each other only because one exchange raised its maximum and kept the old endpoint running. A cap read today is a reading, like a price.
What it does rest on is a second window, run to check that none of this is one measurement's accident. We repeated the whole matrix on 2026-08-23 for a further 12 snapshots between 09:16 and 09:22 UTC, not overlapping the first. The ordering of all 11 routes by visible asks is identical across the two windows. The gaps themselves are ranges rather than numbers and they move with the book: Bitget's two routes read 17.9 times apart in the first window and 26.9 in the second, OKX's 7.4 and 8.0, Hyperliquid's widest pair 233 and 205, while the four deep routes stayed at 2.53 and 2.44 times apart. Bitget's older route could fill 5,000,000 USD in 3 of 16 snapshots in the first window and 1 of 12 in the second; Hyperliquid at full precision managed 1 of 16 and then 0 of 12. The two within-exchange gaps this argument leans on, Bitget's and OKX's, are both wider in the second window than in the first; Hyperliquid's is narrower; and the between-exchange spread is the smallest number in both.
None of this needed a data vendor. Eleven public endpoints, two short windows and a spreadsheet reproduce every depth figure above, which is the strongest thing that can be said for a measurement; only the funding readings come from our own feed. What a terminal adds is not access but a decision already taken on your behalf, about which route and which unit the number came from, and getting that decision right across venues is the work behind Athenum. Its 34 calculators ask for no account and no email address, and cap nobody's usage; the terminal opens on a free 7 day Pro+ trial with no card.
One terminal. All the data.
Liquidations, orderbook depth, whale walls & open interest from 4 exchanges, all real-time, in one place.
No credit card required

Athenum Analytics
Athenum Analytics is our three-person editorial team covering crypto derivatives, market data and macroeconomic context.