Table of Contents7 sections
- How long does a whale wall last on bitcoin perpetuals and spot?
- Does the answer hold from one day to the next?
- Where in the book do these walls sit?
- Does a short lifetime mean spoofing?
- Is a perp wall's lifetime related to its distance from price?
- What are the limits of this measurement?
- How do you check this yourself?
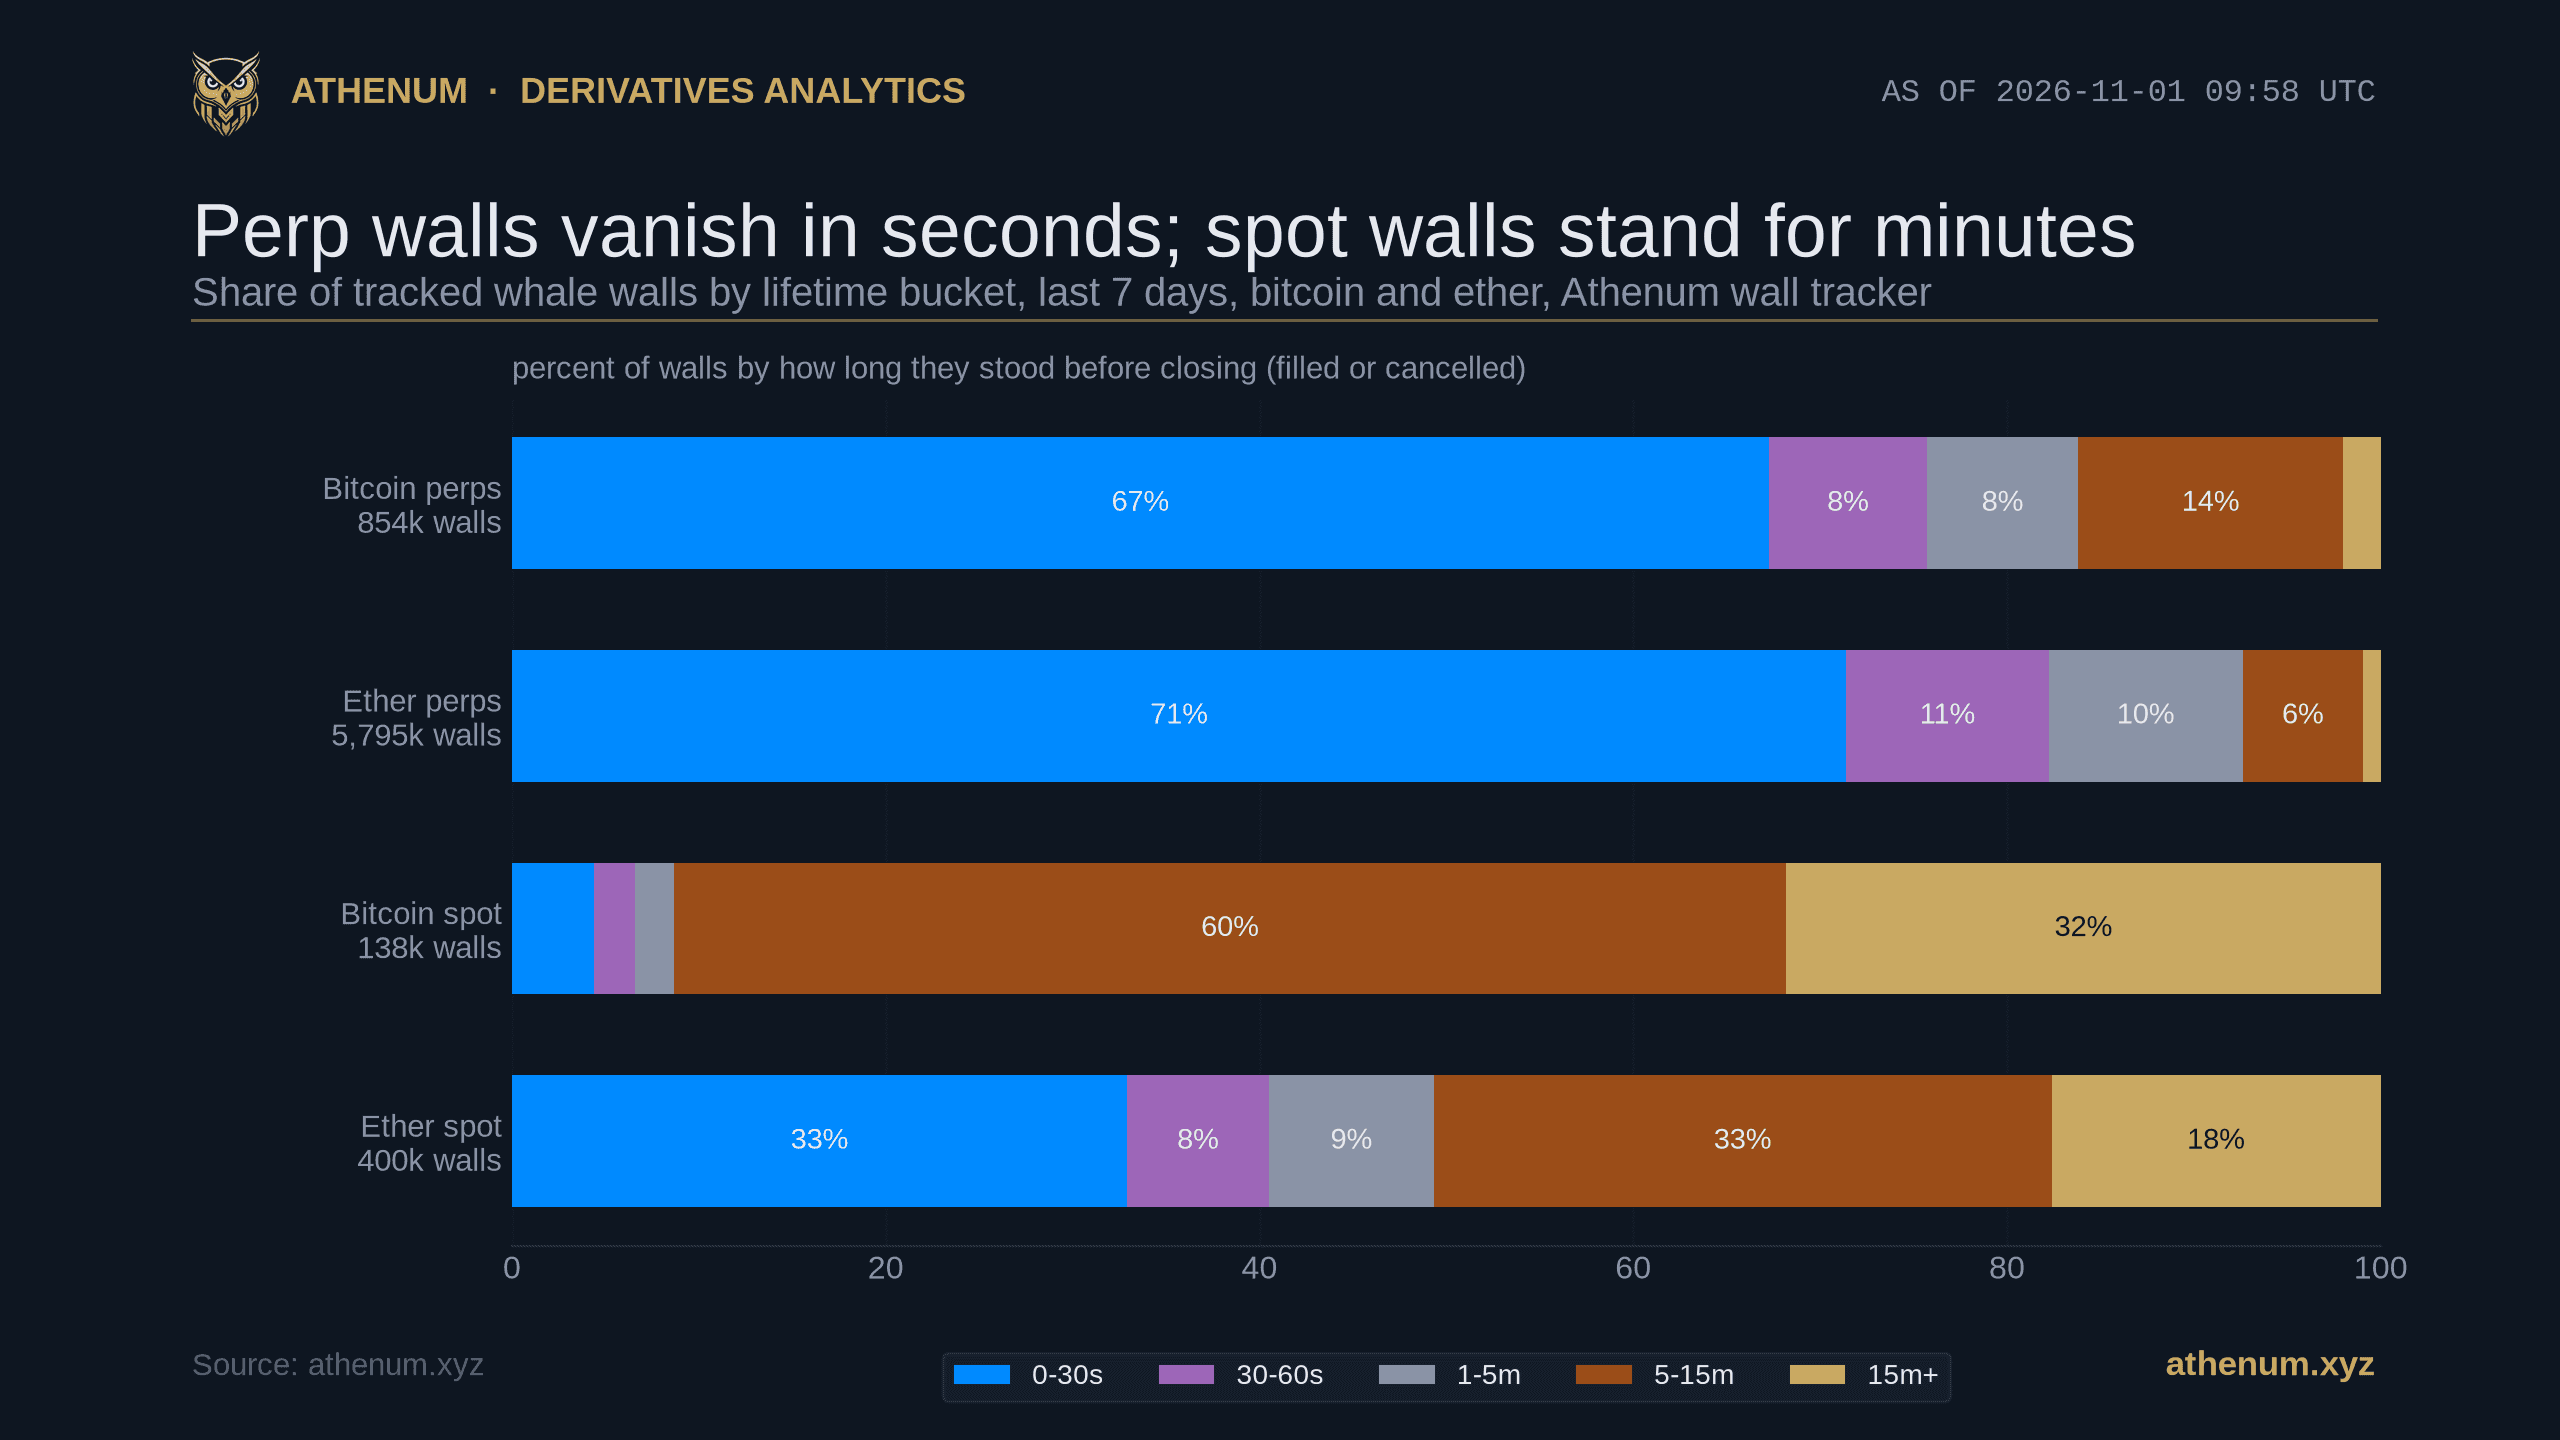
TLDR. A whale wall is a large resting order, and how long it stands depends mostly on which market and which day you ask about. Read from Athenum's wall tracker on 2026-11-01 (09:55 to 09:59 UTC), the 853,673 bitcoin perpetual walls that closed in the last 7 days split 67.3 percent under 30 seconds and 16.2 percent 5 minutes or longer, with a median of 10 seconds; the 137,819 bitcoin spot walls split 4.4 percent under 30 seconds and 91.3 percent 5 minutes or longer, with a median of 779 seconds, about 13 minutes. Two things stop that from being a simple "perps flicker, spot holds" story. First, on a single day the perp numbers moved a lot: the share closing under 30 seconds was 65 to 77 percent on six days and 37.6 percent on the latest one. Second, among the walls that had just appeared in a sample of the feed, bitcoin spot walls sat a median 27.8 percent away from the price against 0.96 percent for perp walls, so many spot walls are parked where nobody trades. Only 1.4 percent of bitcoin perp walls and 1.3 percent of bitcoin spot walls ended in a fill, and a short life is not by itself evidence of spoofing.
How long does a whale wall last on bitcoin perpetuals and spot?
On bitcoin perpetuals the typical wall is gone in about 10 seconds, and on bitcoin spot it stands for about 13 minutes. Both numbers come from the last 7 days of closed walls, read on 2026-11-01, where "closed" means the wall ended with a filled or cancelled classification. Walls whose ending was classed as a partial fill or as spoofing are not in these counts, and some cancelled endings are the tracker retiring a wall it no longer believes is on the book. Athenum's tracker watches resting orders above a size threshold on Binance and Hyperliquid perpetuals and on Binance and Coinbase spot, follows each wall until it disappears, and records how long it stood.
Market (7 days to 2026-11-01) | Closed walls | Under 30 s | 5 min or longer | Median, 7 days | Median, last 72 h | Median, last 24 h | Ended in a fill |
|---|---|---|---|---|---|---|---|
Bitcoin perps | 853,673 | 67.3 percent | 16.2 percent | 10 s | 7 s | 90 s | 1.44 percent |
Ether perps | 5,795,007 | 71.4 percent | 7.4 percent | 6 s | 9 s | 40 s | 1.64 percent |
Bitcoin spot | 137,819 | 4.4 percent | 91.3 percent | 779 s | 779 s | 809 s | 1.27 percent |
Ether spot | 399,926 | 32.9 percent | 50.7 percent | 359 s | 67 s | 629 s | 0.37 percent |
Read the three median columns before you read the first one. For bitcoin perps the median is 10 seconds over 7 days, 7 seconds over 72 hours and 90 seconds over the last 24 hours, all from the same endpoint on the same morning. For ether spot it is 359, 67 and 629 seconds. Only bitcoin spot holds still, at 779 to 809 seconds across all three windows. The three windows are nested, so these are not independent readings. A median is a good summary when the distribution is stable, and the next section shows that for three of these four markets it is not. The fill column comes from the behavior statistics endpoint, a slightly different cut of the same walls (848,376 bitcoin perp walls against 853,673 here).
One composition detail matters for the perp rows. In a separate read a few minutes earlier, 819,277 of the 7 day bitcoin perp walls (96.0 percent) were on Binance and 34,496 on Hyperliquid, so the perp rows are close to a Binance reading; on spot, Binance had 56,304 walls and Coinbase 81,506, so the spot rows are a mix. Those counts differ slightly from the table because the walls keep closing between reads.
Does the answer hold from one day to the next?
For bitcoin spot yes, for the perp books and ether spot no. The 7 day window can be cut into seven daily slices by subtracting the 24 hour window from the 48 hour window, the 48 from the 72, and so on. The requests for the four markets were made between 09:58:10 and 09:59:12 UTC (the bitcoin perp ones within about three seconds), so each slice is a one-day ring of closed walls that ends where the previous one starts, give or take about a minute.

Seven daily slices of the 7 day window read on 2026-11-01. The latest day (2026-10-31 09:58 UTC to 2026-11-01 09:58 UTC) closed 63,967 bitcoin perp walls against 117,750 to 141,762 on each of the other six days, and only 37.6 percent of them stood under 30 seconds, where the other six days ran from 65.2 to 76.7 percent. Bitcoin spot stayed at 78.3 to 96.6 percent standing 5 minutes or longer, while ether spot ranged from 27.8 to 76.9 percent.
The picture in the chart is this:
- Bitcoin perps. The share of closed walls that stood under 30 seconds was 65.2, 67.6, 65.8, 71.5, 76.7 and 71.6 percent on the six older days, and 37.6 percent on the latest one (2026-10-31 09:58 UTC to 2026-11-01 09:58 UTC). That day also closed 63,967 walls, against 117,750 to 141,762 on each of the other six. - Ether perps. The same break, from a range of 69.1 to 77.1 percent on six days to 43.5 percent on the latest, with 351,579 closed walls against 720,679 to 1,029,218 on the others. - Bitcoin spot. 78.3 to 96.6 percent of walls stood 5 minutes or longer on every day, with no break. - Ether spot. Between 27.8 and 76.9 percent depending on the day, and the latest day was the highest of the seven.
We cannot say why the latest perp day looks different. A quieter weekend market (the day ends on a Sunday), a change in how the tracker closes walls, or something in between could each produce it, and we tested none of them; the fact that bitcoin and ether perps moved together while bitcoin spot did not does not separate them. The honest reading is that the perp headline is a property of the day as much as of the market, and that any ranking of venues or days on this one number needs the spread shown next to it.
Where in the book do these walls sit?
On perpetuals they appear much nearer the price than on spot, where many appear very far from it. To measure it, we took the most recent 500 alerts from each market's wall feed on 2026-11-01, kept the wall-appeared alerts (139 for perps, 485 for spot) and compared every wall's price with the Binance 1 minute close in the minute of the alert (the USDT perpetual close for perp walls, the spot close for spot walls, so Coinbase walls are measured against Binance spot).

Distance of each wall-appeared alert's price from the Binance 1 minute close at the alert minute, read on 2026-11-01. Perp walls (139): median 96 basis points, middle half 26 to 324 basis points, 48.9 percent beyond 1 percent of price. Spot walls (485): median 2,785 basis points (about 28 percent), middle half 658 to 5,369 basis points, 69.7 percent beyond 10 percent of price. The two samples cover different spans, 14 minutes of perp alerts and 90 minutes of spot alerts, because each feed was capped at 500.
The perp walls had a median distance of 96 basis points (0.96 percent) and a middle half of 26 to 324 basis points; 48.9 percent were beyond 1 percent of price and 7.2 percent beyond 10 percent. The spot walls had a median of 2,785 basis points (27.8 percent), a middle half of 658 to 5,369 basis points, 90.5 percent beyond 1 percent and 69.7 percent beyond 10 percent. One Coinbase sell wall in the feed was priced at $109,000 while bitcoin traded near $78,000.
This is not a like-for-like sample, and the chart says so. The perp alerts cover 14 minutes and the spot alerts 90, because both feeds were capped at 500 rows, and a feed of alerts is a selection of wall events, not every wall. The other 361 perp alerts were sudden cancellations, which we left out because they are measured when a wall disappears and sit closer to the price (a median of about 21 basis points among the 341 Binance ones); the spot feed was nearly all appearances. What the sample can support is the direction. A wall parked far from the price would rarely be reached, so there is probably little reason to pull it and a long life would cost its owner little, while a wall within a percent of the price is in the path of every sweep. Part of the 13 minute spot median may therefore be a statement about where the tracker finds spot walls, not about how patient spot liquidity is. The lifetime endpoint cannot be split by distance, so we cannot say how much, and the tracker's own retirement of walls it no longer believes are on the book depends on distance too; we did not test that.
Does a short lifetime mean spoofing?
No, and the numbers here are a reason to be careful. In the US, the Commodity Exchange Act prohibits spoofing, which it defines as "bidding or offering with the intent to cancel the bid or offer before execution" (7 U.S.C. 6c(a)(5)(C)), and the CFTC reads that as requiring intent, not just cancellation. That is the definition for regulated US futures markets and not a finding about any venue named here. Intent is not in an order book, so a lifetime can only be a signal. The spoof_suspect_pct field on the lifetime endpoint is simply the share of walls that stood under 60 seconds: 75.7 percent for bitcoin perps over the 7 days read on 2026-11-01. That is a label for a short life, and a market maker who refreshes quotes every few seconds would be counted in it, because the label does not test intent.
Fills are rare, though that cannot clear anyone: a 98.6 percent cancel rate is also what spoofing would produce. Of the 848,376 bitcoin perp walls in the 7 day behavior statistics, 12,185 (1.44 percent) ended as fills and 836,191 as cancellations; on bitcoin spot it was 1,737 of 136,349 (1.27 percent). A wall is counted as filled when trade prints, or a price move through its level, explain its disappearance, and as cancelled when it left with little such evidence; partial fills sit outside the fill rate. So the fill rate is a classification of how walls ended, not a count of how often a wall was hit. On the same 7 days the fill rate was 1.64 percent on ether perps, 3.44 percent on solana perps and 0.37 percent on ether spot, so the perp books run at one to three and a half walls in a hundred, and bitcoin spot sits just below the lowest perp even though its lifetimes are so much longer.
The venue scores in Athenum's spoof-score endpoint add a second warning. Over the same 7 days Binance perps scored 83, with 74.7 percent of its walls under 60 seconds, and Hyperliquid perps scored 63, although 99.2 percent of Hyperliquid's walls were under 60 seconds. The score blends several factors (the short-lived share, how often walls reappear after a gap, how many large walls were cancelled and how much their size changes), so a higher short-lived share does not produce a higher score. On spot, Binance scored 41 with 1.2 percent of walls under 60 seconds and Coinbase 35 with 10.3 percent. For how the score is built, see Athenum's spoof score explainer; the venue averages shown there are means over a rolling 24 hours, so they will not match the medians in this post.
Is a perp wall's lifetime related to its distance from price?
Among the fast cancellations we can see, yes. The feed carries a lifetime for walls that were cancelled suddenly, and in the 14 minute Binance bitcoin perp sample every one of them was under 60 seconds. For those 341 alerts we ranked walls by distance from price and cut them into thirds.

Lifetime of Binance bitcoin perp walls that were cancelled within 60 seconds, split into thirds by distance from price, read on 2026-11-01 (341 alerts over 14 minutes). The nearest two thirds, within 28 basis points of price, had a median life of 1 second; the farthest third, 29 to 179 basis points away, had a median of 23 seconds and a middle half of 9 to 31 seconds. Lifetimes are whole seconds and the sample only contains walls that closed within a minute.
The nearest third (0 to 18 basis points from price) had a median life of 1 second and a middle half of 0 to 7 seconds. The middle third (18 to 28 basis points) was the same, 1 second and 0 to 6. The farthest third (29 to 179 basis points) had a median of 23 seconds and a middle half of 9 to 31 seconds. The Spearman rank correlation between distance and lifetime over the 341 walls is 0.53.
Three warnings come with it. The sample was selected on the outcome: it only contains walls that were cancelled within a minute, so it says how long the fast cancellations lasted by distance, not how long walls last in general, and lifetimes are recorded in whole seconds, which is why the near thirds sit at 1 (106 of the 341 walls are at 0). Distance is measured when the alert fires, and the tracker's own handling of vanished walls also depends on distance, so part of the association could be the tracker's. And it is one 14 minute window. Still, the direction is consistent: among walls cancelled inside a minute, the further from the price, the longer the wall stood.
What are the limits of this measurement?
- One read. Everything is from 2026-11-01, 09:55 to 09:59 UTC, with the daily slices built by subtracting rolling windows requested within about a minute of each other. - A wall is a tracker construct. It is a resting order above a size threshold set per symbol and venue; perp walls in the feed sample ranged from about $0.24 million to $34.7 million, with a median of $3.5 million. A wall that disappears and reappears at a similar size within a grace period of up to five minutes is treated as the same wall, which lengthens lifetimes relative to a count of individual orders, and the tracker also retires walls it no longer believes are on the book, which count as cancelled; we could not measure how much that affects the spot median. - Fills are inferred. They are classified from trade prints and price movement, so every fill rate here is a classification and not a count of orders hit. - Mixed venues. Perps are 96 percent Binance by wall count; spot is Binance plus Coinbase. We did not split the lifetime distribution by venue, because the endpoint does not. - Coverage. Solana walls were left out of the lifetime comparison because its 72 and 168 hour requests timed out on the first pass. - The latest day. We have not established whether it reflects the market or a change in how walls are closed, and we do not claim either.
How do you check this yourself?
At the time of writing the endpoints ask for no key and take a symbol and a lookback in hours.
1. Lifetime distribution. GET api.athenum.xyz/api/v1/whale-walls/futures/lifespan?symbol=BTCUSDT&hours=168 returns five lifetime buckets with counts and a median; replace futures with spot for the spot markets. A 168 hour request can take tens of seconds.
2. Daily slices. Request hours=24, 48, and so on up to 168, then subtract each bucket count from the next longer window. Keep the timestamps of your requests and expect a slice to drift by the walls that close between calls.
3. Outcomes and venues. .../whale-walls/futures/behavior-stats?symbol=BTCUSDT&hours=168 gives filled and cancelled counts by tier, and .../whale-walls/futures/spoof-score?symbol=BTCUSDT&hours=168 gives the score and its factors per venue.
4. Distance. .../whale-walls/futures/activity?symbol=BTCUSDT&min_usd=0&minutes=120&limit=500 returns recent wall alerts with a price and a timestamp; compare each price with the Binance 1 minute kline at the same minute.
If you size a position around a wall, the free Athenum position sizing tool turns a risk budget into a size, and the PnL calculator shows what it is worth if the price runs through. For the book itself, Athenum's earlier measurement of how one venue's depth changes with the API route shows how much the same venue's book changes with the way you read it, and Athenum's imbalance and walls explainer covers why a wall is evidence and not a guarantee.
Every figure above was read from Athenum's live whale-wall tracker on 2026-11-01, which follows Binance and Hyperliquid perpetuals and Binance and Coinbase spot, so each can be re-run from a keyless request. The free calculators beside it need no account, no email, and carry no usage limits, and the wall feed itself opens in the terminal with the free 7 day Pro+ trial at app.athenum.xyz; the trial asks for no card and ends on its own.
One terminal. All the data.
Liquidations, orderbook depth, whale walls & open interest from 4 exchanges, all real-time, in one place.
No credit card required

Athenum Analytics
Athenum Analytics is our three-person editorial team covering crypto derivatives, market data and macroeconomic context.