Table of Contents6 sections
- When does funding overtake the round trip taker fee?
- Is this a new finding, or has someone measured it before?
- How much does the break even horizon move between windows?
- Where does the open interest sit today, and what is funding printing?
- How do you check this on your own position?
- What this measurement does not show
TLDR. The cost of holding a bitcoin perp is usually compared venue by venue on the taker fee, and that is the smaller of the two numbers as soon as the position lives longer than a few days. Over the 30 closed days from 2026-09-08 00:00 UTC to 2026-10-08 00:00 UTC, a long on Binance BTCUSDT paid 40.33 basis points of notional in funding against a 10 basis point round trip at the standard taker rate, so the funding bill passed the fee at the 18th of the window's 90 settlements, 136 hours in. The same crossing landed at the 16th stamp on Bitget, the 17th on OKX, the 27th on Bybit and the 150th hourly stamp on Hyperliquid. The horizon is not a constant: across 1,111 rolling 30 day windows of Binance funding since 2025-09-03, cumulative funding was positive in 857 of them and the break even in those sits at a median of 172 hours with a middle half of 146 to 248 hours, while in the other 254 it was negative, so a long collected instead of paying and never broke even at all. On the 2026-10-08 08:00 UTC bar, Athenum's cross exchange view has BTC at $82,901.61 with funding printing negative on Binance, Bybit and OKX, which is the second of those two states, the one where a long is paid to hold.
When does funding overtake the round trip taker fee?
At the 16th to the 27th settlement on an eight hour board, measured over the 30 closed days ending 2026-10-08 00:00 UTC. A taker fee is charged twice, once on the way in and once on the way out, and then it is over. Funding is charged again at every stamp the position is open for, so the two costs are not comparable until a holding period is named, and naming one turns the comparison into a crossing point rather than a ranking.
Venue | Stamps in the window | Funding paid, bps | Round trip fee, bps | Crossed the fee at | Funding as a multiple of the fee |
|---|---|---|---|---|---|
Bitget | 90 | 56.56 | 12.0 | stamp 16, hour 120 | 4.7x |
OKX | 90 | 44.03 | 10.0 | stamp 17, hour 128 | 4.4x |
Binance | 90 | 40.33 | 10.0 | stamp 18, hour 136 | 4.0x |
Bybit | 90 | 36.95 | 11.0 | stamp 27, hour 208 | 3.4x |
Hyperliquid | 720 | 73.69 | 9.0 | stamp 150, hour 149 | 8.2x |
On a $10,000 position those funding bills are $56.56 on Bitget, $44.03 on OKX, $40.33 on Binance, $36.95 on Bybit and $73.69 on Hyperliquid, against round trips of $12, $10, $10, $11 and $9. Every one of the five venues charged a long more in funding over a month than it charged in fees to open and close, by a factor of 3.4 to 8.2.
Two details decide whether that sentence means anything. The first is the unit. Funding is not rent that accrues by the hour; it is a transfer taken from whoever is open at the stamp, which is why the table counts settlements and treats hours as a gloss. A position closed one minute before the 16th Bitget stamp pays 15 settlements and not a fraction more, and hour 120 in the table is the clock reading at which that 16th stamp is charged and the crossing happens, not a point anywhere between the two, and our measurement of when funding is actually charged is the longer version of that point. The second is which venues can be compared at all. Hyperliquid stamps hourly and the other four stamp every eight hours, so the per settlement medians in this window, 0.125 basis points on Hyperliquid against 0.457 on Binance, mean nothing side by side until the interval is normalized, which is the warning in our measurement of funding intervals. The cumulative bill is interval free, so it is the honest unit here.

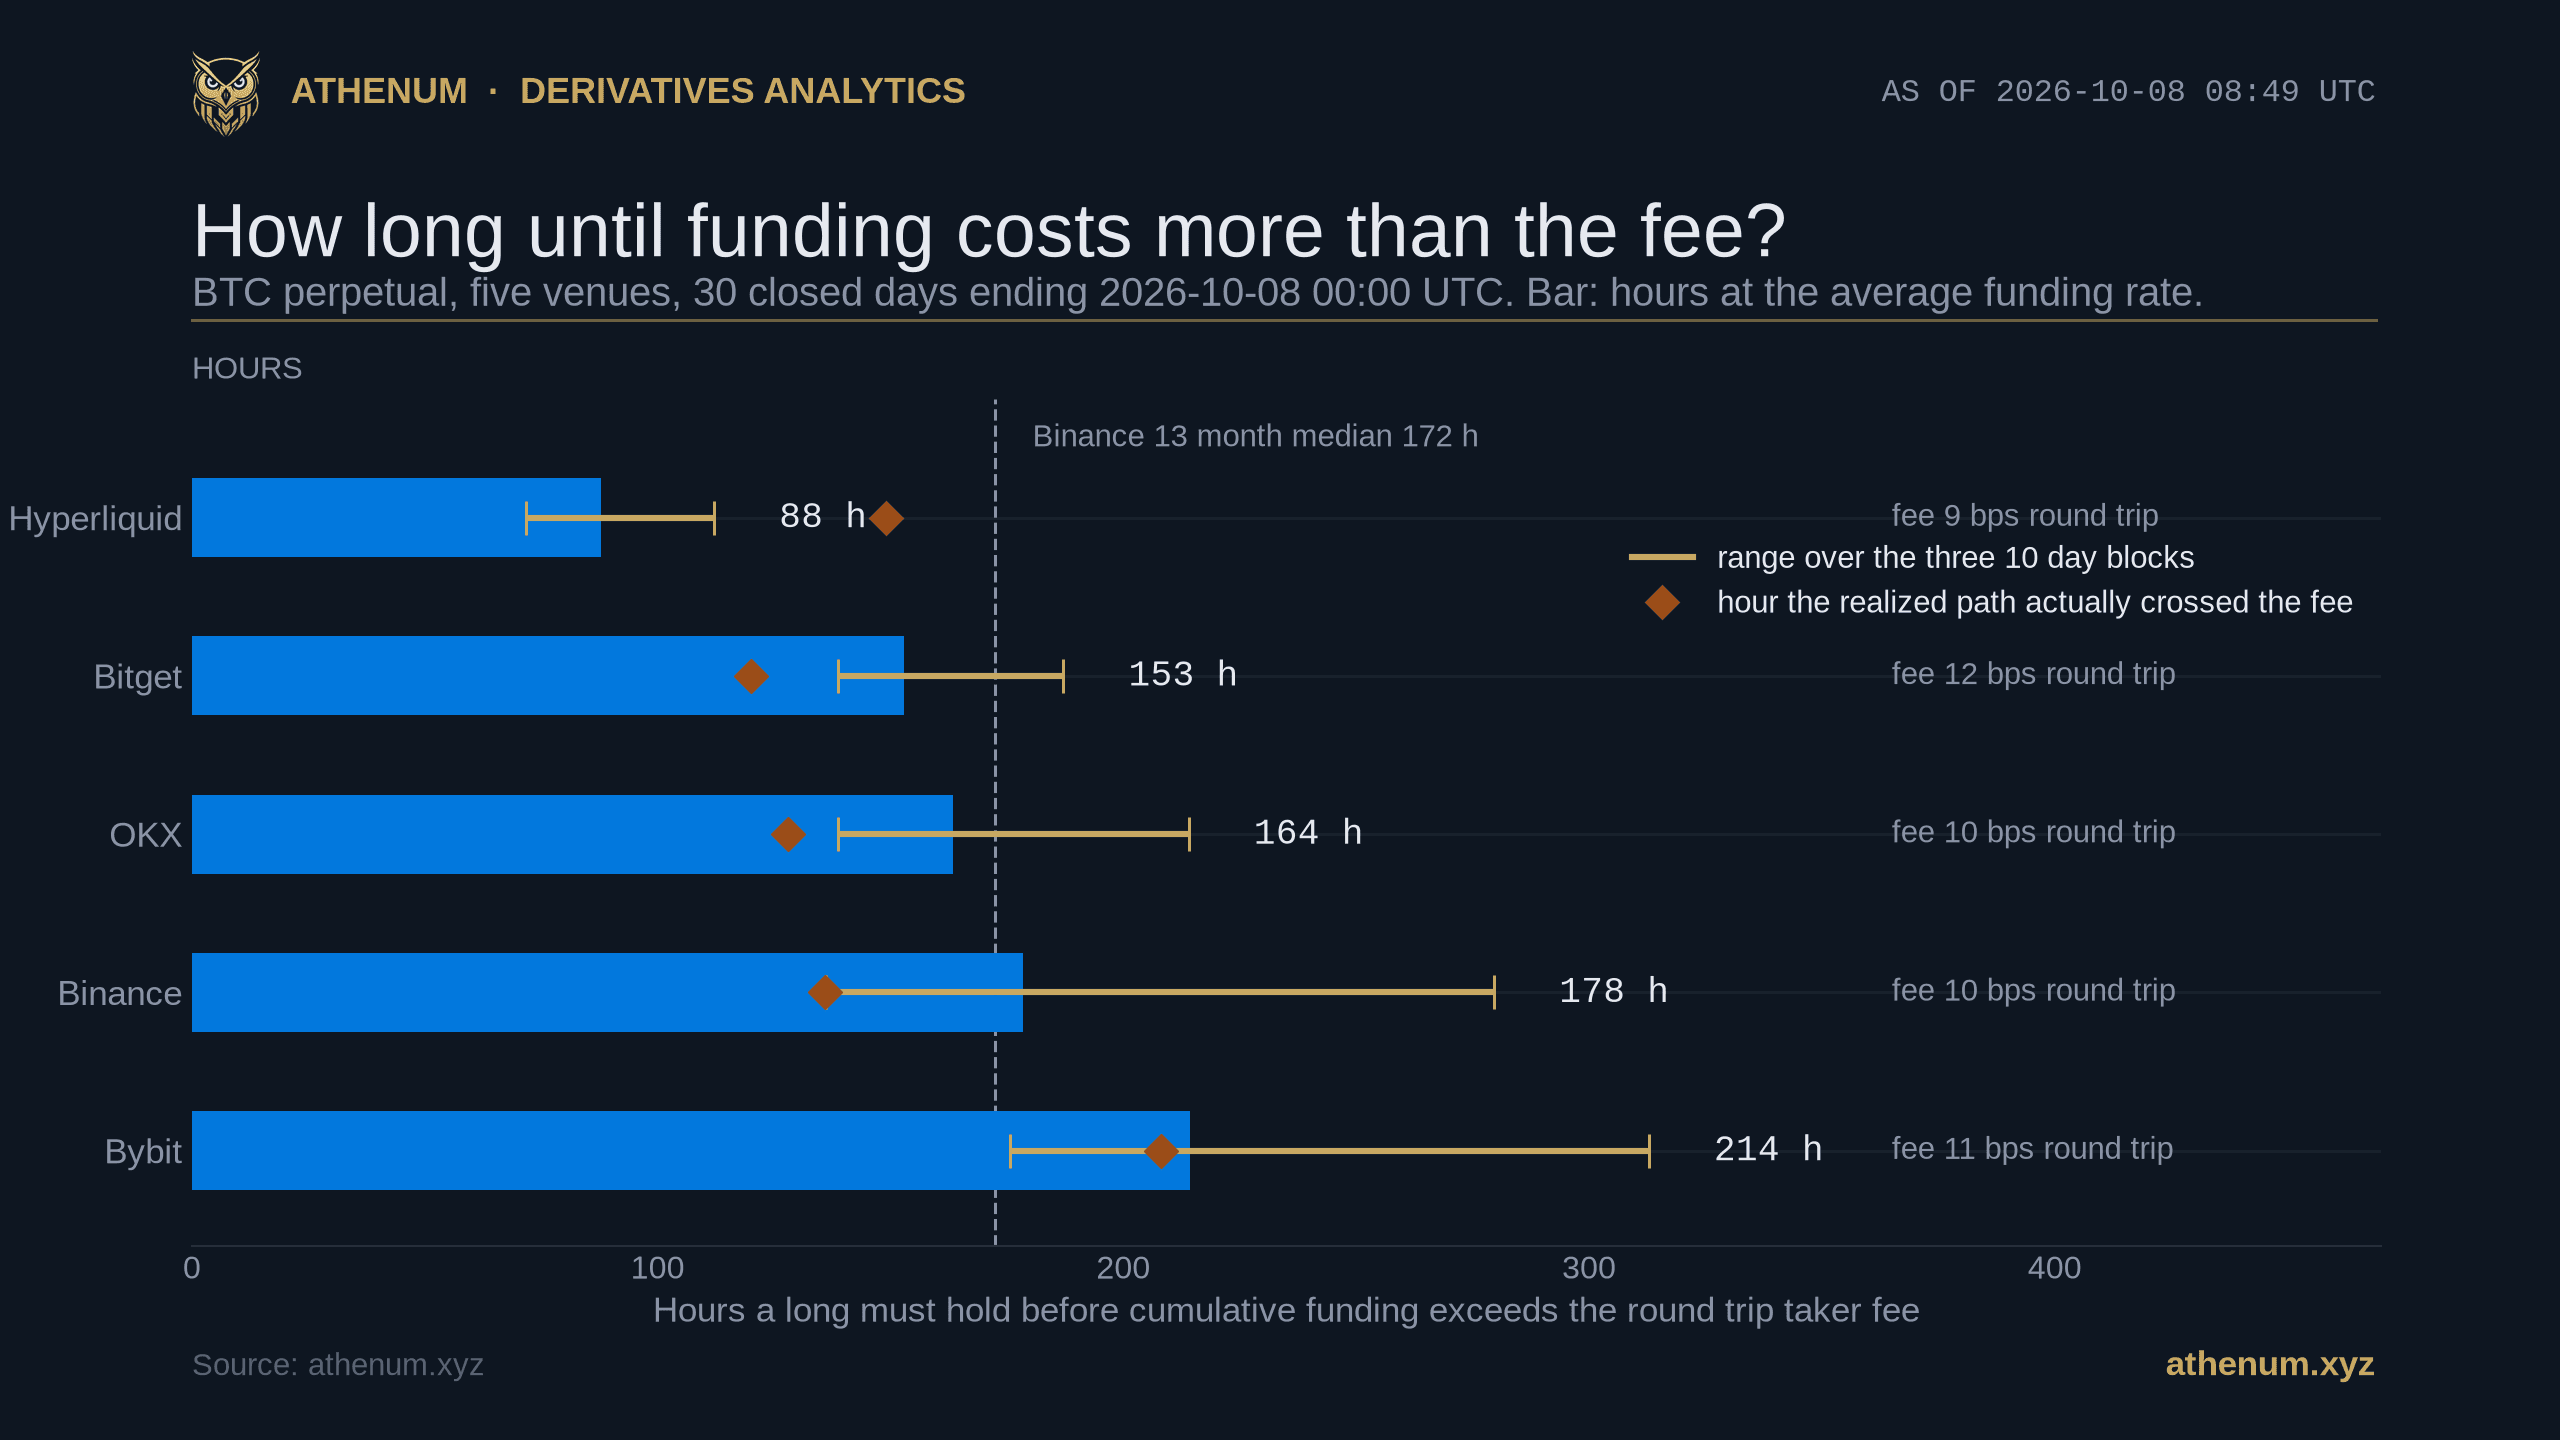
The window runs from 2026-09-08 00:00 UTC to 2026-10-08 00:00 UTC. The path matters as much as the average. Every curve clears the gold fee band inside the first nine days and keeps climbing, but Hyperliquid's crosses at hour 149 even though its average rate over the full window implies 88, because its funding was back loaded into the second half of the month.
That gap is the measurement's own warning. Dividing the fee by the window's average rate gives 88 hours on Hyperliquid, while the realized path did not cross until hour 149. The average rate answers a forward looking question, what a holder should expect if the next month resembles this one, and the crossing answers a backward looking one, when the bill actually arrived. They differ by 69 per cent on the venue with the most volatile funding, and on Bybit they agree within 3 per cent.
Is this a new finding, or has someone measured it before?
It is not new, and two pieces of prior art deserve naming before anything else. Concept211 published the identical metric for Hyperliquid on 2026-08-25, defining it as "how many hours a position has to stay open before funding at that market's median rate equals one taker round trip" and reporting roughly three days on the major native perps (What Hyperliquid Perps Actually Cost). Run on their definition, our own Hyperliquid median of 0.125 basis points an hour against a 9 basis point round trip gives exactly 72 hours, three days to the hour, which reproduces their figure; our headline 88 hours for the same venue is a different statistic, the window's mean rather than its median, and the gap between the two is the subject of the next section. MEXC Learn published the same arithmetic denominated in settlements on 2026-09-21, in Funding Rate Arbitrage in Crypto, as round trip cost divided by the funding rate per settlement. What this post adds is not the metric; it is the cross venue reading of it, the separation of the average rate estimate from the realized path, and the 1,111 window distribution that shows the horizon is not a constant.
Closer to home, the inputs were already ours and the division was not. Our 2026-09-17 measurement published 1.582 per cent of notional paid by a Binance long over 90 days against a 0.10 per cent round trip, and concluded, across all 3,330 individual settlements it sampled on six boards rather than the 270 Binance ones alone, that "zero of the 3,330 settlements reached the cost of the trade that would have avoided them". That is the same arithmetic stopped one step early: it rules out dodging a single stamp, and it leaves the holder's question, how many stamps until the fee stops being the number that matters, unanswered. This post answers that question and finds the answer is unstable, which is the part the earlier framing could not have shown from one window.
How much does the break even horizon move between windows?
Enough that a single number is misleading. Running the same calculation on every 30 day window of Binance BTCUSDT funding since 2025-09-03 gives 1,111 overlapping windows. In 857 of them cumulative funding was positive and the break even against a 10 basis point round trip has a median of 172 hours, a middle half of 146 to 248 hours, a shortest of 114 hours and a ninetieth percentile of 355 hours. Not one of the 1,111 windows produced a break even as short as the 88 hours this month's Hyperliquid average implies, which is a reason to read that figure as a venue effect rather than a market wide one.

The 857 windows that broke even, with the median at 172 hours and the middle half from 146 to 248. The 254 windows with negative cumulative funding are not in the histogram because they have no break even to plot. Counted on the same base, 446 of the 1,111 windows broke even only after more than a week and another 254 never broke even at all, so 700 of them, 63.0 per cent, were not square inside seven days.
The 254 windows without a break even are the ones worth reading carefully, and they are not 254 independent events. Every one of them starts inside a single stretch of 86 calendar dates between 2026-01-28 and 2026-04-23, so the honest statement is that one episode in thirteen months made a Bitcoin long a net receiver of funding for a month at a time, not that it happens 23 per cent of the time. Overlapping windows inflate counts; they do not invent episodes. The same caution applies to the median: 1,111 windows drawn from 13 months of settlements is closer to 13 independent months than to 1,111 independent draws.
Where does the open interest sit today, and what is funding printing?
On the 2026-10-08 08:00 UTC bar, Athenum's cross exchange view puts Bitcoin at $82,901.61 and Bitcoin perpetual open interest at $7.94B on Binance, $4.82B on Bybit, $3.32B on Hyperliquid, $3.01B on Bitget, $2.59B on OKX and $0.82B on Deribit. Those named legs sum to $22.50B while the feed's own aggregate field reads $22.68B for the same bar, 0.80 per cent higher, so no share here is taken against that aggregate field. The weighting below runs over the five venues that carry a break even row and their $21.68B, which excludes Deribit for the reason given in the limits section.

Open interest and funding on the same bar, with every venue's funding converted to a common eight hour basis so an hourly board and an eight hourly board can sit in one panel. Binance, Bybit and OKX are negative at this instant, which is the state in which a long is paid to hold. The Deribit funding bar is one instantaneous hourly read on a board whose published history returns exactly zero in 190 of the 719 hourly rows it serves for this window, one short of the window's 720 hours because its series starts an hour in, so it is shown but not relied on.
On that base, weighting each venue's break even by its share of the $21.68B gives 167 hours on the average rate basis and 151 hours on the realized path basis, so the position weighted holder of a Bitcoin perpetual crosses the fee after about six and a quarter to seven days. Funding is negative on Binance, Bybit and OKX at this instant, which is the reminder that the crossing is a tendency and not a schedule: a long opened into this bar is being paid, and the clock on its fee crossing is running backwards.
How do you check this on your own position?
1. Pull the venue's funding history, not its current rate. Binance publishes it at /fapi/v1/fundingRate, Bybit at /v5/market/funding/history, OKX at /api/v5/public/funding-rate-history, Bitget at /api/v2/mix/market/history-fund-rate and Hyperliquid at its /info endpoint with type fundingHistory. All five are public and none asked for a key.
2. Fix a closed window. Every funding figure in this post comes from the window that ends at 2026-10-08 00:00 UTC, so the last stamp in it is 2026-10-07 16:00 UTC on the four eight hour boards and 2026-10-07 23:00 UTC on Hyperliquid, and nothing in that sample can move after publication. The open interest and the funding snapshot in the section above are deliberately outside it: they are read live from the 2026-10-08 08:00 UTC bar.
3. Add the rates in sequence rather than averaging them. The cumulative sum is what a holder paid; the average is a forecast dressed as a measurement, and the two disagreed by 69 per cent on Hyperliquid this month.
4. Compare that running total with your own round trip, not the standard one. The rates used here are the standard non discounted taker rates of 0.05 per cent on Binance and OKX, 0.055 on Bybit, 0.06 on Bitget and 0.045 on Hyperliquid. A VIP tier or a maker fill lowers the fee and pulls the crossing earlier, and the free Athenum funding rate calculator will turn a rate and an interval into an annualized cost while the free profit and loss calculator carries the funding leg and the fee on the same trade.
5. Repeat it on several windows before trusting the number. One window is one draw: the same calculation on 1,111 of them spans 114 hours to never.
What this measurement does not show
It does not show a cost of ownership. Funding and fees are two line items; price risk, slippage on entry and exit, and the margin the position ties up are not counted anywhere above, and they dominated both over this window. Read at the window's own settlement stamps, Binance's mark price opened the window at $79,075.90 and stood at $83,412.01 at the last stamp, and the lowest and highest marks at any stamp in between were $75,600.00 on the ninth day and $86,584.62 on the fifteenth. That is a span of 14.5 per cent from the lowest stamp to the highest, and a move of 5.5 per cent on the position itself from the first stamp to the last, in the long's favour, while funding took 40.33 basis points off that same long the whole time. The small line items are what this post measures, and they are not the ones that decided the month.
It does not show a reason to pick a venue. The whisker on the cover chart is the same calculation on the window's three 10 day blocks, and it runs 136 to 280 hours on Binance alone, which is wider than the gap between Binance and Bitget. That lower bound landing on the same 136 as Binance's realized crossing is a coincidence of this window, not a property of the method. Ranking five venues on a figure whose own sub windows overlap that much is exactly the kind of league table this measurement argues against.
It does not include Deribit in the comparison. Deribit does not settle at a stamp at all. Its funding is quoted as an eight hour rate but accrues continuously and is swept to the cash balance at the daily settlement rather than at a funding stamp, and its formula carries no interest rate term at all, damping a small premium to exactly zero instead of flooring it, which is why its public history returns exactly 0.0 in 190 of the 719 hourly rows it serves for this window. Each of those rows is one hourly sample of the rate, not a day's accrual, so the count says how often the quoted rate was zero and not how often a holder paid nothing. A board with no settlement count cannot carry a column whose unit is the settlement count, so it does not get a row in the break even table. Its open interest leg and its single live funding print appear in the chart of today's bar, where both are labelled for what they are, because neither carries a cumulative claim.
The 1,111 window distribution is Binance only. The cross venue reading is a single month on five boards, and the distribution that shows how much the horizon moves comes from one of them, so the two halves of this post rest on different samples and neither extends the other.
It is one asset. The Bitcoin perpetual is the most liquid contract on every board here, and funding on a thin altcoin perpetual is both larger and more volatile, so the crossing on those contracts arrives sooner and moves more.
The venue cost side is a standard rate, read from each venue's public fee schedule on the day of publication. Fee tiers, token discounts and maker rebates all move the crossing, and none of them is in the table.
Not one of the funding endpoints behind this post asked for a key, so anyone can rebuild the five venue half of it from scratch. Today's open interest and cross exchange funding come from Athenum's own normalized feed over Binance, Bybit, OKX, Bitget, Hyperliquid and Deribit, and the 35 calculators sitting beside it stay free to use, with no account, no email and no usage limits. A free 7 day Pro+ trial at app.athenum.xyz opens the terminal those cross exchange readings come from; it asks for no card and expires on its own.
One terminal. All the data.
Liquidations, orderbook depth, whale walls & open interest from 4 exchanges, all real-time, in one place.
No credit card required

Athenum Analytics
Athenum Analytics is our three-person editorial team covering crypto derivatives, market data and macroeconomic context.