Table of Contents8 sections
- Where does Bitcoin option open interest actually sit on the strike ladder?
- Is that concentrated or dispersed?
- How much does the number move if you ask it expiry by expiry?
- Do round strikes really hold more, or were they just listed first?
- What does any of this mean for max pain?
- Does the perpetual board look the same?
- How do you measure this yourself?
- What this does not show
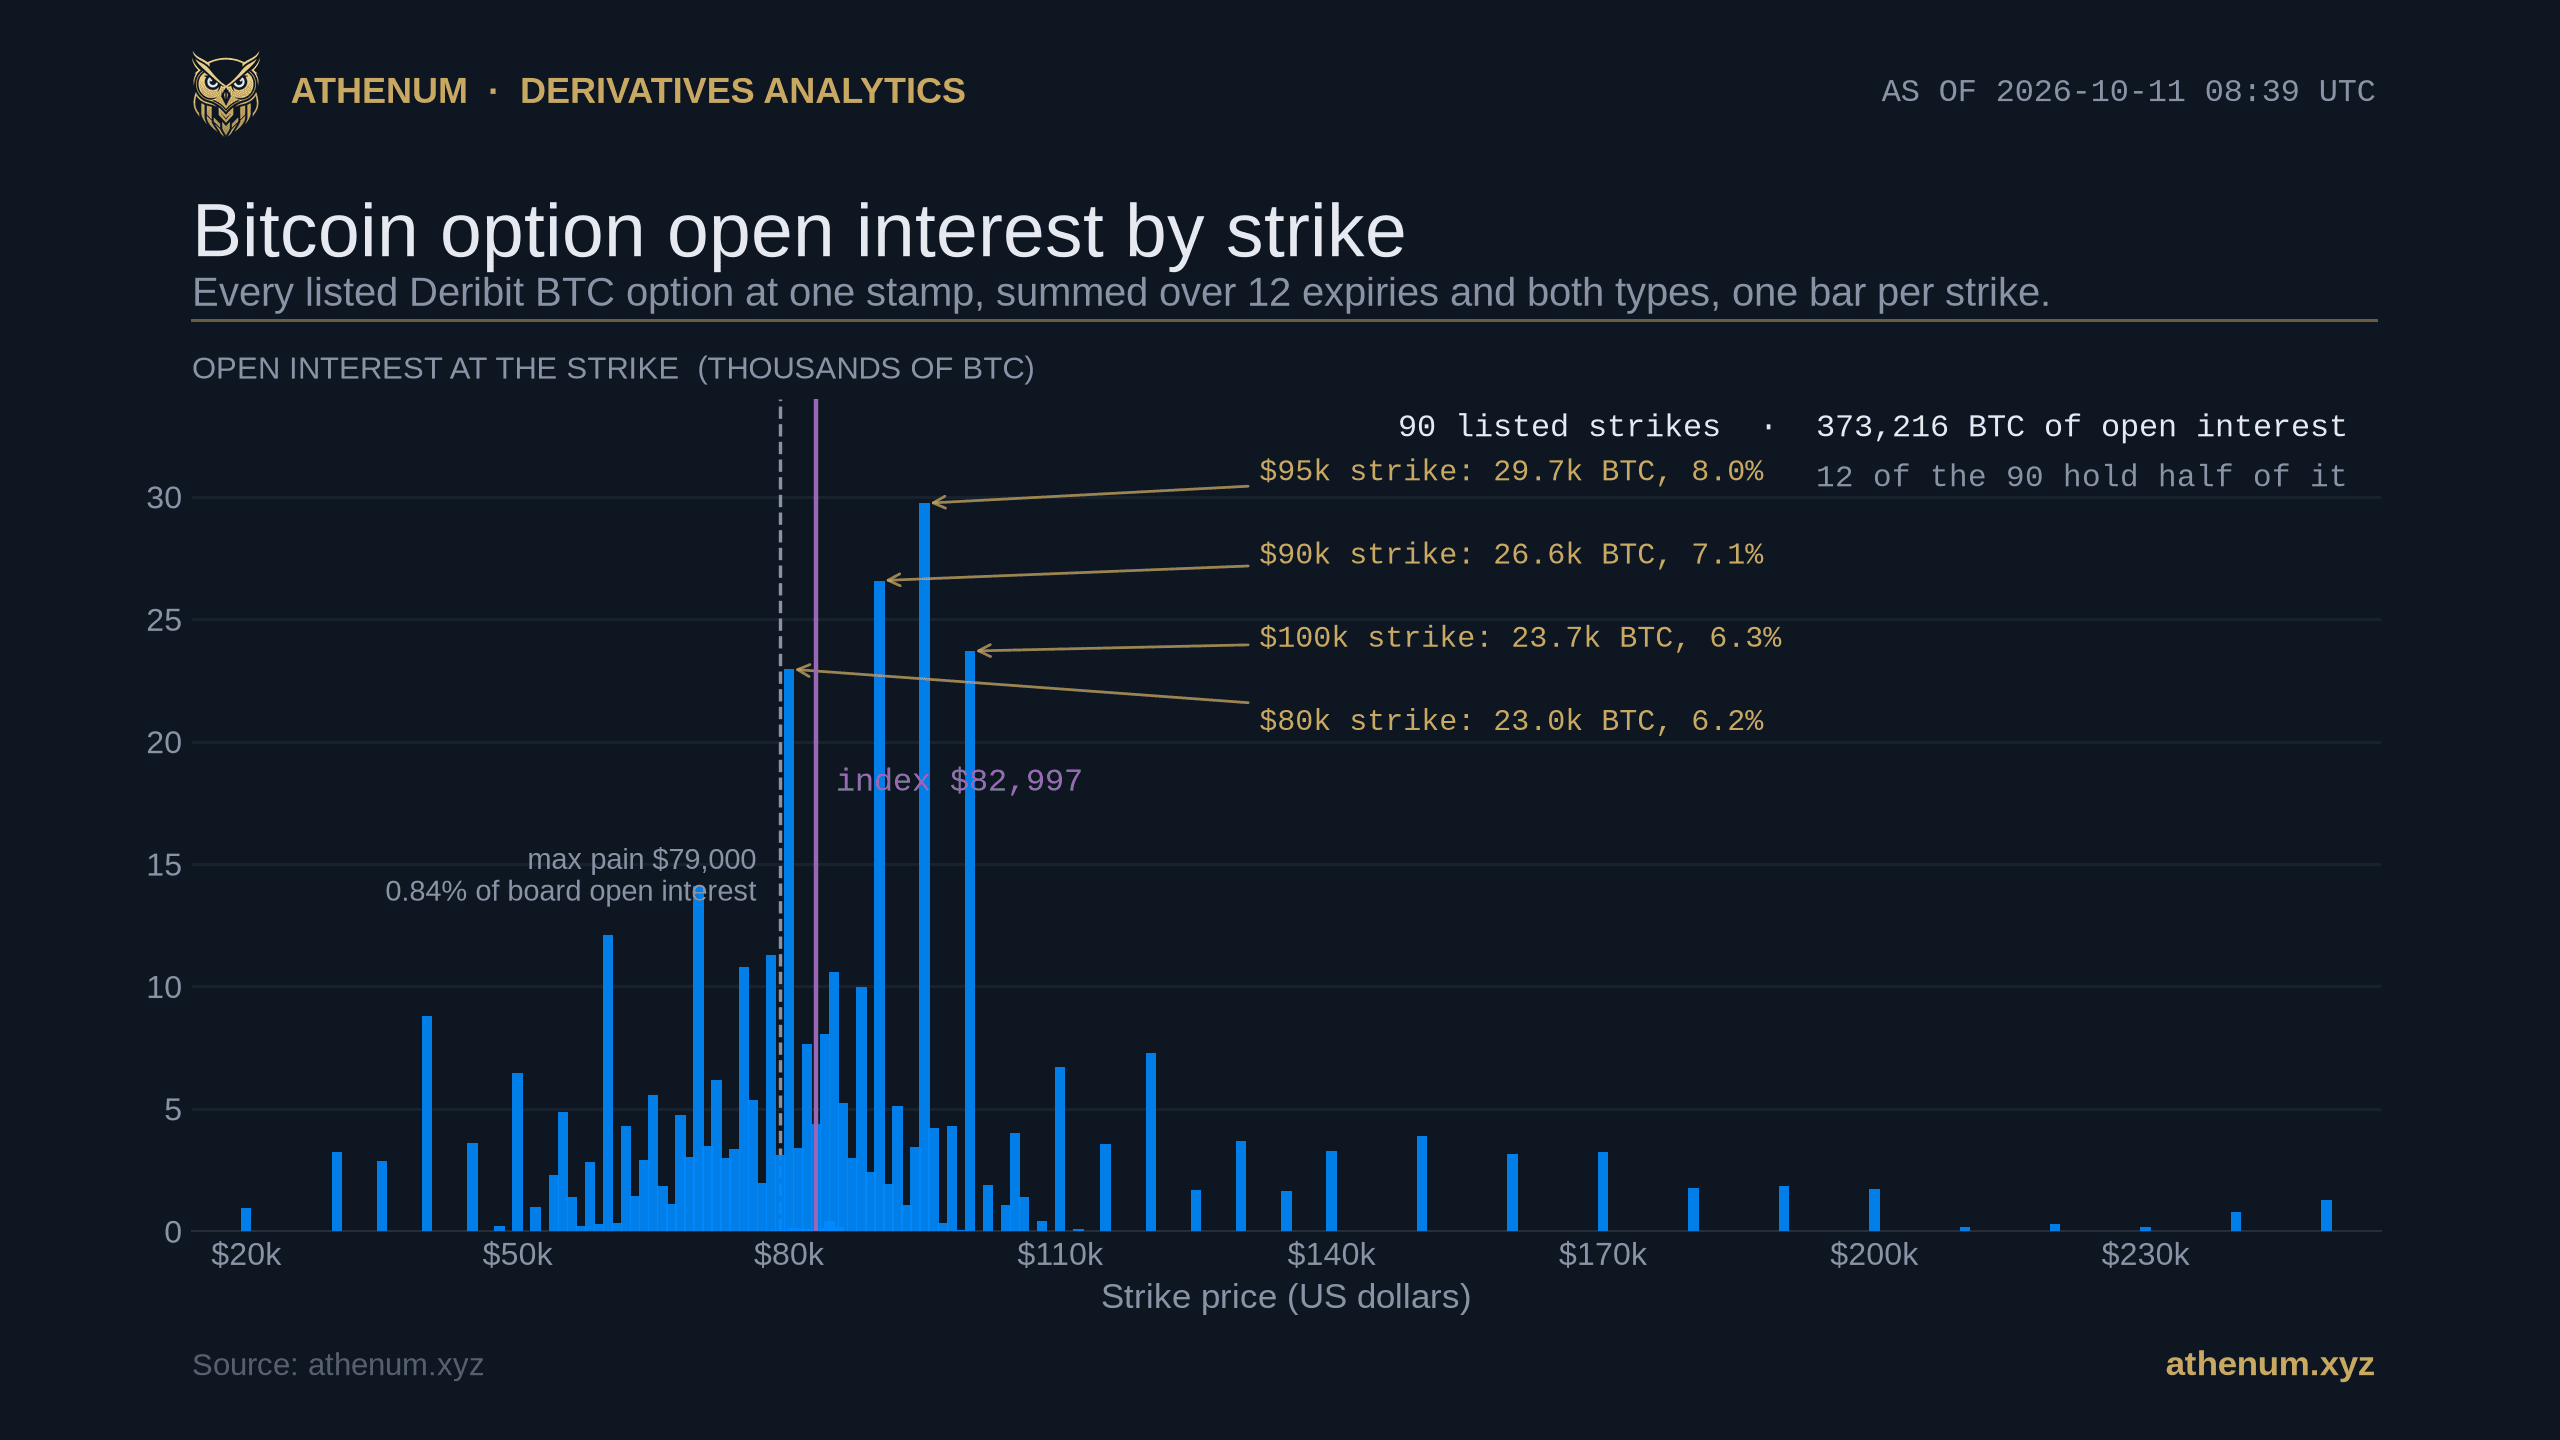
TLDR. On 2026-10-11 at 08:39 UTC the full Deribit Bitcoin option board carried 373,216 BTC of open interest across 930 listed contracts, 90 distinct strikes and 12 expiries. The heaviest single strike, $95,000, holds 8.0 percent of it. Twelve strikes hold half, thirty five hold eighty percent, and the Herfindahl index of the strike shares is 0.03136, which is an effective 31.9 strikes out of the 90 listed. The max pain strike that day, $79,000, holds 0.84 percent of board open interest and sits $16,000 below the heaviest strike. Read by moneyness rather than by rung, the same board is concentrated around spot: 67.7 percent of all open interest sits on the 43 strikes between 0.8 and 1.25 of the index. That is a real tilt and a modest one, 1.42 times those strikes' share of the ladder, and it is weaker than simply taking the 43 heaviest strikes, which hold 87.2 percent. Both readings are true, and a post that gives you only one of them is hiding the other.
Where does Bitcoin option open interest actually sit on the strike ladder?
It sits on about a third of the ladder, with no single rung dominant. Read at 2026-10-11 08:39 UTC from the full Deribit BTC option board, with the index at $82,997:
- 930 listed contracts, 90 distinct strikes, 12 expiries, 373,216 BTC of open interest. Strikes run from $20,000 to $250,000. Not one of the 90 strikes is empty. - The heaviest strike, $95,000, carries 29,734 BTC, which is 8.0 percent of the board. The next three are $90,000 at 7.1 percent, $100,000 at 6.3 percent and $80,000 at 6.2 percent. - Twelve strikes carry half of the open interest; thirty five carry eighty percent. The top five carry 31.4 percent, the top ten 46.0 percent, the top twenty 64.1 percent. - The spread between strikes is wide. The median strike holds 2,885 BTC, the middle half of strikes hold between 687 and 4,785 BTC, and the heaviest holds 29,734. A mean would be a useless summary of that shape, which is why every figure here is a median or a share. Quartiles throughout this post use the exclusive, Weibull plotting position; the convention most spreadsheets default to puts the same middle half at 823 to 4,665 BTC. - Summed into one index, the Herfindahl of the strike shares is 0.03136, the sum of each strike's squared share. Its reciprocal, 31.9, is the number of equally sized strikes that would produce the same index, against 90 actually listed.
The ETH board the same second says almost the same thing in different units: 86 strikes, 1,392,686 ETH of open interest, heaviest strike $2,500 at 7.7 percent, and 11 strikes to reach half. Two boards with different tick grids, different index levels and different holders landing within one strike of each other is weak evidence that the shape is a property of how options are listed and traded rather than of Bitcoin.
Is that concentrated or dispersed?
Both, and the difference is which axis you measure. This matters because the published record already says open interest is concentrated: Johnson, Liang and Liu, in *What Drives Index Options Exposures?* (Review of Finance, 2018), document that out of the money puts are the dominant component of open positions in US index options. That is a statement about moneyness. The 31.9 of 90 above is a statement about rungs. Here is the same 2026-10-11 board cut the second way:
Strike as a multiple of the index | Strikes listed | Share of board open interest | Median strike (BTC) | Middle half of strikes (BTC) |
|---|---|---|---|---|
Below 0.80 | 21 | 18.1% | 2,820 | 969 to 4,578 |
0.80 to 0.95 | 13 | 18.3% | 3,494 | 2,471 to 8,486 |
0.95 to 1.05 | 16 | 18.6% | 3,047 | 133 to 7,046 |
1.05 to 1.25 | 14 | 30.7% | 3,823 | 1,667 to 13,421 |
1.25 to 2.00 | 17 | 11.2% | 1,688 | 257 to 3,785 |
2.00 and above | 9 | 3.0% | 1,292 | 243 to 1,794 |
Forty three of the 90 strikes, those between 0.8 and 1.25 of the index, carry 67.7 percent of the open interest; the rounded rows above sum to 67.6, and the difference is rounding, not a second measurement. So the board is concentrated by moneyness and dispersed by rung at the same time, and the two readings do not contradict each other.
One control belongs here before the moneyness reading is allowed to sound impressive. Forty three strikes is 48 percent of the ladder, so a selection of 43 strikes that carried no information at all would hold 48 percent of the open interest, and the 43 heaviest strikes, chosen by open interest rather than by distance from spot, hold 87.2 percent. The moneyness band is therefore a 1.42 to one tilt, well short of what ranking by size alone achieves. Part of even that is listing density rather than positioning: Deribit lists strikes more finely near spot, so the band contains more rungs per dollar of price than the tails do.
Where this board does depart from the index option literature is direction. Johnson and co-authors find downside puts dominant; on Deribit at this stamp the single largest block is out of the money calls at 50.1 percent of open interest, against 33.4 percent in out of the money puts, with in the money calls at 13.1 and in the money puts at 3.4. The heaviest bucket in the table is the one from 5 to 25 percent above the index, not the one below it. Two cautions on that comparison: it is a one stamp reading of one venue rather than a trend, and the two figures are not the same object, since the published finding is about position value in US index options while 50.1 percent here is a share of contract count on a retail heavy, Bitcoin settled board. With both caveats stated, the tilt still runs the opposite way to the one a reader arriving from equity index research would expect.

The same instant on both Deribit boards. The dotted diagonal is the board where every listed strike holds the same open interest; the distance between it and each curve is the concentration. BTC needs 12 strikes to cover half and 35 to cover 80 percent, ETH needs 11 and 27, and the two curves sit close enough together to be hard to tell apart over the first fifth of the ladder.
How much does the number move if you ask it expiry by expiry?
By an order of magnitude, and that is the limit on everything above. The 8.0 percent top strike share is one number computed on the board as a whole. Computed separately for each of the 12 expiries on the same 2026-10-11 data, the top strike's share of its own expiry runs from 6.1 percent to 60.4 percent, with a median of 14.9 percent. The number of strikes needed to cover half of an expiry runs from 1 to 13.

The dispersion of this post's own headline measure. The expiries that look most concentrated are the ones with almost nothing in them: 14 October holds 170 BTC in total and one strike holds 60.4 percent of that, and 15 October holds under 1 BTC. The three expiries above 25 percent hold 3,816 BTC between them, 1.0 percent of the board, so the whole board figure of 8.0 percent is carried by the large expiries and the extremes are noise, not counter-examples.
The explanation is mostly mechanical and worth stating rather than leaving in the chart: concentration tends to rise as open interest falls, because a nearly empty expiry has few positions to spread. Across the 12 expiries the rank correlation between an expiry's open interest and its top strike share is minus 0.56, which on twelve points is a tendency rather than a law, and 30 October is the visible exception. The three expiries printing above 25 percent hold 3,816 BTC between them on 2026-10-11, which is 1.0 percent of the board. The two heaviest expiries, 30 October with 140,897 BTC and 25 December with 126,369 BTC, print 17.9 and 8.7 percent and need 7 and 12 strikes to cover half. A single whole board number is therefore the right summary for the question "where is the open interest", and the wrong summary for "how concentrated is a given expiry".
Do round strikes really hold more, or were they just listed first?
They hold more per listed contract, and most of that gap turns out to be how long they have been listed. Split the 90 strikes on 2026-10-11 by the coarsest round number each one divides into:
Grid class | Strikes | Share of strikes | Share of open interest | Median per listed contract | Median strike age |
|---|---|---|---|---|---|
Multiples of $10,000 | 24 | 26.7% | 42.4% | 961 BTC | 290 days |
Multiples of $5,000 only | 11 | 12.2% | 21.2% | 963 BTC | 289 days |
Multiples of $1,000 only | 47 | 52.2% | 36.2% | 390 BTC | 159 days |
Finer than $1,000 | 8 | 8.9% | 0.3% | 33 BTC | 3 days |
The raw tilt is 1.59 to one: 26.7 percent of the strikes hold 42.4 percent of the open interest. It survives the first obvious control. A round strike tends to be listed across more expiries than a $1,000 grid one, so dividing each strike's open interest by the number of expiries it is listed on removes that advantage, and the gap stays: 961 BTC per listed contract on the $10,000 grid against 390 on the $1,000 grid.
It largely dissolves under the second control, and this is the honest part. Round strikes on this board are old and $1,000 grid strikes are new. The median $10,000 strike was created 290 days before the stamp; the median $1,000 strike 159 days; the eight sub thousand strikes, three days. Across all 90 strikes, open interest correlates 0.590 with the number of expiries a strike is listed on and 0.468 with its age in days. So divide again, this time by age. Computing each strike's own open interest per listed contract per day since it was created, then taking the median of those rates within each class, gives 3.63 BTC on the $10,000 grid, 3.33 on the $5,000 grid, 2.85 on the $1,000 grid and 11.30 on the sub thousand strikes. That is a median of ratios rather than the ratio of the medians in the table above, so dividing 961 by 290 will not reproduce it. The 2.47 to one gap becomes 1.27 to one, and the newest class, which holds 0.3 percent of the board, has the highest rate of all. Restricting to the 0.8 to 1.25 moneyness band does not rescue it either: the four $10,000 strikes in that band are listed on a median 10 expiries and are 290 days old, the 28 $1,000 grid strikes on 7.5 expiries and 128 days, and all 39 non $10,000 strikes in the band have a median age of 73 days.
So the finding is that round strikes carry more open interest per contract on this board, that most of that gap is explained by how long they have been listed, and that a single snapshot cannot distinguish whatever remains from a preference for round numbers. The per day figures are themselves crude, since they assume open interest accumulates at a constant rate from the day a contract is listed, which it does not. The grid is not a new suspect. Koch and Lazarov, in a Bonn working paper on the DAX index options market, found that strikes ending in 00 were traded more than strikes ending in 50 and added the granularity of the strike grid, and the substitutability between neighbouring strikes it creates, to the existing behavioural explanations rather than replacing them: their account rests on the negotiation hypothesis of Harris and the price resolution hypothesis of Ball, Torous and Tschoegl. A footnote in the same paper reports, on private correspondence rather than their own data, that the clustering is generally not observed in US index options, which is a reason to treat this as a venue property rather than a law. Round number clustering in Bitcoin itself is separately established: Urquhart, in *Price clustering in Bitcoin* (Economics Letters, 2017), found that over 10 percent of Bitcoin prices ended in the decimal digits 00. Neither result settles what causes the tilt on the strike ladder, and one snapshot cannot.

The control and its limit in one picture. The lower panel removes the advantage a round strike gets from being listed on more expiries, and the gap between the $10,000 grid and the $1,000 grid survives it at 961 against 390 BTC per contract. The age labels are why that is not proof of a preference: the $10,000 strikes have had a median 290 days to accumulate and the $1,000 grid strikes 159, and dividing by age shrinks the gap to 1.27 to one.
What does any of this mean for max pain?
It means the single strike is a lossy summary, not a wrong one. Max pain is the strike at which the total payout owed to option holders would be smallest if the underlying settled there, computed over the whole ladder. On this board on 2026-10-11 it is $79,000. That strike holds 3,120 BTC, which is 0.84 percent of board open interest, and it sits $16,000 below the heaviest strike at $95,000, which is 20.3 percent above it. Widen the window to plus or minus 5 percent around it and you capture 12 strikes and 15.1 percent of the board.
None of that makes max pain wrong on its own terms. It is a payoff weighted statistic over every strike, so it is not supposed to land on the heaviest one, and Athenum's own explainer on max pain in crypto options sets out the arithmetic in full. What the numbers above do establish is how much is discarded in the compression: one number stands in for a distribution across 90 rungs whose middle half spans 687 to 4,785 BTC.
It is worth knowing what the research literature uses instead, because it is not max pain. Ni, Pearson and Poteshman, in *Stock Price Clustering on Option Expiration Dates* (Journal of Financial Economics, 2005), measured clustering of equity closing prices at strikes on expiration days and attributed it to two channels, hedge rebalancing by option market makers and stock price manipulation by proprietary traders at the firms writing the options. Weiss, Gaudiosi, Zhou and Webb, in *Bitcoin option expiration, gamma exposure, and intraday price reversals* (Finance Research Letters, 2026), tested Deribit expirations over 2021 to 2023 and found intraday reversals that were strongest when at the money open interest was high and estimated gamma exposure negative. Both use the shape of the ladder, through at the money open interest and gamma exposure, rather than a single payoff minimizing strike. The framing in this post is not new either: Bhuyan and Chaudhury, in *Trading on the information content of open interest* (Derivatives Use, Trading and Regulation, 2005), proposed, by conjecture rather than proof, that the distribution of open interest across strikes be read as a probability distribution over settlement prices, and built an open interest weighted mean strike from it. What is new here is the measurement on a crypto board.
If you want to price the contracts behind these strikes yourself, the free Black-Scholes calculator takes a strike, a spot, a time to expiry and a volatility, and the options profit calculator runs the payoff at settlement. Neither asks for an account.
Does the perpetual board look the same?
No, and the contrast is the point of measuring both. Athenum's normalized cross venue feed on the 2026-10-11 08:00 UTC bar, with Bitcoin at $83,002, puts perpetual open interest across the six venues it names at $21.68 billion: Binance $7.72B at 35.6 percent, Bybit $4.67B at 21.5, Hyperliquid $3.16B at 14.6, Bitget $2.81B at 13.0, OKX $2.49B at 11.5 and Deribit $0.83B at 3.8. The Herfindahl of those shares is 0.2259, an effective 4.43 venues out of 6.
Put the two boards in the same unit and the comparison inverts the intuition. The perpetual board spreads its open interest over an effective 4.43 of 6 available venues, which is 73.8 percent of the maximum dispersion on offer. The option board spreads its open interest over an effective 31.9 of 90 available strikes, which is 35.4 percent. So relative to the choices actually listed, Bitcoin option open interest is the more concentrated of the two, even though the strike ladder has fifteen times as many places to sit. The comparison is a ratio of effective counts to available ones, not a claim that a strike and a venue are the same kind of choice: a trader picks a venue to express the same exposure somewhere else and a strike to express a different exposure, and the two sides here are different units, BTC contracts against dollar notional, read about forty minutes apart. Our earlier post on venue level open interest concentration works the venue side of this through in detail, including why the counting convention moves the index.
Two disclosures belong next to those venue numbers rather than in a footnote. The feed also carries its own total field, which on this bar runs 0.79 percent above the sum of the six venues it names; this post quotes the sum it can itemize and makes no claim about the difference. And Bybit's default open interest field counts both sides of each contract, which our feed passes through unchanged, so Bybit's 21.5 percent is an upper bound rather than a like for like figure. That bias runs in favour of the comparison above rather than against it: halving Bybit's leg moves the effective venue count from 4.43 to 4.17, which is 69.4 percent of the maximum rather than 73.8, still about double the option board's 35.4.

The same question asked of the perpetual board on the same morning. Deribit, whose option board every other number in this post comes from, is the smallest perpetual book shown here at $0.83B and 3.8 percent of the named total, which is a useful reminder that the venue with the deepest option board is not the venue with the deepest perpetual one.
How do you measure this yourself?
Five steps, no key required for the option half:
1. Pull the board. `GET https://www.deribit.com/api/v2/public/get_book_summary_by_currency?currency=BTC&kind=option` returns every listed contract with open interest, volume and quotes. `get_instruments?currency=BTC&kind=option&expired=false` returns each contract's strike, expiry, creation timestamp and tick size. Join them on `instrument_name`. 2. Sum to the strike, not to the contract. Add the open interest of every call and put at a strike across every expiry. That is the object this post measures; a per contract table answers a different question. 3. Rank and accumulate. Sort strikes by open interest, take the running total, and read off how many strikes reach 50 and 80 percent. Report the median and the interquartile range of the per strike values alongside, because the distribution is right skewed and a mean will mislead. 4. Compute the Herfindahl of the shares. Square each strike's share of the total and add them up. The reciprocal is the effective number of strikes, which is the figure worth quoting because it is comparable across boards with different numbers of rungs. 5. Control before you conclude. Divide each strike's open interest by the number of expiries it is listed on, and pull `creation_timestamp` for the strike's oldest contract. If the classes you are comparing differ in age or in listing breadth, say so, because those two variables correlate 0.468 and 0.590 with strike open interest on this board.
What this does not show
It is one instant on one venue. Everything above was read between 08:39 and 08:40 UTC on 2026-10-11, and open interest moves continuously. The concentration measures are the stable half: the composition of the top twelve strikes changes slowly, while the per expiry extremes change daily. Nothing here should be quoted back as a current number next week.
It is Deribit alone. Deribit is the largest crypto native options venue and the one whose full board is readable without a key, which is why it is the board measured here, but it is not the whole Bitcoin options market: options on US listed spot Bitcoin ETFs carry a large share of the total, and other venues run books of their own. That is taken from public reporting rather than measured here, which is why it is stated as a direction and not a number.
The round number finding is a correlation on 90 points. Age, listing breadth and distance from spot all move together on this board, and one snapshot cannot separate them. A clean test would track newly listed round and $1,000 grid strikes from their creation date forward, which is a different measurement and not one a single capture can make.
The moneyness table is computed against the Deribit BTC index at a single second. A strike sitting a tenth of a percent either side of a bucket boundary moves between rows on a normal day's price action, and the two smallest buckets are the most fragile for that reason.
Open interest is a count of outstanding contracts, not a direction. A large position at $95,000 says nothing about whether the holder is long or short that strike, or whether it hedges something else entirely. Nothing above should be read as a forecast, and the published pinning literature cited earlier measures effects that are real but small at the level of a single stock, an average 16.5 basis points of return on an expiration date, even though the same study puts the aggregate market capitalization shifted at around 9 billion dollars per expiration.
Every strike, expiry and open interest figure above came from Deribit endpoints that asked for no key, so the option half of this post can be rebuilt from scratch in an afternoon. The cross venue perpetual numbers come from Athenum's own normalized feed reading Binance, Bybit, OKX, Bitget, Hyperliquid and Deribit onto one clock, and the 37 free tools beside it, 35 of them calculators, ask for no account, take no email address and cap nobody's usage. The terminal those cross exchange readings come from opens on a free 7 day Pro+ trial at app.athenum.xyz, which takes no card and ends by itself.
One terminal. All the data.
Liquidations, orderbook depth, whale walls & open interest from 4 exchanges, all real-time, in one place.
No credit card required

Athenum Analytics
Athenum Analytics is our three-person editorial team covering crypto derivatives, market data and macroeconomic context.