Range analysis and acceptance · 4 / 5
Calculate volume profile and VWAP from the same sample
Volume profile asks where activity was concentrated. VWAP asks for the volume-weighted average price over a chosen window. The busiest price and the average price can differ substantially, and that disagreement can describe the distribution rather than a broken indicator.
Athenum8 minUpdated:
Compare a distribution with an average
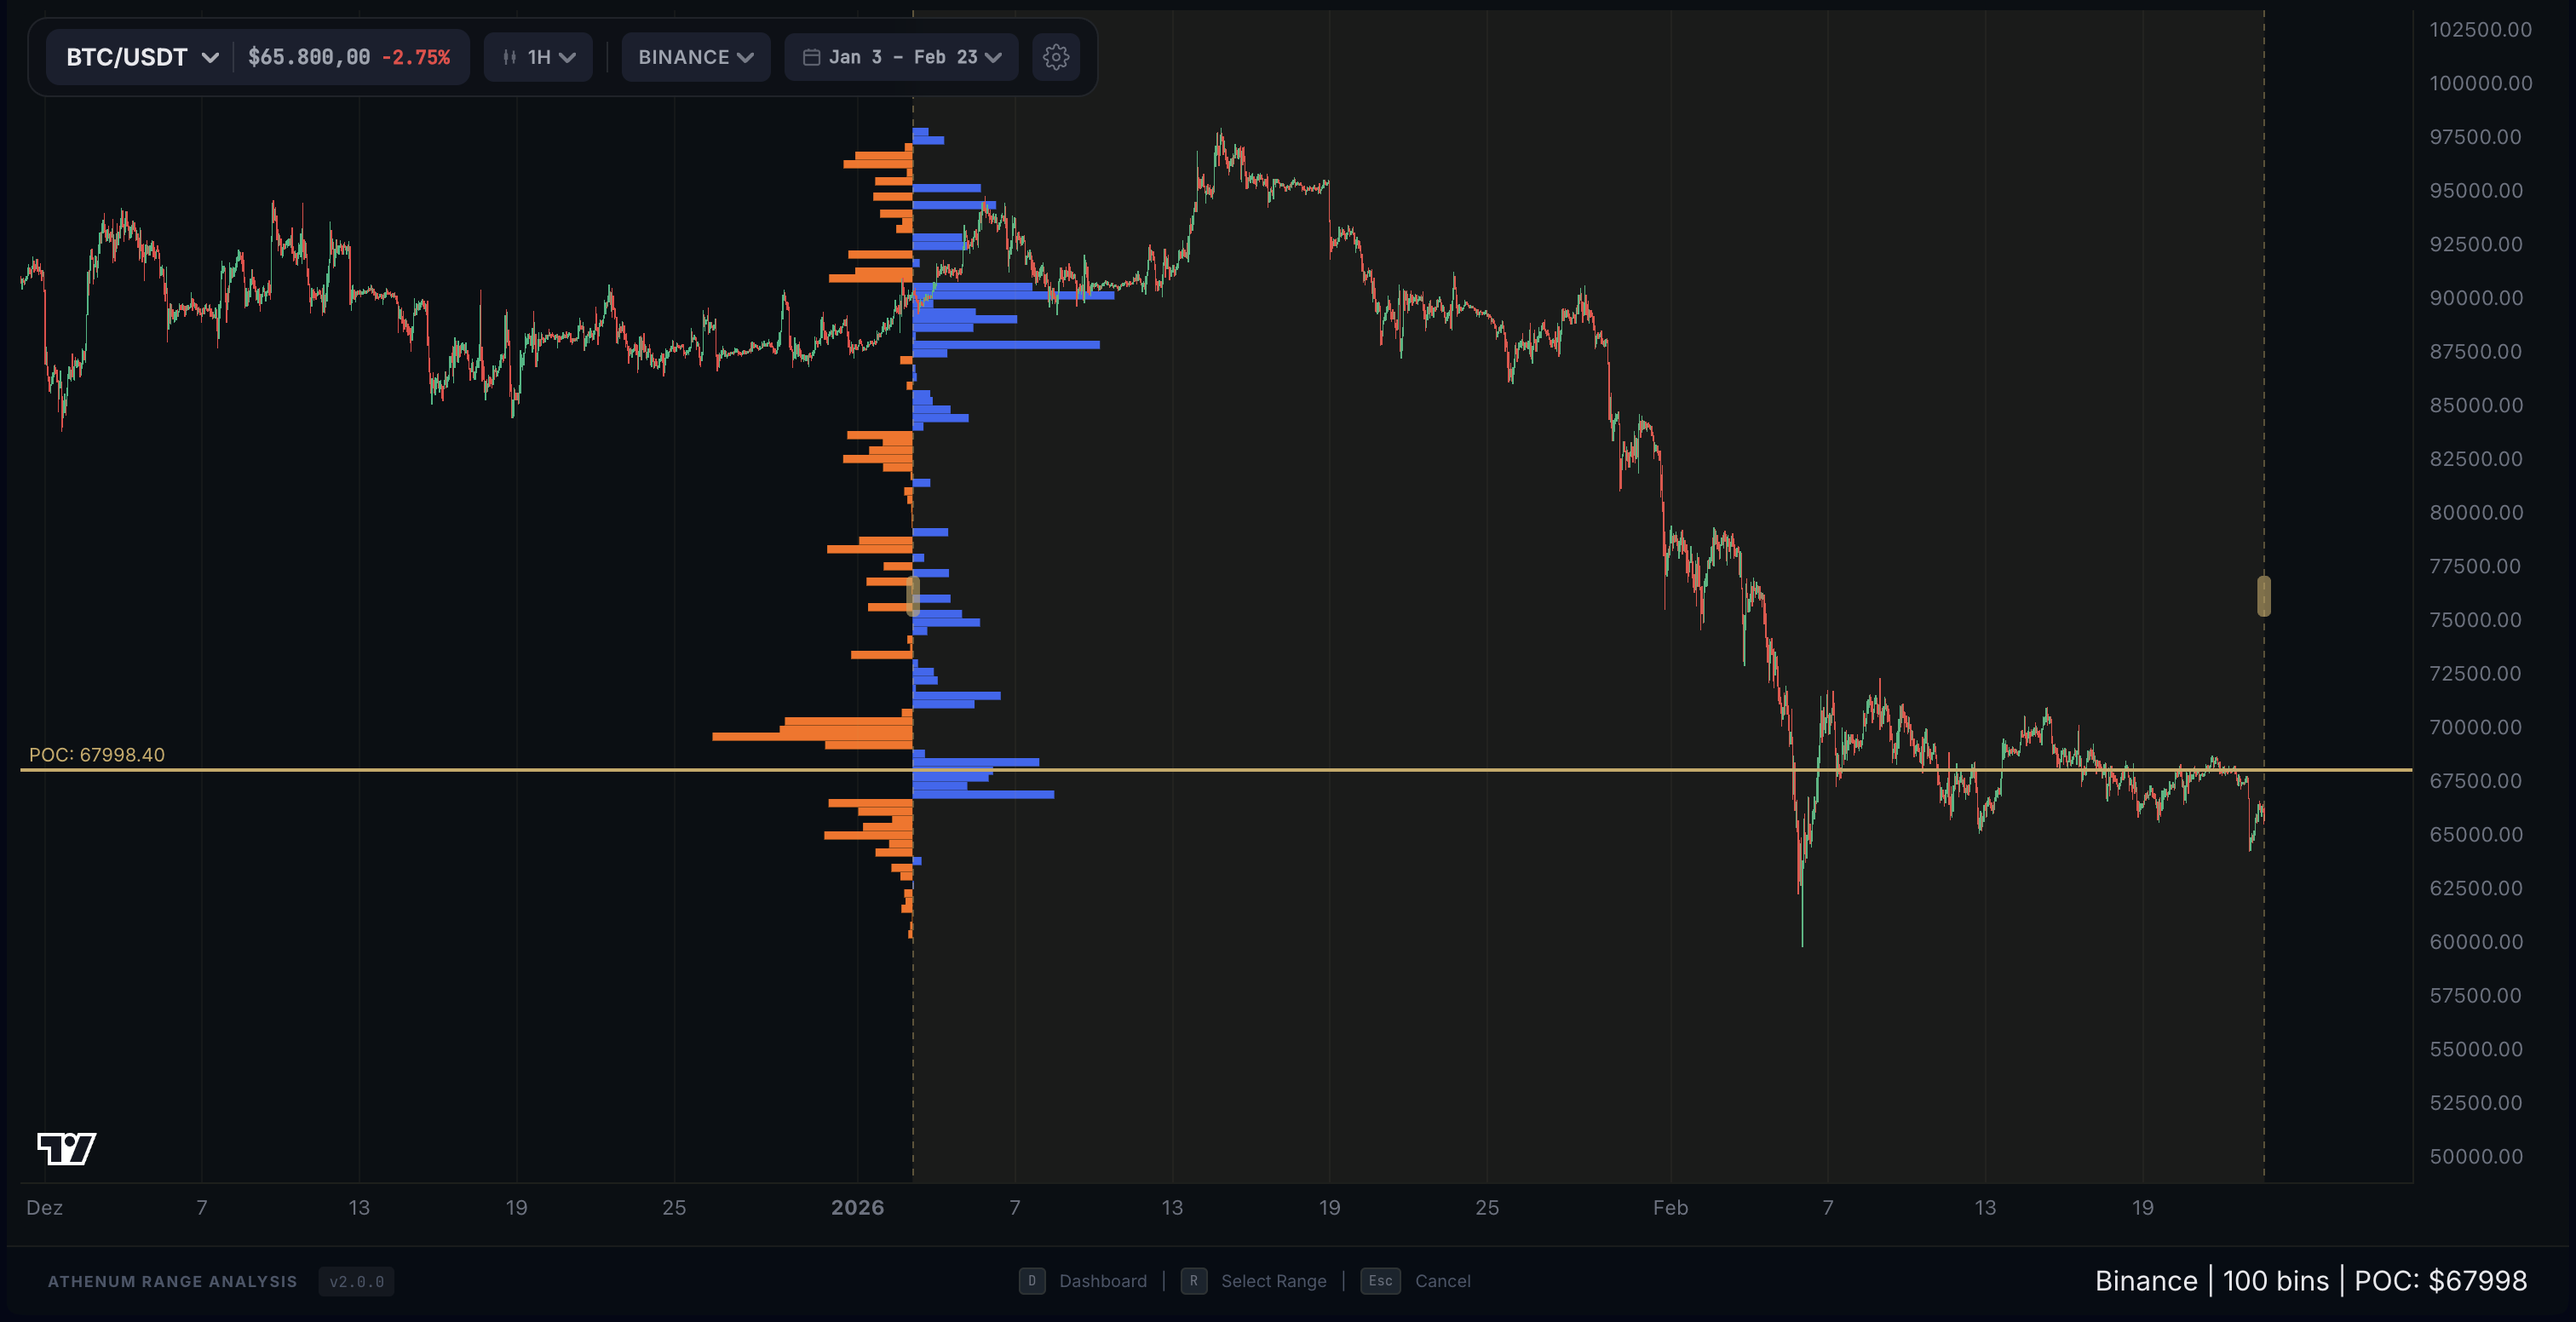
A profile groups activity into price buckets. The point of control is the bucket with the highest volume under that grouping. VWAP is the sum of price times volume divided by total volume. With trade-level data, use actual trade prices; bar-based implementations may use a representative price such as typical price and therefore produce a different approximation.
Both depend on the chosen window and data source. A session VWAP, an anchored VWAP and a visible-range profile do not automatically cover the same observations. Align the start and end before interpreting disagreement. Also check whether volume represents actual trades, quote/base quantity or a proxy such as tick counts.
A value area is descriptive, not predictive
A value area selects a portion of observed volume using a particular algorithm, often around the highest-volume bucket. It is not a statistical confidence interval for the next price and does not guarantee a stated probability of return. Different bin sizes and tie-breaking rules can change its boundaries.
Profiles based on lower-timeframe bars may classify up/down volume from price direction rather than exchange taker sides. Do not read their colours as an exact inventory of aggressive buyers and sellers unless the documented method supports that interpretation. Historical activity and still-open positions are different quantities.
The busiest price is 100; the average is 102
In a hypothetical sample, 2 units trade at 98, 6 at 100, 2 at 102 and 5 at 106. Total volume is 15. The largest single price bucket is 100 with 6 units, so that bucket is the point of control. Total price-times-volume is 196 + 600 + 204 + 530 = 1,530.
VWAP is 1,530 ÷ 15 = 102. The five units at 106 pull the average above the busiest price. There is no contradiction. If the 106 trades occurred after your decision timestamp, they must not appear in the VWAP used to justify that earlier decision.
| Price | Volume | Price × volume |
|---|---|---|
| 98 | 2 | 196 |
| 100 | 6 | 600 |
| 102 | 2 | 204 |
| 106 | 5 | 530 |
| Total | 15 | 1,530 |
- Price 98
- 2 units
- Price 100: POC
- 6 units
- Price 102: VWAP
- 2 units
- Price 106
- 5 units
Changing the visible range changes the question
Zooming or panning can alter a visible-range profile by including different trades. A level that shifts is not necessarily repainting incorrectly; the input population may have changed. Freeze an explicit range for evaluation and save it with the chart. Do not choose the most convincing historical POC only after observing the later reversal.
Before acting
- Align the profile and VWAP observation windows.
- Check volume type and trade-level versus bar-based calculation.
- Record price bucket size and value-area algorithm.
- Keep descriptive volume distribution separate from position inventory.
- Use only data available at the decision timestamp.
Check your understanding
Remove the five units at 106 from the sample. What are the new VWAP and point of control?
Show the explained answer
Remaining volume is 10 and price-times-volume is 1,000. VWAP becomes 100. The point of control remains 100 with 6 units. The change comes from a different sample, not from a prediction that price must return to either value.