Trading statistics: test what a backtest result actually says · 2 / 5
Profit factor: check whether one winner carries the result
Profit factor divides the sum of positive trade outcomes by the absolute sum of negative outcomes. A value above one can coexist with a result dominated by a single trade. Inspect the distribution and sample before treating the ratio as evidence of a repeatable edge.
Athenum7 minUpdated:
Freeze the trade and cost definitions
Compute profit factor on a consistent unit, such as net USDT per completed trade. Include entry and exit fees, funding and other attributed costs before classifying each trade as positive or negative. A small gross winner can become a net loser. Avoid combining gross winners with net losses or mixing currency P&L and R multiples.
Partial exits need a declared grouping rule. Three profitable fills from one position do not necessarily represent three independent successful decisions. Open positions need separate treatment; excluding unresolved losers while including closed winners biases the sample. If the negative-outcome sum is zero, report the ratio as undefined rather than proof of infinite quality.
Describe concentration without rewriting history
Report the contribution of the largest winner to total positive P&L and to the net result. Then calculate a clearly labeled sensitivity case that removes or reduces that observation. Keep the full observed sample as the primary result. The sensitivity case asks how dependent the summary is on an extreme observation, not whether that observation was illegitimate.
Large winners can be a real feature of a trend-following strategy. Removing them is not automatically a better forecast. Investigate whether the rules, execution, liquidity and sample period plausibly support such outcomes, and assess uncertainty with methods appropriate to dependence and selection.
Worked example: profit factor 2 depends heavily on one trade
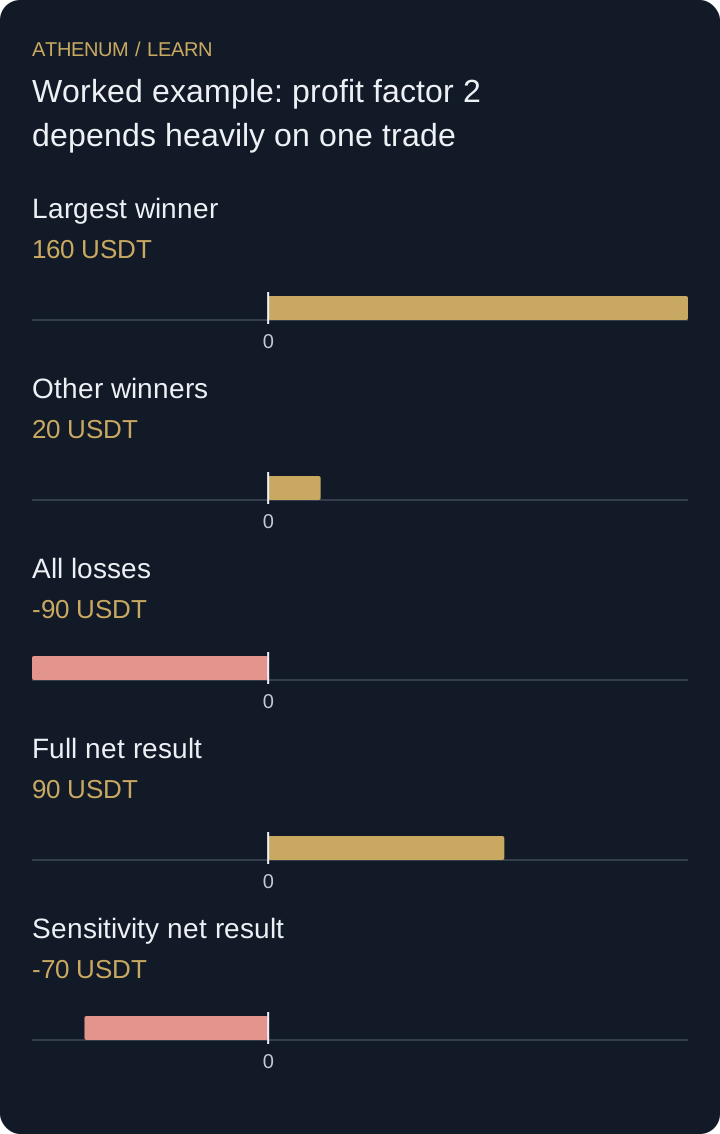
Consider six hypothetical completed net outcomes in USDT: +160, +10, +10, −30, −30 and −30. Positive outcomes total 180; negative magnitudes total 90. Profit factor is 2, win rate is 50%, and net P&L is +90.
The largest winner supplies 160 / 180 = 88.889% of all positive P&L. In the labeled sensitivity case excluding it, positive P&L is 20, losses remain 90, profit factor becomes 0.2222 and net P&L is −70. The original result remains +90. This small constructed sample demonstrates concentration, not a universal acceptable profit-factor threshold.
| Summary | Full sample | Without largest winner: sensitivity only |
|---|---|---|
| Trades | 6 | 5 |
| Positive P&L | 180 | 20 |
| Negative magnitude | 90 | 90 |
| Profit factor | 2 | 0.2222 |
| Net P&L | 90 | −70 |
 Open full-size diagram
- Largest winner: 160 USDT
- Other winners: 20 USDT
- All losses: -90 USDT
- Full net result: 90 USDT
- Sensitivity net result: -70 USDT
No fixed ratio certifies an edge
A high ratio can reflect few observations, favorable conditions, omitted costs or an authentic but uncertain payoff distribution. A lower ratio can come from many small opportunities with different turnover and drawdown. Compare these properties explicitly instead of declaring every strategy above an arbitrary threshold ready for live capital.
Before acting
- Group trades and allocate costs consistently.
- Keep unresolved exposure visible.
- Report positive P&L, loss magnitude and sample size beside the ratio.
- Label concentration stress cases without replacing the original record.
Check your understanding
Net trades are +45, +15, −20 and −10 USDT. What are profit factor and the largest winner’s share of positive P&L? What is the ratio without that winner?
Show the explained answer
Positive P&L is 60 and loss magnitude is 30, so profit factor is 2. The largest winner contributes 45 / 60 = 75% of positive P&L. Excluding it only as a sensitivity case leaves 15 / 30 = 0.5 and net P&L of −15.