Trading statistics: test what a backtest result actually says · 5 / 5
Trading bootstrap: preserve dependent blocks when resampling results
A bootstrap repeatedly resamples observed data under a declared sampling model. If trades share a common daily shock, resampling each trade independently breaks that relationship. Choosing the unit matters more than displaying an impressive simulation count.
Athenum7 minUpdated:
Declare what is sampled together
In an ordinary independent bootstrap, observations are sampled with replacement and the statistic is recomputed. A block approach keeps a group of related observations together. The groups might be sessions, event episodes or justified time windows. Their length and construction affect which dependence the resampling preserves.
The method does not discover unseen crashes, remove selection bias or repair bad execution data. A block boundary can still cut a dependence that extends across sessions. Check multiple defensible block definitions and retain the original chronological equity path. Do not confuse resampling observed outcomes with a validated model of future prices.
Use a small enumeration to understand the mechanism
The example has only two days and cannot support a credible real-world confidence interval. Its purpose is to show exactly which sequences each resampling scheme allows. We enumerate all day selections so no random seed or simulation noise hides the distinction.
For a real estimate, record the data version, statistic, grouping, number of resamples, random generator and interval method. Reproducibility does not ensure validity: it only makes the result inspectable. The basic bootstrap API’s paired option preserves alignment of paired arrays; it does not automatically discover time blocks for a trading strategy.
Worked example: resample the day, not isolated copies of its shock
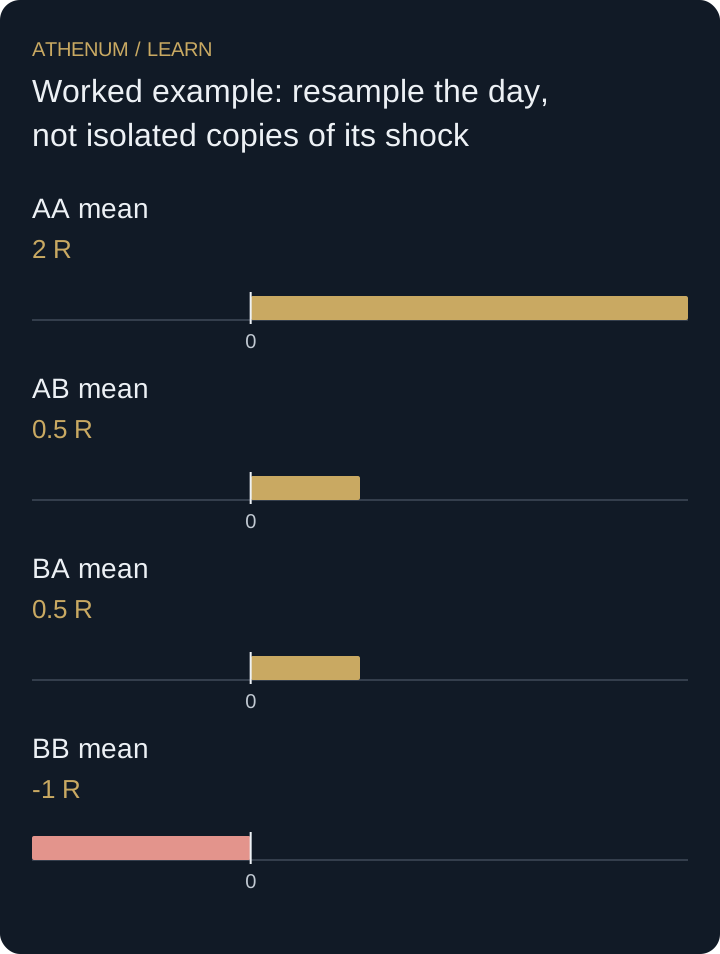
Day A contains two +2R trades and day B contains two −1R trades. Mean outcome across all four trades is +0.5R. Drawing two whole days with replacement yields AA, AB, BA and BB with equal weight. Their four-trade means are +2R, +0.5R, +0.5R and −1R.
Independent resampling of four individual trades instead lets each draw be +2R or −1R with equal weight. There are sixteen equally weighted sign patterns. An all-winning or all-losing sample occurs in two of sixteen patterns, or 12.5%, versus two of four day-block patterns, or 50%. These are frequencies inside two constructed resampling models, not probabilities of future trading success.
| Selected days | Four trade outcomes | Mean per trade |
|---|---|---|
| AA | 2, 2, 2, 2 | 2R |
| AB | 2, 2, −1, −1 | 0.5R |
| BA | −1, −1, 2, 2 | 0.5R |
| BB | −1, −1, −1, −1 | −1R |
 Open full-size diagram
- AA mean: 2 R
- AB mean: 0.5 R
- BA mean: 0.5 R
- BB mean: -1 R
Ten thousand resamples are still two observed days
Increasing the number of draws reduces numerical noise in the resampling calculation. It does not add new regimes or independent history. A tight result from repeatedly recycling a narrow sample can remain badly misleading when the sampling model, selected strategy or future market differs.
Before acting
- Choose a sampling unit that preserves relevant dependence.
- Record the statistic, data version and resampling procedure.
- Keep model frequencies distinct from future-event probabilities.
- Treat block choice and short history as material uncertainty.
Check your understanding
Using the two-day example, what is the mean across all four day-block bootstrap means? Does its agreement with the original sample prove the strategy has positive expected return?
Show the explained answer
The mean is (2 + 0.5 + 0.5 − 1) / 4 = 0.5R, matching the original sample. This agreement follows from the symmetric resampling construction. It does not establish a future edge; the example contains only two observed days and assumes those days are the resampling population.