Backtest statistics: test what a trading result really says · 4 / 5
Trading benchmark: compare net results on the same capital and dates
A positive trading result can still trail a simpler alternative. Compare both over the same dates, capital and cash-flow convention, with plausible costs. Then explain exposure and drawdown differences before interpreting the gap.
Athenum7 minUpdated:
Buy-and-hold or cash: choose the benchmark in advance
A benchmark should answer the research question. Buy-and-hold can test whether active trading improved on passive exposure to the same asset; cash can test whether taking risk beat remaining unexposed under the specified cash-return assumption. Neither automatically matches leverage, market sensitivity or liquidity.
Freeze the benchmark, evaluation window and cost model before inspecting results. Selecting the weakest comparison afterwards is another form of hindsight. If the strategy holds multiple assets or cash, disclose those differences rather than presenting the raw return gap as risk-adjusted alpha.
Subtract costs once for both, then compare equity curves
Use one execution-cost convention for both portfolios. If P&L already uses actual fills, spread and slippage relative to a reference price are already embedded: subtract separately booked fees, funding and borrowing once, not the same price shortfall again. If gross P&L uses reference prices instead, subtract the modeled fill shortfall once. The example’s gross figures use that reference-price convention; its cost totals include the corresponding modeled shortfall and separate charges.
Compare chronological equity curves as well as their endpoints. A strategy may finish slightly behind while having less exposure or a smaller historical drawdown. That is a tradeoff to measure, not grounds for silently changing the benchmark. Historical drawdown remains a sample and does not cap future risk.
Example: 8% vs 7% gross becomes 6% vs 6.8% net
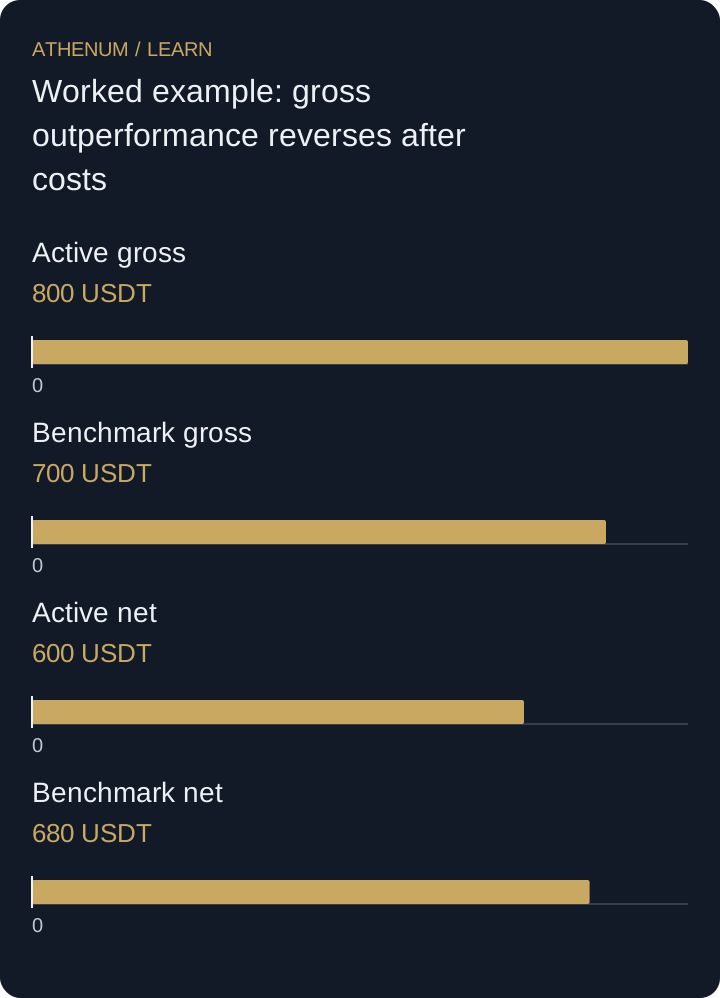
Both hypothetical portfolios start with 10,000 USDT and have no external cash flows. Active trading earns 800 before costs but pays 200 across all modeled charges, ending at 10,600. The passive comparison earns 700 before its 20 of modeled charges, ending at 10,680.
Gross returns are 8% versus 7%; net returns are 6% versus 6.8%. The active strategy’s apparent one-percentage-point lead becomes a 0.8-percentage-point shortfall. These cash charges are constructed totals, not current exchange tariffs. No assumption that passive and active exposure paths were equally risky is made.
| Portfolio | Gross P&L | Costs | Net P&L | Ending equity |
|---|---|---|---|---|
| Active | 800 | 200 | 600 | 10,600 |
| Passive benchmark | 700 | 20 | 680 | 10,680 |
 Open full-size diagram
- Active gross: 800 USDT
- Benchmark gross: 700 USDT
- Active net: 600 USDT
- Benchmark net: 680 USDT
Mistake: beating an unlevered benchmark with more leverage
A strategy taking twice the exposure may exceed an unlevered benchmark in a favorable market while accepting much larger losses. Report exposure, margin constraints and stress behavior. Do not infer skill from the return gap alone or retrospectively leverage the benchmark using the amount that makes the preferred story work.
Before acting
- Freeze the benchmark and dates before evaluation.
- Use matching capital and external-cash-flow treatment.
- Reconcile net ending wealth for both paths.
- Report exposure, turnover and drawdown beside the return difference.
Check your understanding
Two portfolios start at 20,000 USDT. The active strategy earns 1,400 gross and pays 300; the benchmark earns 1,200 gross and pays 40. Which has the higher net return?
Show the explained answer
Active net P&L is 1,100, or 5.5%. Benchmark net P&L is 1,160, or 5.8%. The benchmark leads by 60 USDT, equivalent to 0.3 percentage points of starting capital. This compares net returns only; exposure and risk still need separate analysis.
Sources and further reading
Continue with Athenum
Related lessons
- Measure implementation shortfall against a declared decision benchmark
Count executed-price differences, fees and the opportunity cost of unfilled quantity. Reconcile decision and arrival benchmarks without double-counting delay.
- Calculate trading expectancy after fees and slippage
Turn win rate and average wins and losses into net expectancy. Find the break-even win rate and see how fees and slippage can turn a 2R setup negative.