Backtest statistics: test what a trading result really says
Interpret compounding, profit factor, overlapping trades, net benchmarks and bootstrap assumptions with independently calculated examples.
What you will practise
Separate a correct historical calculation from evidence strong enough to support a new trading hypothesis.
Before you start
- Calculate net expectancy and understand chronological holdouts.
- Read trade-level R multiples and account equity as different quantities.
Course outline
- 1
Average return versus compound growth: reconcile the equity curve
A sequence can average 0% and still lose money. Calculate the arithmetic average and compounded growth from the same returns and see the volatility drag.
7 minIn short: Arithmetic mean return is Σr_i / n; with no external cash flows, compounded growth is Π(1 + r_i) − 1. An equity curve multiplies return factors, so +20% then −20% averages 0% but ends at −4%. The gap is volatility drag, not an extra fee to subtract again.
- 2
Profit factor: check whether one winner carries the result
A profit factor of 2 can depend on a single winner. Calculate profit factor from net trade outcomes, then inspect concentration without deleting real trades.
7 minIn short: Profit factor = sum of positive net trade outcomes ÷ absolute sum of negative ones. Check concentration with the largest winner’s share and a labeled sensitivity case, keeping the full sample as the primary result. In the example, one +160 USDT winner supplies 88.889% of positive P&L; without it, profit factor 2 becomes 0.2222.
- 3
Overlapping trades: why twenty results may contain four market episodes
Twenty trades opened around four announcements may hold only four market episodes. Map overlapping holding windows before trusting a backtest's sample size.
7 minIn short: A trade count is not a count of independent observations: overlapping trades can share one market episode. Keep every trade, group outcomes into episodes with a rule set before evaluating results, and report both counts. Twenty trades around four announcements may hold only four market episodes.
- 4
Trading benchmark: compare net results on the same capital and dates
Gross outperformance can reverse after costs. Compare a strategy with a declared benchmark on the same capital, dates and cash flows, then explain exposure.
7 minIn short: Compare net results with a benchmark frozen before seeing results, over the same dates, capital and cash-flow convention, subtracting each cost once, then explain exposure and drawdown differences. In the example, active trading leads 8% to 7% gross but trails 6% to 6.8% net.
- 5
Trading bootstrap: preserve dependent blocks when resampling results
Resampling single trades breaks a shared daily shock. Enumerate a trade-versus-day bootstrap and see why ten thousand resamples are still two observed days.
7 minIn short: When trades share a daily shock, resample whole blocks such as days instead of single trades. In the two-day example, all-winning or all-losing samples occur in 50% of day-block resamples but 12.5% of trade-level ones. More resamples reduce numerical noise; they do not add independent history.
Calculators used in this course
Related courses
- Backtest bias: validate a trading strategy without hindsightAudit signal timing, ambiguous fills, confirmation filters, parameter searches and chronological holdouts with reproducible worked cases.
- Portfolio risk: drawdown, sizing and daily limitsReconcile drawdown recovery, losing streaks, correlated exposure, lagged volatility sizing and daily risk budgets with original worked examples.
- Trading journal: costs, decisions and honest performanceAllocate partial-exit costs, review rule adherence, preserve thesis revisions and separate external cash flows from trading returns.
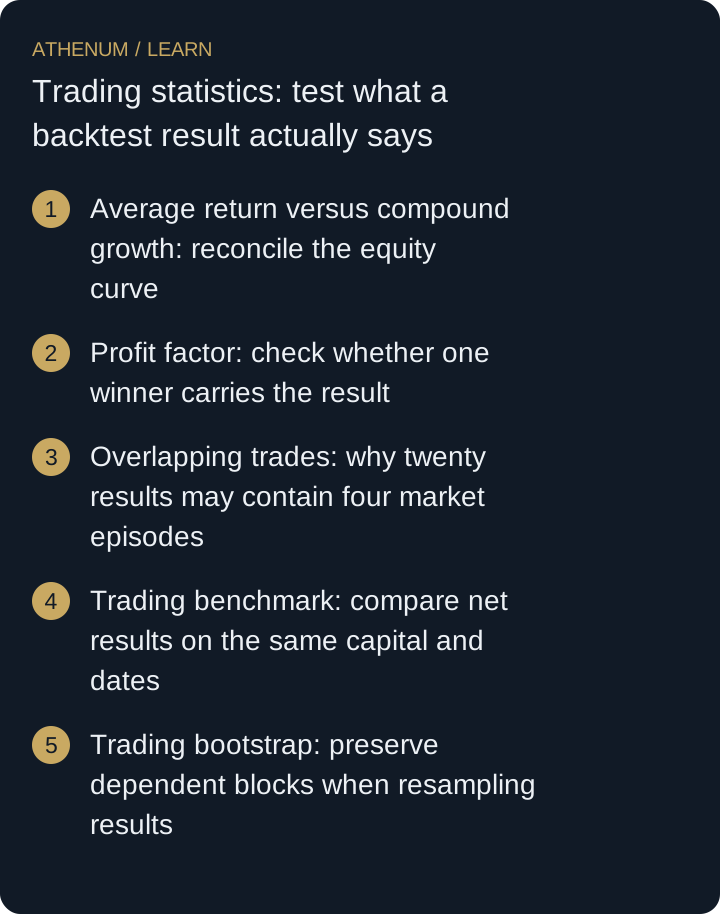 Open full-size diagram
- Average return versus compound growth: reconcile the equity curve
- Profit factor: check whether one winner carries the result
- Overlapping trades: why twenty results may contain four market episodes
- Trading benchmark: compare net results on the same capital and dates
- Trading bootstrap: preserve dependent blocks when resampling results
Educational material. Examples do not establish a profitable strategy. Trading costs, gaps and liquidation can produce losses beyond a planned stop.