Table of Contents7 sections
- What is the Bitcoin long/short ratio actually measuring?
- How far apart are the numbers on a single exchange?
- Do two exchanges agree when the definition is the same?
- Can two published ratios disagree about which side the crowd is on?
- Which number should you trust when they disagree?
- How do you read a long/short ratio without fooling yourself?
- What this is and is not
Practise with worked lessons
- Aggregate long/short ratios: weight account counts correctly
Pool compatible long and short account counts across venues. See how a combined long share can rise while every single exchange's share falls.
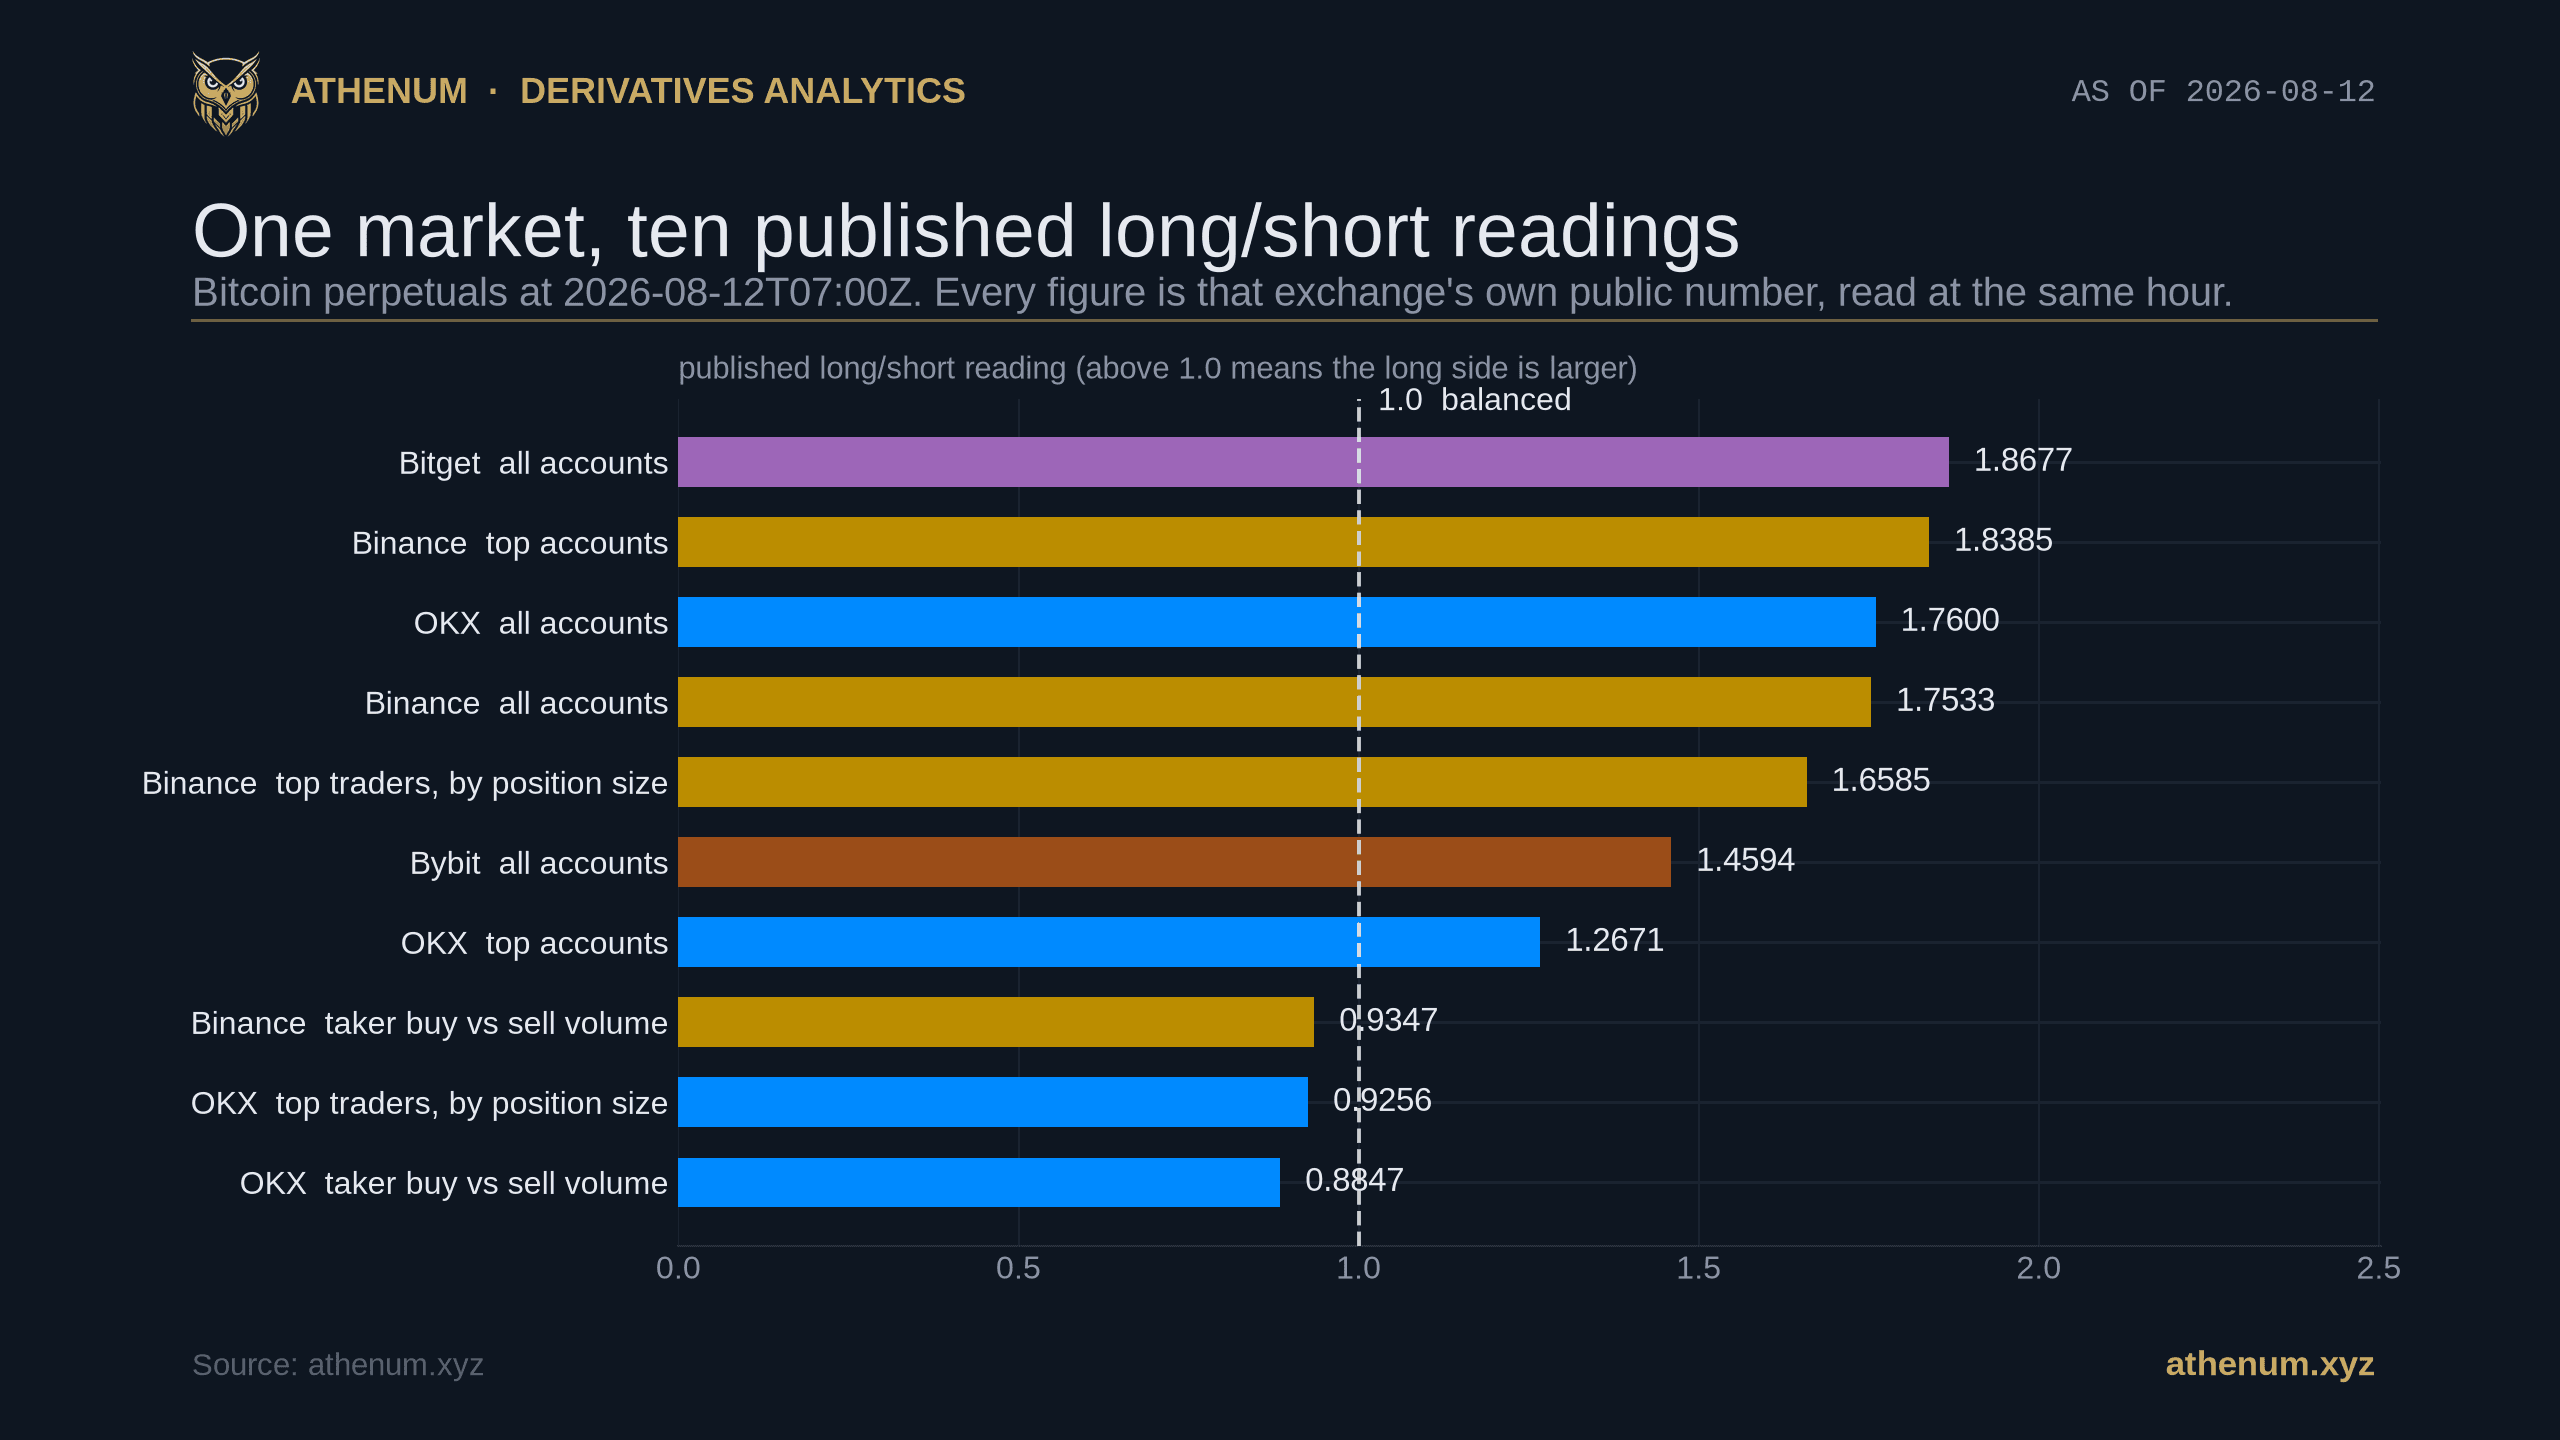
TLDR. Search for the Bitcoin long short ratio and you get a single number, usually quoted to two decimals and read as the mood of the whole market. It does not exist. At 2026-08-12 07:00 UTC we read every long/short figure that Binance, OKX, Bybit and Bitget publish for their Bitcoin perpetual at that same hour. There were ten of them, and they ranged from 0.8847 to 1.8677, a factor of 2.11 apart. Three of the ten sat below 1.0, which is the level that supposedly separates a long-leaning market from a short-leaning one. Binance alone publishes four of these numbers, and over 499 hourly readings the largest and the smallest of its four were 0.46 to 0.92 apart on a middling hour. None of that is an error on anyone's part. Each figure is exactly what its own documentation says it is, and the documentation says different things: all accounts against a top-trader subset, headcount against position size, positions against traded volume. What follows is the measurement, what actually separates the numbers, and what the one reading here that is a price rather than a headcount does and does not settle.
What is the Bitcoin long/short ratio actually measuring?
Whatever the endpoint you pulled it from says it measures, and the endpoints do not agree. A long/short ratio can count accounts, so a wallet holding 0.01 BTC weighs the same as one holding 400. It can count position size, so the large book dominates. It can count taker volume over an hour, which is a flow rather than a position at all. And it can be computed over everyone on the venue or over a subset the exchange calls top traders. Each of those is a legitimate quantity, and each answers a different question. The trouble starts when one of them is quoted as the long/short ratio, without saying which, and read as a statement about Bitcoin.
The definitions are published, and reading them is the whole job. Binance documents its top-trader ratios over "the top 20% users with the highest margin balance". OKX documents its top-trader ratios over "the top 5% of traders with the largest open position value". Those are two different populations selected by two different criteria, so the two figures were never going to match, and an aggregator that lists both under one label is stacking a fifth of one venue against a twentieth of another. Bybit's figure is a share of holders, computed over "all position holders" on the contract. OKX's all-trader ratio is reported per currency across expiry futures and perpetual futures rather than for one instrument, which the Binance and Bybit figures are.
The levels are not interchangeable either, which is the part that quietly breaks the reading. A value of 1.4 is ordinary on an account ratio and remarkable on a taker volume ratio.

Each published reading has its own resting level. Six of the ten cluster between a median of 1.42 and 1.79, while the two taker volume ratios and both OKX top-trader readings sit at or below 1.03. The bands are interquartile ranges and n is printed per row, because the windows differ: Bitget serves 30 hourly rows, OKX serves 720 for its all-trader ratio and 100 for its top-trader ones.
Read against that picture, the 1.4594 Bybit published at the 07:00 UTC stamp on 2026-08-12 sits close to its own median of 1.42, so it is an unremarkable reading. The 0.9347 on Binance taker volume sits close to that series' median of 1.00, so it is unremarkable too. Both are ordinary, and the gap between them is not a signal about Bitcoin. It is the gap between counting accounts and counting volume.
One property is worth pinning before anything is built on the level. Over the 499 hourly readings ending 2026-08-12 07:00 UTC, the Binance all-account ratio was above 1.0 in 499 of 499, the Bybit one in 499 of 499, and the OKX one in 499 of 499. OKX serves a longer history, and across its own 719 readings it was above 1.0 in 713, with every exception falling on 21 and 22 July, before this window opens. These are hourly observations of a slow-moving series rather than independent trials, so the honest statement is that the account ratio did not cross 1.0 once in three weeks, not that it passed 499 separate tests. Either way, the level being above 1.0 carries no information, because it always is. Only the movement can.
How far apart are the numbers on a single exchange?
Far enough to reverse the conclusion, without leaving the venue. Binance publishes four long/short figures for BTCUSDT: an account ratio over all traders, an account ratio over top traders, a position-size ratio over the same top traders, and a taker buy versus sell volume ratio. Across the 499 hours to 2026-08-12 07:00 UTC, the largest minus the smallest ran 0.46 to 0.92 through the middle half of hours, with a median of 0.675 and a peak of 1.767. Restricting that to the three position measures and dropping the volume ratio still leaves a median gap of 0.289 and a peak of 0.891.

One exchange, one contract, four published long/short numbers. The two account ratios track each other closely, the position-size ratio for top traders barely moves inside its 1.418 to 1.688 band, and the taker volume ratio crosses 1.0 constantly. Largest minus smallest ran 0.46 to 0.92 on a middling hour over these 499 readings.
The picture explains the arithmetic. Binance's position-size ratio for top traders spent the whole window inside a 1.418 to 1.688 band, while its all-account ratio swung between 1.059 and 2.320. A trader quoting the first would have described three placid weeks. A trader quoting the second would have described a book that doubled its lean and gave it back twice. Same exchange, same contract, same hours.
There is a smaller trap underneath, and it shows how thin the labelling is. Binance's own documentation says the timestamp on the three ratio endpoints is the end of the period, and that the timestamp on the taker volume endpoint is the start of it. Two rows carrying the same stamp on the same venue therefore describe hours an hour apart, and the live feed shows it: at 08:43 UTC the newest ratio row was stamped 08:00 while the newest taker row was stamped 07:00, both describing the same completed hour. Every comparison in this post shifts the taker series by one hour to correct for that.
Do two exchanges agree when the definition is the same?
They come close, and the residual gap is still bigger than most of the moves people trade on. Holding the definition fixed at the all-trader account ratio and comparing Binance, OKX and Bybit over the 499 hours they share to 2026-08-12 07:00 UTC, the largest minus the smallest had a median of 0.126, a middle half of 0.068 to 0.248, and a peak of 0.613. The three never straddled 1.0 in any of those hours, so they always agreed on direction. They just did not agree on magnitude.

The same definition on three exchanges. Direction agrees in every one of the 499 shared hours, but the gap between the highest and lowest venue reading has a median of 0.126 and peaked at 0.613 at 17:00 UTC on 31 July, when Binance printed 2.3201 and OKX 2.1200 against Bybit at 1.7071.
Bitget publishes the same account ratio but returns only 30 hourly rows, so it cannot enter a three-week comparison. Over the 29 completed hours it does cover, its readings ran 1.6274 to 1.9265 while the Binance figure for the same hours sat between 1.5316 and 1.8385, and Bitget was the higher of the two at every one of them. That last part is one persistent level offset, not 29 independent observations, and should be read as such. We checked for the obvious alternative, that one venue is republishing the other: across those hours the two figures never matched to four decimals, and the median absolute difference was 0.0992. Neither is a copy of the other.
Can two published ratios disagree about which side the crowd is on?
Yes, and that is the failure mode worth remembering, because it turns a data question into a wrong call. Binance and OKX both publish a long/short ratio for top traders measured by position size, the same nominal metric under nearly the same name. Over the 99 hours they share to 2026-08-12 07:00 UTC, the two sat on opposite sides of 1.0 in 50 of them. At the 07:00 UTC reading, Binance was at 1.6585, which says the largest books are net long by a wide margin, and OKX was at 0.9256, which says the largest books are net short.

The same metric, top traders by position size, on two exchanges. Binance stayed between 1.5355 and 1.6780 across these 99 hours while OKX spent 50 of them below 1.0, so the two published readings disagreed about which side the largest books were on for half of a four day window.
Two honest qualifications. Those 50 hours are two stretches, not 50 independent disagreements, and only one of the two is a real disagreement. In the seven hour dip on 9 August, OKX read between 0.9973 and 0.9992, a hair under balanced and inside anyone's noise. The 43 hour run from 13:00 UTC on 10 August, where it sat between 0.9179 and 0.9999, is the substantive one, so the fair summary is that the two series disagreed on the side for most of two days rather than half the time in general. And the gap is not mainly about who is long: the median distance between the two readings was 0.573 and it never fell below 0.522 in the whole window. The two are measuring different rooms. Binance ranks its top traders by margin balance and takes the top fifth of them, OKX ranks by open position value and takes the top twentieth, and nothing in either number's name tells you that.
Which number should you trust when they disagree?
None of them on its own, and the more useful question is what a disagreement costs you. Funding is the one reading here that is a price rather than a headcount: it is what the leaning side pays to keep the position open. Reading Athenum's live feed for the Bitcoin perpetual at 2026-08-12 07:00 UTC, and putting every venue on a common eight-hour basis, funding was positive at every venue in the picture: +0.0062% on Bitget, +0.0069% on OKX, +0.0080% on Bybit, +0.0085% on Hyperliquid and +0.0087% on Binance, a whole range of 0.0025 percentage points. That is a tight hour, and the next paragraph is about how tight.

Funding for the same asset at the same hour on 2026-08-12, each venue shown normalised to an eight hour basis, with the distribution of that same cross-venue spread underneath. The grey bands are each venue's middle half over the past 168 hours. They overlap heavily, so the ordering is a single reading rather than a stable ranking, and two of them cross below zero: Bitget's rate was negative in 63 of those hours and Bybit's in 46. The histogram puts this hour's 0.0025 near the narrow tail of a distribution whose median is 0.0079.
That hour was one of the tighter ones, and the lower panel exists to say so. Over the past 168 hours the cross-venue funding range had a median of 0.0079 percentage points, a middle half of 0.0061 to 0.0114, and a peak of 0.0243, so the 0.0025 quoted above sits near the narrow tail rather than in the middle. Funding does not agree across venues in any strong sense: all five were positive together in only 83 of those 168 hours, and we measured the same disagreement on the sign in an earlier Athenum post, where one exchange printed a negative funding settlement once and another 26 times. Two smaller cautions. The ordering above is one hour, and the overlapping grey bands say the ranking is not stable. And Hyperliquid quotes its rate per hour while the others quote per eight hours, so these figures are only comparable because each was converted first, which is the subject of the Athenum note on funding rate intervals.
What separates the two families is what a disagreement changes. Measured the way the ratios are measured, as a multiple rather than a difference, funding is the wider of the two: across the 83 hours when all five venues were positive, the highest venue rate was a median of 3.56 times the lowest, against the 2.11 the ratios spanned on the day. The reason to read funding in absolute terms anyway is that it is a cost, and a large multiple of a very small number is still a very small number. The widest cross-venue funding gap in the whole window, 0.0243 points per eight hours, works out at about 0.51% of notional over a week, and at the rates quoted above a long position costs between 0.13% and 0.18% of notional per week to carry. That is a difference in cost, and you can size it yourself with the Athenum funding rate calculator. The long/short disagreement on 2026-08-12 was between 1.7533 and 0.9256, which is a difference in direction. Read funding for what the lean costs, read a ratio only with its definition attached, and do not expect either one to describe the market as a whole.
How do you read a long/short ratio without fooling yourself?
1. Name the number. Write down which endpoint it came from: all traders or a top-trader subset, headcount or position size, positions or taker volume. If a chart does not say, treat it as unlabelled.
2. Compare like with like. An account ratio on one venue against a position-size ratio on another is not a cross-exchange comparison. On 2026-08-12 that specific mistake was worth the difference between 1.7533 and 0.9256.
3. Check what a top trader is on each venue. It is the top 20% by margin balance on Binance and the top 5% by open position value on OKX, so one phrase names two different groups chosen two different ways.
4. Calibrate the level before you read it. A 1.4 account ratio is ordinary, and the same 1.4 on a taker volume ratio sits near the top of its range. Each series has its own resting level, shown above.
5. Read the change, not the sign. The all-account ratios did not cross 1.0 once in three weeks on Binance or Bybit, so "above 1.0" says nothing. A move like Binance's from 1.2422 at 2026-07-30 23:00 UTC to 2.3201 eighteen hours later says something.
6. Ask what the disagreement changes. Venues disagreed on funding too, by a median of 0.0079 percentage points over 168 hours, but that is a difference in cost, while a ratio at 1.7533 against one at 0.9256 is a difference in direction. If you hold leverage, the Athenum liquidation calculator is the other half of that question.
What this is and is not
Every figure above is a public number, published by the exchange that computed it, and any reader can pull the same rows. The windows differ because the venues differ: Binance and Bybit serve 500 hourly rows, OKX serves 720 for its all-trader ratio and 100 for its top-trader ones, Bitget serves 30. Each claim above states the n it rests on for that reason. We dropped the newest hourly row of every series before measuring, as a precaution against a bar that is still filling, and then tested whether the precaution was needed: re-pulling every endpoint after the hour rolled over, at 08:43 and then 09:06 UTC, left all 4,160 shared rows unchanged, including the row that had been newest, so these series publish a settled value rather than one that moves through the hour. Only Binance documents whether its stamp marks the start or the end of a period. OKX, Bybit and Bitget do not say, so those three are aligned on the raw hourly stamp and the residual uncertainty there is one hour. OKX also publishes its all-trader ratio to two decimals, so any gap computed from it is good to about half a hundredth and its third digit is not meaningful.
This is a measurement of published data, not a prediction. Nothing here says the crowd is right or wrong, and none of these numbers forecast the next move. The claim is narrower and more useful: the phrase "the long/short ratio" names a family of quantities that disagreed by a factor of 2.11 on the day we measured, and quoting one of them without its definition is how a positioning read goes wrong. If you want the underlying mechanics, our explainers on how to read the long/short ratio and on the long/short ratio and open interest cover how the metric is built, and the same counting problem shows up in open interest, where most venues never say whether they count one side or both.
The same cross-venue funding, open interest and liquidation picture sits in the Athenum terminal, which opens on a free 7 day Pro+ trial with no card.
A number without its definition is a rumour with decimals, which is why every figure here names the endpoint it came from. The 34 calculators we keep next to our live derivatives feed cost nothing to use, take no account and no email, and never meter how often you run them.
One terminal. All the data.
Liquidations, orderbook depth, whale walls & open interest from 4 exchanges, all real-time, in one place.
No credit card required

Athenum Analytics
Athenum Analytics is our three-person editorial team covering crypto derivatives, market data and macroeconomic context.