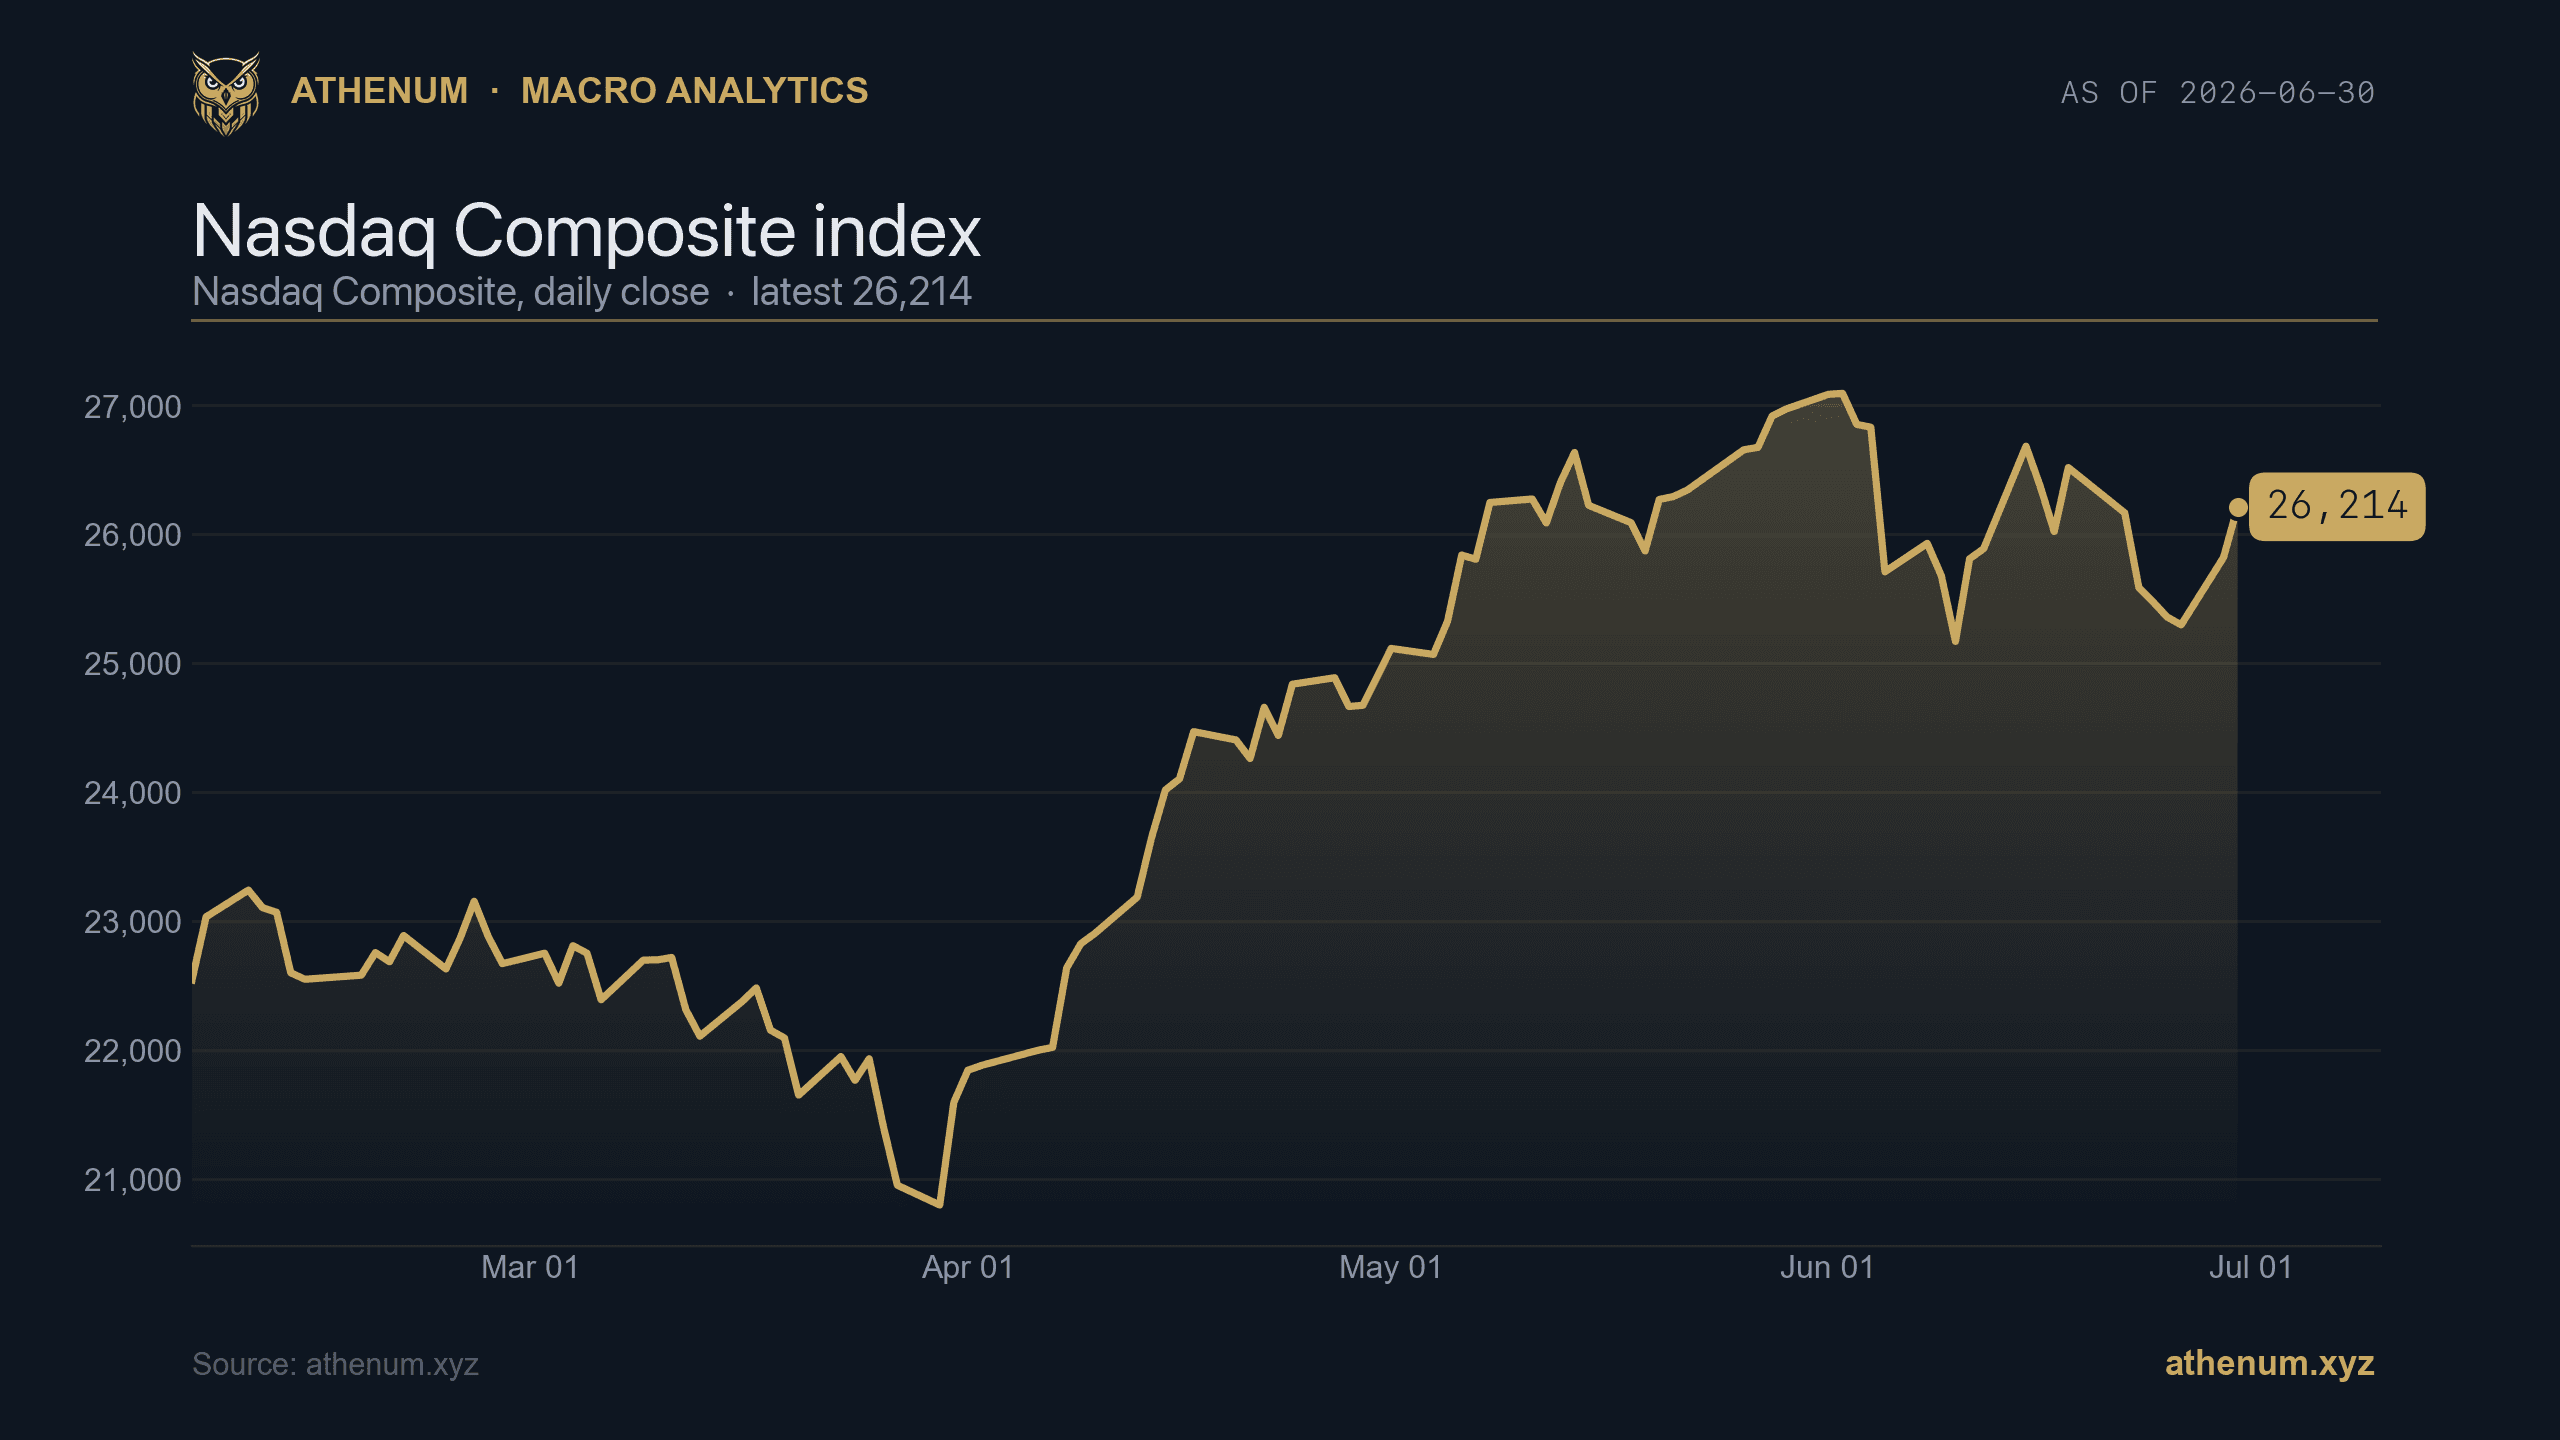
This is a dated correction and evidence audit of our article first published on 1 July 2026. It preserves the claim's context rather than presenting an unsupported historical headline as a current market reading. The separate Bitcoin–Nasdaq measurement guide explains a reproducible calculation.
The earlier claim and its evidence gap
The original introduction described a record correlation near 0.96 in April 2026 and called the relationship structurally high. It did not supply the paired source series, exact equity proxy, sampling clock, rolling window or calculation output required to verify that value. The underlying observation bundle was not available for the 24 September revision. We therefore withdraw the value as a verified research finding rather than invent the missing observations.
The article also mixed a Nasdaq Composite level with discussion of the Nasdaq-100 and compared several market indicators carrying different timestamps. Those context readings do not independently establish any Bitcoin–Nasdaq correlation. They are not retained as evidence of the headline or as current quotes.
The arithmetic does not establish a cause
Squaring 0.96 gives 0.9216. That arithmetic is correct, but it does not mean equities caused 92% of Bitcoin's price movement. In a simple linear regression with an intercept, fitted to the same paired observations, squared Pearson correlation equals the in-sample R-squared. It does not identify a causal mechanism, establish out-of-sample explanatory power or turn a correlation of returns into a claim about price levels.
A short-window spike also does not establish a permanent or “structural” relationship. Window length, time alignment, proxy choice, outliers and uncertainty must be reported before comparing readings or claiming a record. See NIST's explanation of linear association and causality.
What a defensible replacement would require
A replacement empirical estimate needs licensed source observations for a stated Bitcoin series and one stated equity series, aligned trading-session cutoffs, a declared return convention, missing-data rules, calculation code and the full observation window. It should report sensitivity to plausible windows and avoid interpreting association as a proven flow channel.
No replacement correlation is published here because that reconstruction has not been performed. This correction is the result of an evidence audit, not a new correlation study. For research whose stated numerical result has actually been re-run, the Bitcoin return-baseline dataset publishes aggregate CSV, calculation code and source requests.
Correction date: 24 September 2026. Original article date: 1 July 2026.
Archived illustrations from the original publication. These preserve its visual record; their historical inputs have not been independently reproduced in this revision.


One terminal. All the data.
Liquidations, orderbook depth, whale walls & open interest from 4 exchanges, all real-time, in one place.
No credit card required

Athenum Analytics
Athenum Analytics is our three-person editorial team covering crypto derivatives, market data and macroeconomic context.