Table of Contents7 sections
- What does a round trip on a Bitcoin option quote cost?
- Is this new, or has it been measured before?
- How does that compare with the perpetual on the same screen?
- How much of the board has no bid at all?
- Where was the perpetual liquidity on the same morning?
- How do you check this on your own board?
- What this measurement does not show
TLDR. A Bitcoin options spread is usually described in volatility points, which hides what it costs to trade. Measured on every listed Deribit BTC option at 2026-10-10 04:12 UTC, with BTC at $82,608.21, 881 of the 950 listed contracts carried a bid and an ask at the same time, and on those the round trip from bid to ask costs a median of 5.06 percent of the option's own mid premium, with a middle half running from 2.55 to 10.00 percent. The cost shifts with the time left: 12.67 percent on the 38 contracts expiring inside a day, against 3.14 percent on the 296 that expire more than ninety days out. The other 69 contracts had no bid at any price, and 63 of those carry open positions. In the unit a perpetual trader uses, basis points of the exposure being taken rather than of the premium, the median option quote is 20 bps wide against 0.0605 bps on the BTC perpetual at the same stamp, a factor of 331.
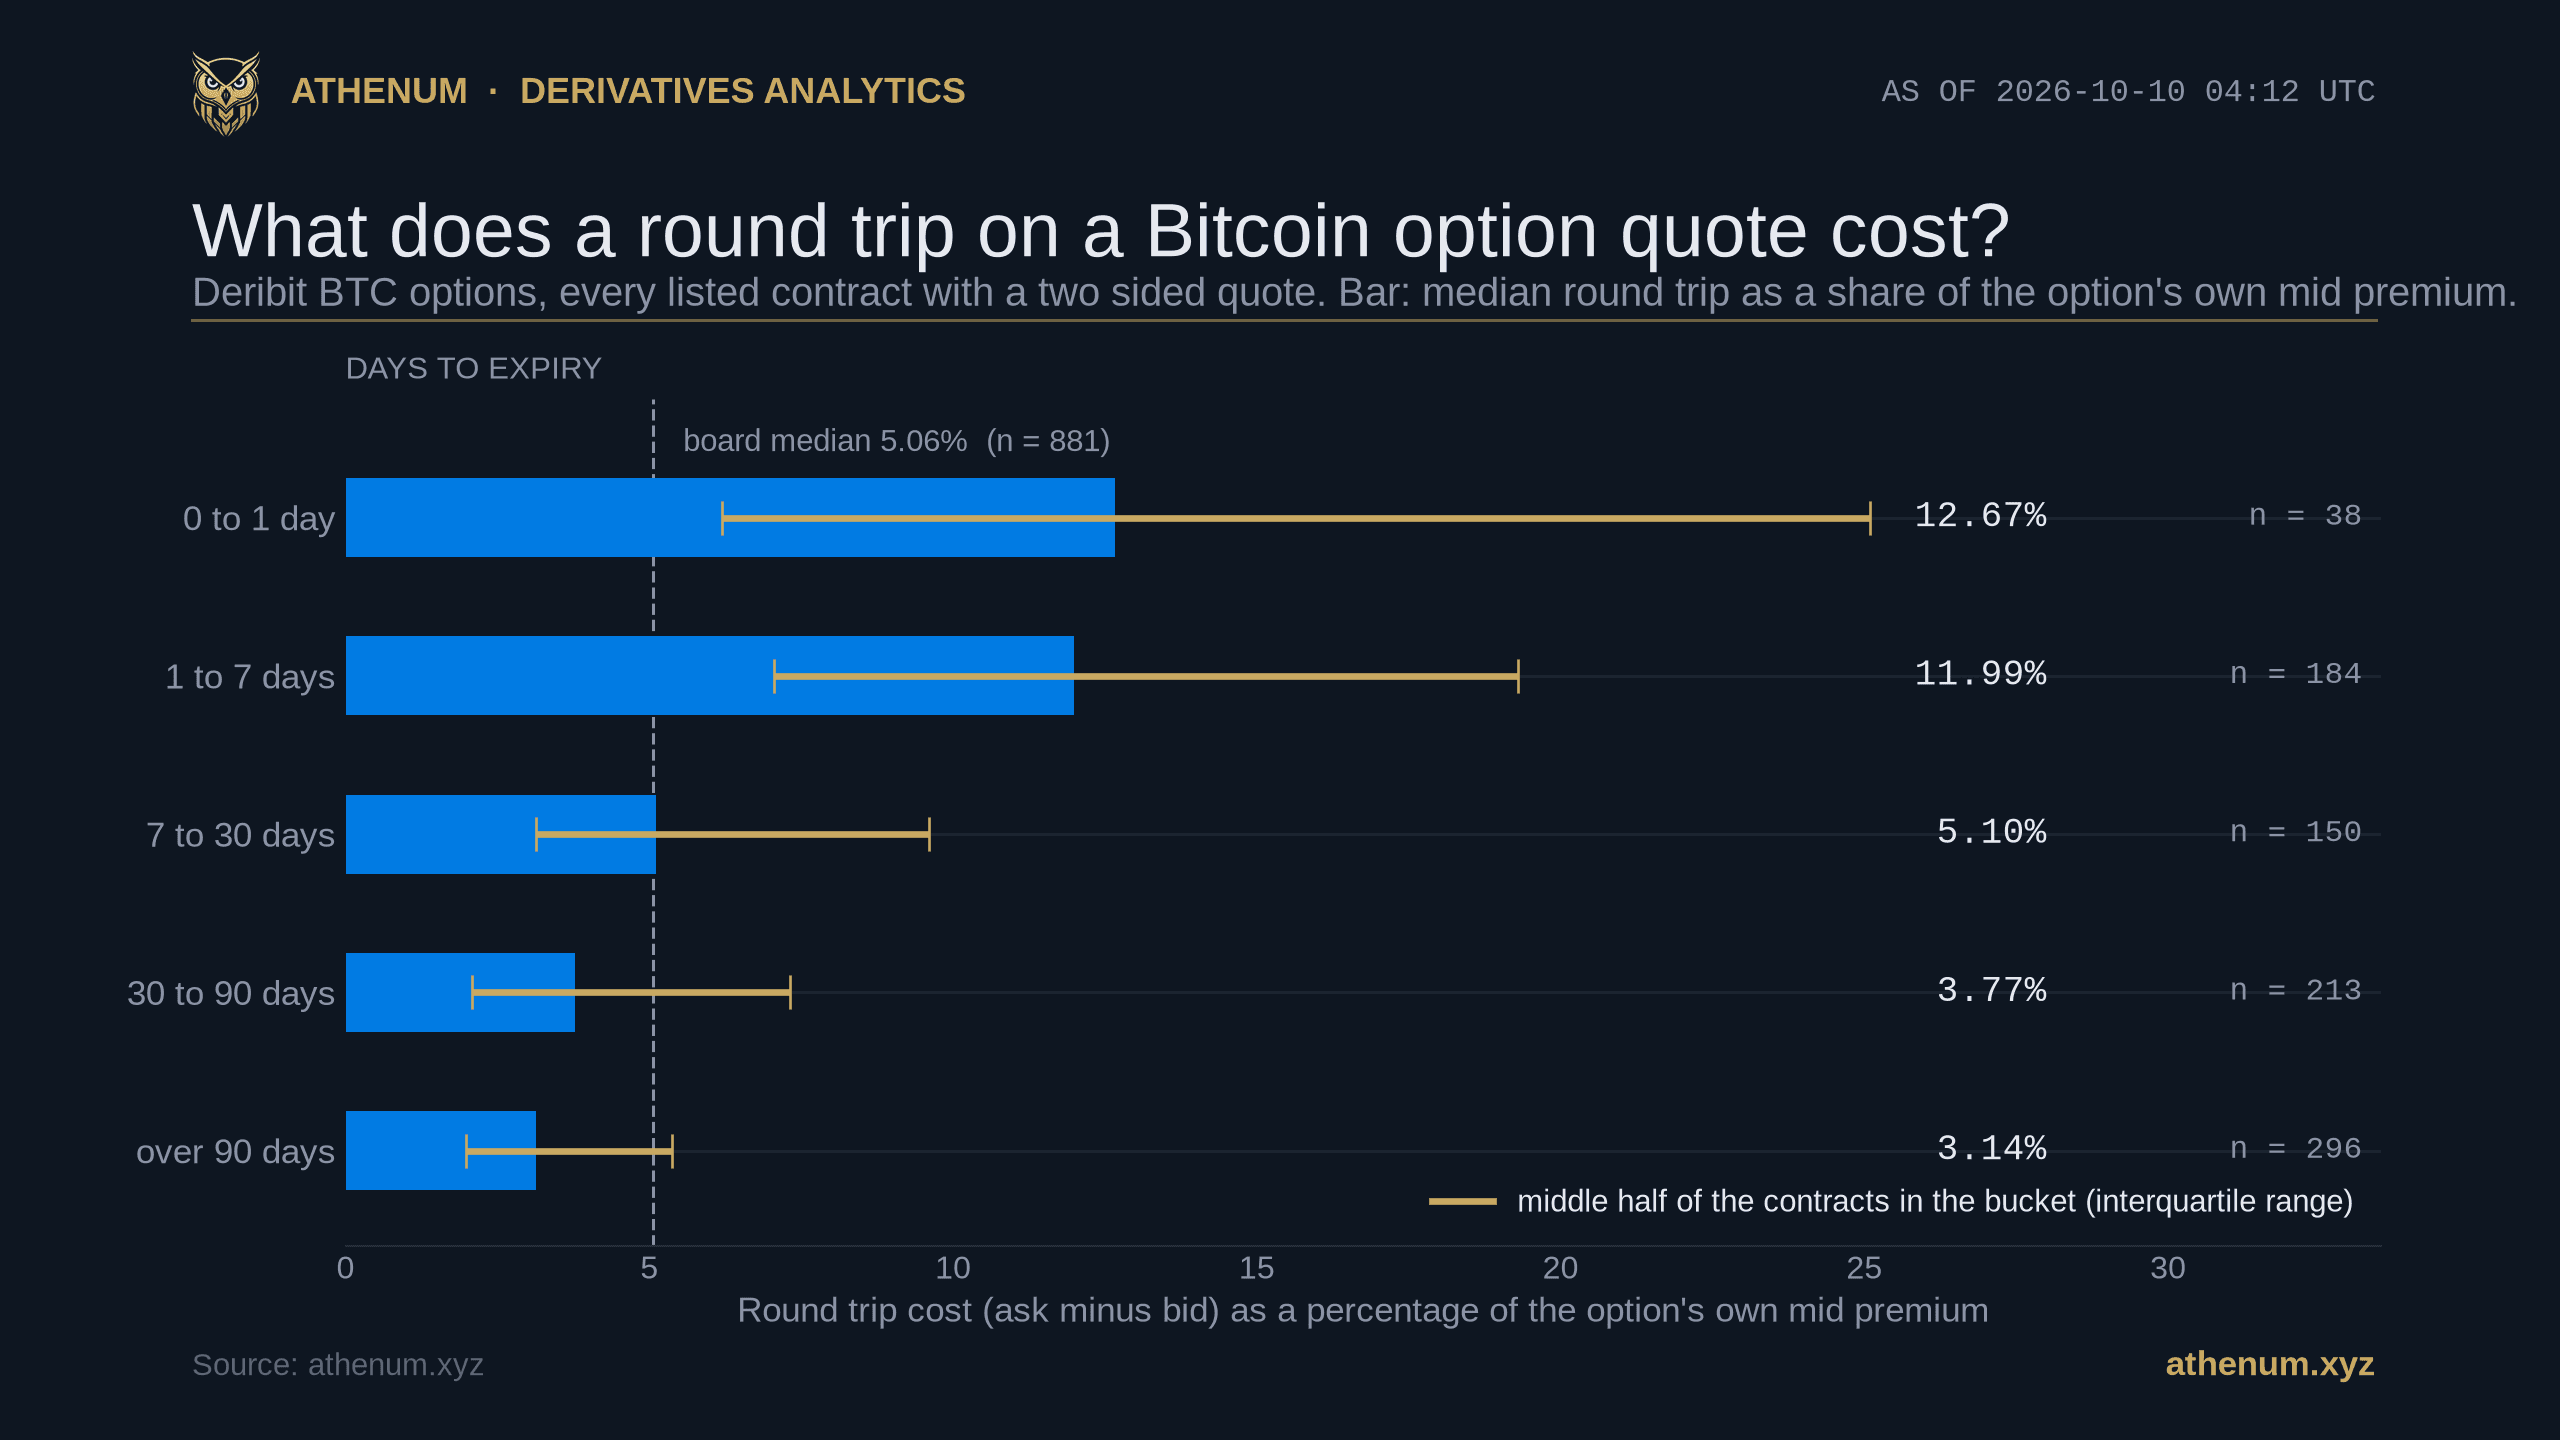
What does a round trip on a Bitcoin option quote cost?
A median of 5.06 percent of the option's own premium, measured across the 881 listed Deribit BTC contracts that had a bid and an ask at 2026-10-10 04:12 UTC. Three Bitcoin prices appear in this post and they are different readings rather than a disagreement: $82,608.21 is the Deribit index at the option stamp, $82,637.00 against $82,637.50 is the perpetual's own quote at that instant, and $82,642.83 is Athenum's cross venue bar at 04:00 UTC. The quantity here is the full width of the quote, ask minus bid, divided by the midpoint between them. That is what a trader gives up buying at the offer and selling at the bid with nothing moving in between, so it is the price of changing your mind immediately, and it is paid before the position has any view to be right or wrong about. A single crossing, paying the offer and holding, is exactly half of that by construction.
Time to expiry | Contracts with a two sided quote | Median round trip, share of premium | Middle half | Median width, bps of underlying |
|---|---|---|---|---|
Under 1 day | 38 | 12.67% | 6.20% to 25.09% | 50 |
1 to 7 days | 184 | 11.99% | 7.05% to 19.30% | 20 |
7 to 30 days | 150 | 5.10% | 3.14% to 9.60% | 10 |
30 to 90 days | 213 | 3.77% | 2.08% to 7.32% | 10 |
Over 90 days | 296 | 3.14% | 1.98% to 5.37% | 25 |
Whole board | 881 | 5.06% | 2.55% to 10.00% | 20 |
The gradient does not line up with where the board is busy, and that is worth separating out before reading it as a liquidity story. Activity concentrates in the middle of the curve: the contracts expiring between one and thirty days carry 72.9 percent of the board's 22,390.8 BTC of 24 hour volume, while the ones expiring inside a day carry 5.3 percent of it and hold 0.7 percent of the open interest. So the most expensive bucket to round trip is not the most traded one, it is the emptiest, and the widest relative spreads on this board sit where almost nobody is. Quotes on the expiring contracts are the widest on the board in absolute terms, a median of 50 bps of underlying against 10 bps in the seven to ninety day buckets, and that column is U shaped rather than falling, because the contracts beyond ninety days widen back out to 25 bps on much larger premiums. Inside the expiring bucket the strikes traders actually watch are also the cheapest things listed, and there both halves of the fraction push the same way: of the 38 contracts expiring within a day, the 13 struck within 2.5 percent of the index had a median mid of 0.00515 BTC, about $425, and a median round trip of 32.56 percent of that premium. Thirteen observations is a thin base and the figure is quoted as one, but the direction is not in doubt, because a wider quote divided by a smaller premium can only move one way.
The dispersion matters more than the ranking. The middle half of the whole board runs from 2.55 to 10.00 percent, the tightest single contract was 0.20 percent and the widest were quoted with the ask at three times the bid. The buckets' interquartile ranges overlap each other at every boundary, so the honest reading of the table is that time to expiry shifts the distribution rather than sorting the contracts.
Is this new, or has it been measured before?
The metric is not new and the prior art deserves naming before anything else. Relative spread, the quote width over the midpoint, is standard in the peer reviewed work on this exact board. Atanasova, Miao, Segarra and Willeboordse use Deribit trade and quote data from January 2021 to December 2024 and report that a one standard deviation fall in aggregate market maker gamma inventory is associated with what they report as a 0.12 percent increase in effective spreads for out of the money calls and 0.19 percent for puts, in their units rather than ours (Aggregate illiquidity and crypto option returns, Finance Research Letters 85, 2025). Their quantity is the effective spread, measured from trades, which is not the quoted spread measured here, and theirs is a four year panel where this is one instant. Closer still to the quantity used here, the same authors' working paper Illiquidity Premium and Crypto Option Returns computes relative spreads on Deribit directly and attributes them to hedging, inventory and asymmetric information costs.
In that literature the relative spread is often a cleaning filter rather than a result, and the filter is the reason to publish a census instead of an average. A 2026 study of hedging on this board drops every quote wider than 50 percent of the mid, and first removes every row that lacks either a bid or an ask, a step that alone cost it 27.0 percent of its raw rows (Deep Hedging Under Realistic Market Frictions). If the contracts that are quoted worst are discarded before the analysis begins, the published picture of this market is conditioned on the contracts that were already well quoted, and nobody counts the rest.
That same paper also predicts something checkable in our data, and it checks out. It warns that Deribit's tick produces artificial spikes in relative spread at exact fractional values such as 0.67 and 1.0 on very low priced contracts, regardless of true liquidity. On our stamp the single most common relative spread on the BTC board is exactly 0.6667, on 23 of the 881 contracts, with 1.0 appearing on 10 more, and the ETH board repeats the pattern at 13 and 10. Those are a one tick bid against a two or three tick ask, not a market maker charging a hundred percent. Applying their 50 percent filter to our board removes 39 of the 881 contracts and moves the median from 5.06 to 4.69 percent, so the headline is not an artifact of those rows, and the artifact is real but small.
What this post adds is therefore not the metric. It is the frame: a full board at a single named instant, every listed contract counted including the ones nobody will bid for, with the observation count printed next to every median so a reader can see which claims rest on 38 contracts and which rest on 296.
Closer to home, Athenum's earlier reading of spreads on perpetuals and spot concluded that the tightest quotes in crypto are pinned by the tick and not by competition. That finding only partly carries across to this board. Deribit quotes BTC options on a two step tick ladder, 0.0001 BTC up to a price of 0.005 BTC and 0.0005 BTC above it, which at this stamp puts 167 of the 881 two sided contracts on the fine tick and 714 on the coarse one. Measured against each contract's own applicable tick at the mid, 110 of the 881 quotes were exactly one tick wide and another 161 were exactly two. So on 87.5 percent of the board the quote is wider than the exchange's floor, and on 69.2 percent it is wider than two ticks, which makes the width a market maker's choice on most of the board rather than a mechanical minimum. On the eighth that is pinned to the floor, the floor alone already costs a median of 6.45 percent of premium to round trip, with a middle half of 3.57 to 18.18 percent.
How does that compare with the perpetual on the same screen?

The same stamp, with both instruments put in the perpetual's unit so they can be compared at all: quote width as basis points of the underlying exposure the position carries, not of the premium paid for it. The BTC perpetual was quoted $82,637.00 bid against $82,637.50 ask, a half dollar wide. The gold whiskers are the middle half of each option board, and the lower end of the BTC option range, 5 basis points, is still 83 times the perpetual's width.
Comparing an option spread with a perpetual spread needs care, because the natural denominators differ. A perp spread is quoted against the price of the exposure; an option spread, expressed as a share of premium, is quoted against a fraction of that exposure. The Deribit BTC and ETH boards measured here are inverse contracts: they settle one coin of underlying per contract and are quoted in coin, so the quote width converts directly into basis points of the underlying, and the comparison becomes exact.
On that common footing, the BTC perpetual was 0.0605 bps wide at the stamp, $82,637.00 against $82,637.50, while the median BTC option quote was 20 bps wide, 331 times as much. The ETH board reads the same way at a different level: a 0.201 bps perpetual against a 30 bps median option quote. Even the best quarter of the BTC option board, at 5 bps or tighter, costs 83 times the perpetual.
This is the practical consequence for anyone choosing an instrument to express a directional view, and it is the reason the cost of holding a perpetual is dominated by funding rather than by execution, while an options position pays its spread at the two ends of the trade and not over its life. It is not an argument that options are overpriced. A market maker quoting a convex instrument hedges it continuously in the underlying and carries gamma risk the perp maker does not, and the spread is where that is charged. It is an argument for knowing the number before the trade rather than after it, and the free options profit calculator lets you enter a real fill price rather than the mid.
How much of the board has no bid at all?

The whole listed board at one instant, not a filtered sample. The red block is contracts quoted on one side only: an ask exists, so the position can be bought, and no bid exists, so it cannot be sold at any price at this stamp. Every one of the 69 BTC contracts in that block had an ask, and none of the 950 was missing an ask.
Sixty nine of the 950 listed BTC contracts had no bid at any price. That is not the same as a wide spread; it is the absence of an exit. Every one of the 950 had an ask, so the board was happy to sell at this instant and, on 7.26 percent of it, unwilling to buy.
Three details stop this from being a story about dead listings. Sixty three of the 69 carry open interest, 7,986.8 BTC of it, so these are contracts somebody already holds. Forty five of the 69 traded within the previous 24 hours, so they are not stale rows nobody has looked at. And the stranded open interest is 2.11 percent of the board's 377,708.2 BTC, which is small enough to say that the problem is concentrated rather than systemic, and large enough that it is worth checking before you need the exit rather than when.
The ETH board is worse on the census counts: 82 of 846 with no bid, 74 of them carrying open interest, and 3.44 percent of the board's open interest sitting in contracts with no quoted exit. Its 764 two sided quotes carry a median round trip of 4.94 percent, with a middle half of 2.76 to 11.19 percent, so the two boards sit at almost the same level in premium terms while ETH is the wider of the two in absolute terms at 30 bps against 20. Activity is thin on both: 497 of the 950 BTC contracts and 495 of the 846 ETH contracts did not trade at all in the preceding 24 hours.
Filtering down to the parts of the board that are actually in use moves the headline, and it is honest to show both. On the 408 traded contracts that were also two sided the median round trip is 7.03 percent, with a middle half of 2.90 to 15.24 percent, worse than the board median of 5.06, because trading concentrates in the cheap near dated contracts. On the 720 two sided contracts that carry open interest it is 4.65 percent, with a middle half of 2.29 to 11.11 percent. The board median sits between the two, and none of the three readings is the single right answer.
Where was the perpetual liquidity on the same morning?

Athenum's normalized cross venue feed on the 2026-10-10 04:00 UTC bar, with BTC at $82,642.83. Deribit, the venue whose option board this post measures, is the smallest of the perpetual boards shown here at $0.83B, 3.9 percent of the $21.48B the named venues sum to. Funding at that bar spans 0.010863 percentage points, from minus 0.000863 percent on Bybit to plus 0.010000 percent on Bitget.
On the 2026-10-10 04:00 UTC bar, Athenum's cross exchange view puts Bitcoin at $82,642.83 and Bitcoin perpetual open interest at $7.62B on Binance, $4.63B on Bybit, $3.16B on Hyperliquid, $2.76B on Bitget, $2.47B on OKX and $0.83B on Deribit. Those six named legs sum to $21.475B, which prints as $21.48B, while the rounded figures above add to $21.47B; the feed's own aggregate field reads $21.635B for the same bar, 0.74 percent above that unrounded sum, so every share quoted here is taken against the sum of the named venues and not against that aggregate field. Funding at the same bar ranged across 0.010863 percentage points, from minus 0.000863 percent on Bybit to plus 0.010000 percent on Bitget.
Two readings in that bar bear on the options measurement. The first is that Deribit, the venue whose option board this post measures, runs the smallest perpetual board of the six at 3.9 percent of the named total, so the underlying a market maker hedges an option with is mostly quoted somewhere else, and the cost of moving between the two venues sits inside the option spread. The second is a check on our own numbers rather than a finding: Athenum's feed reports total Bitcoin option open interest of 377,710.2 BTC against the 377,708.2 BTC this post summed directly from the board's 950 contracts, a difference of 2.0 BTC, or 0.0005 percent. These are two separate read paths over the same exchange rather than two independent sources, so the agreement checks our plumbing and not Deribit's, but agreement to five significant figures is the kind of check that should be run before publication rather than claimed after it.
How do you check this on your own board?
1. Pull the whole board in one call. Deribit publishes it at /api/v2/public/get_book_summary_by_currency with currency BTC and kind option, which returned all 950 contracts with bid, ask, mark, open interest and 24 hour volume, and it asked for no key. The companion /api/v2/public/get_instruments gives each contract's strike, expiry and tick size.
2. Count what is missing before you measure what is there. A contract with a null bid is not a wide spread, it is an absent one, and dropping those rows silently is how a board of 950 becomes a board of 881 without the reader being told. Report both numbers.
3. Divide by the mid, not by the mark. The mark is the exchange's model price and it sits inside the quote, so dividing by it flatters the spread on exactly the contracts where the model and the market disagree most.
4. Keep the two denominators apart. Quote width over premium answers what the trade costs relative to what it costs to own; quote width in basis points of underlying answers what it costs relative to the risk it carries. This post publishes both because each one alone is misleading, and the free profit and loss calculator takes a real fill rather than a mid for whichever you care about.
5. Record the stamp and treat it as one draw. Spreads on this board move with the hour and the day, so a single reading is an observation and not a constant, and the next section is about how much that limits what is above.
What this measurement does not show
This is one stamp, taken at 2026-10-10 04:12 UTC, and that is the single largest limit on everything above. It is a Saturday, in the small hours of European trading, which is among the thinner windows an options board sees in a week. A reading taken on a Wednesday afternoon would almost certainly be tighter, and nothing here establishes by how much; the numbers describe this instant on this board, not a weekly average, and the distribution across stamps is the obvious next measurement rather than something this post can assert.
A second capture, taken 17.5 minutes after the first, at 2026-10-10 04:30:04 UTC against the first stamp's 04:12:36 UTC, says how much of that is noise and how much is the board. The BTC median round trip moved from 5.06 to 5.13 percent, its middle half widened from 2.55 to 10.00 percent out to 2.52 to 10.07 percent, and the counts did not move at all: 881 two sided quotes and 69 with no bid at both stamps. The ETH board went the other way, its median tightening from 4.94 to 4.89 percent while its no bid count rose from 82 to 83 and its two sided count slipped from 764 to 763. Two boards moving in opposite directions over the same seventeen minutes is itself a reason not to read either number as a constant. So the reading is not a one second fluke of a single refresh, and that is all the second stamp proves. Two captures 17.5 minutes apart in the same thin Saturday window cannot speak to the Wednesday afternoon question at all, because they share almost every condition that question is about.
The gradient by expiry rests on uneven counts, from 38 contracts in the under one day bucket to 296 beyond ninety days, and every bucket's interquartile range overlaps its neighbour's, which is why the table carries the counts and the ranges instead of a clean ranking. Every quartile here is computed with the exclusive, Weibull plotting position rather than the linear interpolation most spreadsheets default to, which matters only in the thinnest bucket: the under one day range reads 6.20 to 25.09 percent on this definition and 6.28 to 23.49 percent on the conventional one. The whole analysis covers Deribit alone, and that limit has grown sharper rather than milder over the past year. Deribit is still the largest crypto native options venue and the one whose full board is readable without a key, which is why it is the board measured here, but it no longer holds a majority of all Bitcoin options open interest, against well over ninety percent of it five years ago: options on the US listed spot Bitcoin ETFs have grown into a very large share of the total, and Binance and others carry meaningful books of their own. That shift is taken from public reporting rather than measured here, which is why it is stated as a direction and not as a number. So this is a measurement of one venue's quoting behaviour, not of the Bitcoin options market, and the relative spreads on an ETF option quoted on a US exchange are a different question with a different microstructure behind it.
The spread is also not the only cost of the trade, and on this board it is not even the only one that scales with premium. Deribit charges an option fee of 0.03 percent of the underlying index price per contract and caps it at 12.5 percent of the option's own price, and that cap exists precisely because premiums on cheap contracts get small enough for a flat underlying based fee to swallow them, which is the same cause that produces the 12.67 percent figure in the first row of the table, a small premium sitting in the denominator, rather than the same calculation: the 12.5 and the 12.67 are unrelated quantities that happen to land near each other. A trader crossing the spread on an expiring at the money contract can therefore pay the widest quote on the board and run into the fee cap on the same ticket. Fees, the hedge in the underlying and the funding on that hedge all sit outside what is measured here, and implied volatility against what the asset actually did is a separate question from what the quote costs to round trip.
Finally, nothing above says a 5.06 percent round trip is too expensive. It says it is the number, that it is 331 times the perpetual's in the same unit, and that about half of it is paid the moment the position is opened and the rest when it is closed, rather than accruing over the life of the position.
Every quote, strike and expiry above was read from Deribit endpoints that asked for no key, so the board half of this post can be rebuilt from scratch by anyone with an hour. The cross venue open interest and funding come from Athenum's own normalized feed over Binance, Bybit, OKX, Bitget, Hyperliquid and Deribit, and every calculator beside it stays free: no account, no email, no usage limits. The terminal those cross exchange readings come from opens on a free 7 day Pro+ trial at app.athenum.xyz.
One terminal. All the data.
Liquidations, orderbook depth, whale walls & open interest from 4 exchanges, all real-time, in one place.
No credit card required

Athenum Analytics
Athenum Analytics is our three-person editorial team covering crypto derivatives, market data and macroeconomic context.