Table of Contents8 sections
- What does a realized volatility number actually contain?
- How precise is a 90 day volatility number?
- Do the five estimators actually disagree with each other?
- Does it matter which hour you call the daily close?
- Does annualising with 365 or 252 change the answer?
- Does the venue you sample change it?
- How do you get a number you can actually rely on?
- What does this post not say?
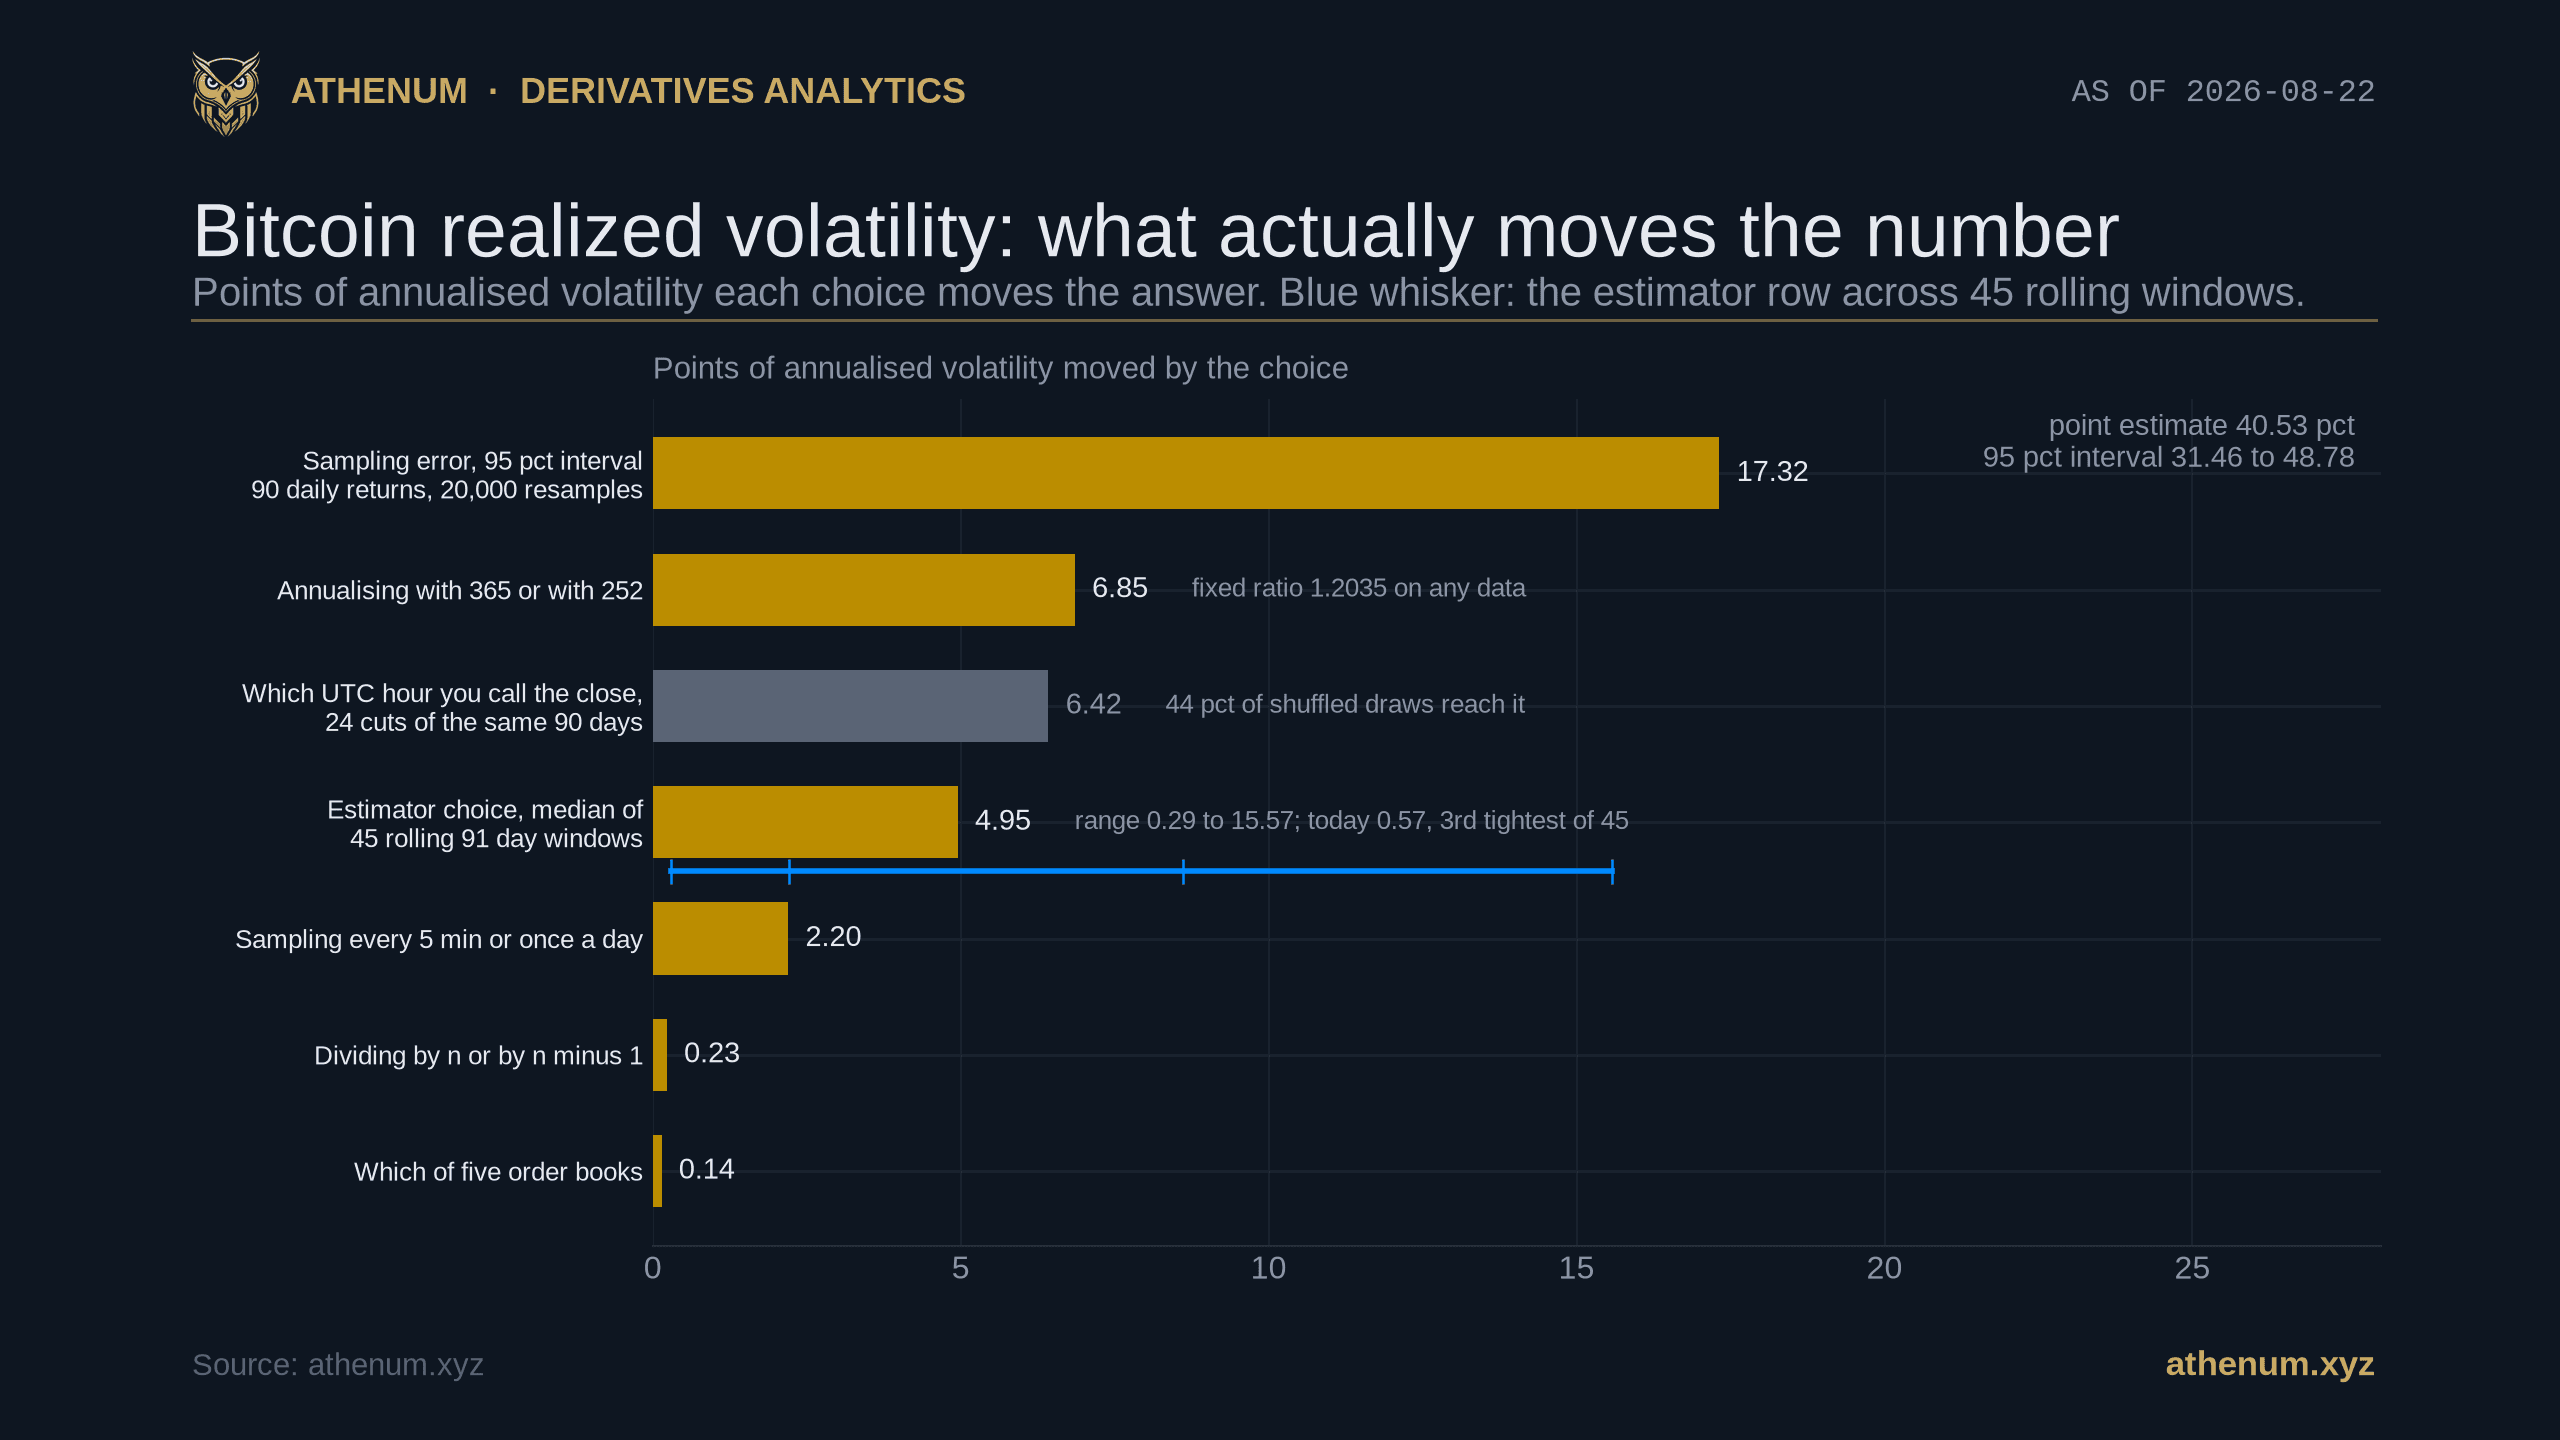
TLDR. Realized volatility is published everywhere as a single number and almost never with an interval. We measured Bitcoin's, then measured how much every choice behind it moves the answer. The question here is whether a whole window summary statistic stays put when you re-partition the same tape, which is a different question from whether the hour of day carries return, and we treat it as such throughout. On Binance's BTCUSDT perpetual over the 91 UTC daily bars from 2026-05-23 to 2026-08-21, giving 90 returns, close to close annualised volatility read on 2026-08-22 is 40.53%. Resampling those same 90 returns 20,000 times puts 95% of the draws between 31.46% and 48.78%, a band 17.32 points wide. That band is wider than any single methodological choice we tested: the annualisation convention moves the number 6.85 points, the choice among five textbook estimators a median of 4.95 points across 45 rolling windows, the sampling frequency 2.20 points, and the venue you sample 0.14 points across five books. We also re-cut the identical tape at all 24 possible daily closes and got a 6.42 point spread, then tested it against a tape with no hour of day structure and found that chance alone produces a median spread of 6.14 points when the returns are shuffled and 7.25 when they are block resampled. The observed value sits in the middle of what noise makes, so that one is not a finding, it is a picture of the error bar.
What does a realized volatility number actually contain?
Realized volatility is the standard deviation of an asset's returns over a past window, scaled to a year. Nothing about it is a forecast. But the phrase hides at least six decisions, and none of them is usually stated next to the number:
1. The window. How many observations, ending when. 2. The sampling interval. Daily closes, hourly closes, five minute closes. 3. The estimator. Close to close, or one of the range estimators that also read the high and the low. 4. The annualisation factor. The square root of 365, or of 252, or of 8,760 for hourly data. 5. The small conventions. Dividing by n or by n minus 1, subtracting the sample mean or assuming it is zero. 6. The price series. Which venue, and whether its daily bar is a real close or an average.
Our own earlier explainer on realized versus implied volatility describes realized volatility as the annualised standard deviation of returns over a 7 or 30 day window and stops there. That is the industry norm, and it is what this post is interrogating, starting with our own back catalogue.
Everything below is measured on one instrument and one window so the comparisons are clean: Binance's USD-M BTCUSDT perpetual, 91 UTC daily bars from 2026-05-23 to 2026-08-21, which is 90 returns. Unless a section says otherwise, the convention is log returns, sample standard deviation with n minus 1, mean subtracted, annualised with the square root of 365. Every figure was pulled on 2026-08-22.
How precise is a 90 day volatility number?
Much less precise than the two decimal places it is usually printed with. Measured on 2026-08-22, the point estimate is 40.53%. Resample those 90 returns with replacement 20,000 times, recompute the same estimator on each resample, and 95% of the 2026-08-22 draws land between 31.46% and 48.78%.

The same estimator, the same 90 days, resampled 20,000 times. The point estimate is 40.53 per cent and the middle 95 per cent of the draws is 17.32 points wide. The textbook normal approximation gives 34.61 to 46.45, which is 5.48 points narrower, because it assumes returns that Bitcoin does not deliver.
Two things are worth separating here.
The 17.32 point width is the more honest of the two, and it is still a lower bound. The textbook shortcut, in which the standard error of a volatility estimate is roughly sigma divided by the square root of 2n, gives 3.02 points and a 95% interval of 34.61% to 46.45%. That is 5.48 points narrower. The shortcut assumes normally distributed returns and crypto daily returns are fatter tailed than that, with an excess kurtosis of 2.35 on this window, so the shortcut flatters the estimate. But the resampling above assumes the returns are independent, which volatility clustering makes false, and that assumption also runs in the flattering direction. Redo it as a block bootstrap, which keeps runs of volatile days intact, and the interval widens again. How far depends on the scheme, so here is the range rather than one number: across the circular and the non-wrapping moving block at block lengths of 5 and 10, 12,000 draws each, the width runs from 18.21 to 22.90 points, against 17.30 for the independent resample on the same setting. Every scheme widens it. So treat 17.32 as the floor, not the ceiling.
The practical consequence is a number worth memorising. To pin annualised volatility to plus or minus 2 points at 95% confidence using daily returns, you need roughly 1,687 observations, which is about 4.6 years of tape. The textbook shortcut is more optimistic and says 789 observations, about 2.2 years, but the shortcut is the one we just showed to be too narrow, so we scale from the bootstrap interval instead and quote the larger figure. By then the thing you are measuring has moved: the four consecutive 91 day windows in the next section run 39.16%, 54.78%, 41.13% and 38.08% on close to close. So a daily sampled realized volatility number is, structurally, either imprecise or out of date.
This is not a criticism of the metric. It is an argument for printing the interval next to it, which essentially nobody does.
Do the five estimators actually disagree with each other?
It depends entirely on the window, and the honest summary is a distribution rather than a number. Across 45 rolling 91 day windows stepped weekly and ending between 2025-10-17 and 2026-08-21, the spread between the highest and lowest of the five estimators has a median of 4.95 points, an interquartile range of 2.21 to 8.60, a minimum of 0.29 and a maximum of 15.57. 21 of the 45 windows spread more than 5 points and only 5 of them spread less than 1.
The current window is one of the tight ones, and we are flagging that rather than generalising from it: its 0.57 point spread is the 3rd tightest of the 45. On it, all five land within 0.57 points of each other: close to close 40.53%, Parkinson 40.84%, Garman-Klass 41.09%, Rogers-Satchell 40.70%, Yang-Zhang 40.52%. If you had spent an afternoon choosing among them you would have bought yourself a 1.4% relative difference, against an interval 17.32 points wide.

Four consecutive 91 day windows. The estimators agree to within 1.24 points in the calm quarter and split by 10.65 in the quarter containing 2025-10-10. Close to close is the lowest bar in three of the four, because it is the only one of the five that never looks at the high or the low.
Now run the same five on the 91 day window from 2025-08-22 to 2025-11-20 and they separate: close to close 39.16%, Parkinson 45.92%, Garman-Klass 48.02%, Rogers-Satchell 49.81%, Yang-Zhang 48.48%. A 10.65 point spread, 27.2% in relative terms, on identical data.
The four windows are the consecutive 91 day blocks 2025-08-22 to 2025-11-20, 2025-11-21 to 2026-02-19, 2026-02-20 to 2026-05-21 and 2026-05-22 to 2026-08-20, and all twenty figures were computed on 2026-08-22. Note what the last of those four is: it is this post's own headline window shifted back by a single bar, sharing 90 of its 91 bars. It reads 38.08% where the headline reads 40.53%. Swapping one return out and one return in, a 1.58% day for a 7.02% day, moves close to close 2.447 points and drops the estimator spread from 2.25 to 0.57. That is the entire argument of this post in one line, and it happened by accident inside our own table.
Window | Close to close | Parkinson | Garman-Klass | Rogers-Satchell | Yang-Zhang | Spread |
|---|---|---|---|---|---|---|
Aug to Nov 2025 | 39.16% | 45.92% | 48.02% | 49.81% | 48.48% | 10.65 |
Nov 2025 to Feb 2026 | 54.78% | 55.12% | 55.35% | 55.24% | 54.12% | 1.24 |
Feb to May 2026 | 41.13% | 44.16% | 45.37% | 45.49% | 44.99% | 4.36 |
May to Aug 2026 | 38.08% | 39.71% | 40.33% | 40.11% | 39.94% | 2.25 |
The mechanism is one day. On 2025-10-10 BTCUSDT opened at 121,579.40, ran to a high of 122,497.00 and a low of 101,516.50, a high to low range worth 17.26% of the open against an open to low fall of 16.50%, and then closed at 112,714.90, taking back 55.8% of the fall measured from the open. Close to close records that day as -7.57%. The range estimators read the high and the low instead, and the quantity they actually take is the log range, 18.79% that day, which enters Parkinson's formula divided by the square root of four times the natural log of two. One day of that kind inside a 91 day window is enough to move the estimators 10.65 points apart, and a close only estimator is the one that misses it.
Which is why the ranking in the table is not random: close to close is the lowest of the five in three of the four windows, and in the calm quarter where it is not, it sits 0.66 points above the lowest. The range estimators are more statistically efficient, in the specific sense that their variance is lower for the same sample, and the peer reviewed figures are roughly 4.9 for Parkinson, 7.4 for Garman-Klass and 6.0 for Rogers-Satchell at zero drift. Part of the ordering is arithmetic rather than information, and it is small: these estimators are unbiased for the variance, not for its square root, so taking the root biases each of them low by an amount that shrinks with its efficiency. At 90 observations that is 0.114 points for close to close and 0.023 for Parkinson, a differential of 0.091 points, which is about a sixth of the current window's whole spread.
Two honest caveats. Under the assumptions where these estimators are derived, all of them target the same quantity, so a reader who says the calm window spread of 0.57 points is simply sampling noise is right, and that is exactly the reading we are endorsing. And Yang-Zhang is built to add an overnight jump term that a market trading continuously barely has, so on a perpetual it collapses toward Rogers-Satchell, which is what the table shows: the two are within 1.35 points in all four windows.
Does it matter which hour you call the daily close?
We thought it might, and it does not. This is the section where our own first answer was wrong.
A "daily close" on a market that never shuts is a convention. The UTC midnight boundary is a choice, and there are 24 of them. So we took the 2,184 hourly closes in the same window and built 24 separate daily series, one per boundary hour, each with 90 returns, and computed close to close volatility on each.
The 24 answers run from 38.27% at the 04:00 UTC boundary to 44.69% at the 14:00 UTC boundary, a spread of 6.42 points around a median of 40.98%. (The boundary is the hour the daily bar closes, so the 00:00 boundary is the ordinary UTC day and reproduces the 40.53% headline exactly, which is how we caught ourselves labelling these an hour early on the first pass.) Written up on its own, that is a striking result: the same tape, the same formula, and a 6.42 point swing depending only on where you cut the day.

The 24 legitimate answers, and the two shaded bands showing how wide chance alone makes that spread. The observed 6.42 points is indistinguishable from the spread a tape with no hour of day structure produces: 44 per cent of shuffled draws come out at or above it, and the block bootstrap median is higher still at 7.25.
A neighbouring question, whether the hour of day carries return at all, is a different measurement on the same clock and we ran it separately in crypto trading hours and UTC seasonality. This section is not about when Bitcoin moves. It is about whether one number computed over a whole window stays put when the window is cut a different way.
Then we tested it, twice, and it failed both times.
Test one, a null distribution. Shuffle the 2,183 hourly log returns into a random order, rebuild the price path, re-run the identical 24 cut procedure, and repeat 2,000 times. That tape has no hour of day structure by construction. Its median spread across the 24 cuts is 6.14 points, and 44% of the draws come out at or above our observed 6.42. Repeat with a 24 hour block bootstrap, which preserves the clustering of volatile hours that shuffling destroys, and the median null spread rises to 7.25 points, with 66% of draws at or above the observed value. That second null is the more realistic tape but the less clean test, because a 24 hour block also preserves the hour of day pattern it is supposed to be removing; the shuffle is the honest null and the block version is a robustness check. Our result sits inside both nulls rather than outside either: a little above the middle of the shuffle null, where 44% of draws still reach or exceed it, and below the middle of the block bootstrap.
Test two, persistence. If the 14:00 boundary genuinely captured more variance, it should do so in both halves of the window. Split the 90 days in two, 45 returns each, and re-rank the 24 boundaries. The Spearman rank correlation between the two halves is -0.175. The highest boundary in the first half is 16:00 and in the second half 09:00; the lowest is 07:00 and then 01:00. Being precise about what that does and does not show: at 24 ranks the standard error under no relationship is about 0.21, so -0.175 is well under one standard error and the test simply fails to detect persistence rather than proving its absence. What it does establish is that nothing in the ordering repeats, and the two half windows spread 10.75 and 11.63 points against the full window's 6.42, which is the behaviour of a statistic getting noisier as its sample shrinks and not of a fixed intraday effect.
So the honest conclusion inverts the striking one: the 6.42 point spread is not an anchor effect, it is a 6.42 point demonstration of how much noise sits in a 90 observation volatility estimate. It belongs in the error bar column, not the methodology column, and the grey bar in the cover chart is drawn that way for exactly this reason.
Does annualising with 365 or 252 change the answer?
By 6.85 points, and this is arithmetic rather than a measurement. The same 40.53% becomes 33.68% when you scale the daily figure by the square root of 252 instead of 365. The ratio is fixed at 1.2035 for any asset, any window and any dataset, so this number is not something we discovered on Bitcoin, it is a definitional constant we are placing on the same scale as the empirical spreads so the comparison is visible.
It matters because 252 is the trading day count of an equity market that closes at night and on weekends, and a great deal of general purpose analytics tooling carries it as a default. Crypto's major venues run continuously, so 365 is the appropriate convention, and the reference publishers use it, though only one of the three is a realized volatility publisher and the distinction is worth keeping: Coin Metrics documents annualising its realized volatility by setting the period count to 6 times 24 times 365, because crypto trades every hour of every day. The other two are implied volatility indices rather than realized ones. The BVIN whitepaper states that Bitcoin trades continuously and so uses 365 calendar days rather than 252 trading days, and CF Benchmarks documents a 365 day year convention on its volatility index, which is a day count for time to maturity rather than a rescaling of sampled returns.
One nearby figure to keep in proportion: 252 is a real convention with a real justification for a market that shuts, and using it on crypto shifts the answer by 6.85 points, which is 16.9% of the 365 figure and 20.35% of the 252 one depending on which you divide by. Dividing by n instead of n minus 1, or assuming a zero mean instead of subtracting the sample mean, changes the same number by 0.23 points in total. Those two are convention questions people do argue about, and on this data they are noise.
Does the venue you sample change it?
Barely, and that surprised us more than anything else in the post. Read on 2026-08-22, the same 90 daily returns to 2026-08-21 from five different books give: Binance USD-M BTCUSDT perpetual 40.53% and Binance spot BTCUSDT 40.52%; on the same 2026-08-22 pull, OKX BTC-USDT-SWAP 40.54%, Bybit BTCUSDT perpetual 40.53% and Coinbase BTC-USD spot 40.66%. The full spread is 0.14 points.
Book | Annualised volatility | Returns |
|---|---|---|
Binance USD-M BTCUSDT perpetual | 40.53% | 90 |
Binance spot BTCUSDT | 40.52% | 90 |
OKX BTC-USDT-SWAP | 40.54% | 90 |
Bybit BTCUSDT perpetual | 40.53% | 90 |
Coinbase BTC-USD spot | 40.66% | 90 |
That is worth holding next to the level. At 08:50:00 UTC on 2026-08-22, Athenum's cross-exchange order book put the mid price of the same asset at 77,178.05 on the Binance futures book, 77,200.00 on Binance spot, 77,183.09 on the Coinbase book and 77,236.50 on the Hyperliquid perpetual book: a span of 58.45 dollars, or 7.57 basis points, at one instant. Venues genuinely disagree about the price, which is the whole subject of our post on the Coinbase premium and the Tether discount. They do not meaningfully disagree about the volatility, because a persistent level difference cancels in a return.
The one warning that belongs here: this result holds for five real order books, each reporting its own traded closes. It does not license computing volatility from any daily series you happen to have. If a daily bar is an average of intraday prices rather than a close, close to close volatility computed on it is biased downward by construction, because averaging removes variance before you measure it. Check what your daily bar is before you difference it.
How do you get a number you can actually rely on?
Sample more finely. It is the only lever in this post that shrinks the interval rather than shifting the point.
Take the identical 90 day span and sample it five ways. The intervals in this section are the normal approximation, used here because it is the one formula that applies unchanged at every frequency and so makes the five comparable; on the daily row it reads plus or minus 5.92 points where the resampling above read plus or minus 8.66, and the same optimism applies to all five rungs. Once a day gives 40.53% from 90 returns, with a normal 95% interval of plus or minus 5.92 points. Every four hours gives 39.60% from 545 returns, plus or minus 2.35. Every hour gives 41.80% from 2,183 returns, plus or minus 1.24. Every fifteen minutes gives 40.65% from 8,735 returns, plus or minus 0.60. Every five minutes gives 40.65% from 26,207 returns, plus or minus 0.35.

The same 90 days at five sampling frequencies. All five point estimates sit inside a 2.20 point range, while the normal approximation interval shrinks from plus or minus 5.92 points at daily sampling to plus or minus 0.35 at five minute sampling, a factor of 17. The daily row resampled instead reads plus or minus 8.66, so every bar here is the optimistic version.
All five point estimates sit within 2.20 points of one another, so the extra observations are not changing the answer so much as pinning it, and the interval narrows by a factor of 17 from the daily to the five minute estimate on that common basis. Not perfectly, and the chart shows where: the hourly reading of 41.80% sits just outside the five minute interval of 40.30% to 41.00%, and the four hourly reading of 39.60% sits 0.96 points below the hourly interval, which is three quarters of that interval's half width. Once the interval gets tight enough, the residual differences between sampling frequencies stop being noise and start being real properties of the tape at that frequency.
The caveat that keeps this honest is that sampling ever finer eventually measures the market's microstructure rather than its volatility: bid ask bounce and discrete tick sizes add variance that is not price movement, and the effect grows as the interval shrinks. In this window we see no sign of it yet at five minutes, since the 5 minute and 15 minute estimates agree to 0.002 points, but that is an observation about this window and not a general licence to sample at one second. The related tick and spread mechanics are in our post on the bid ask spread and tick size.
So the practical recipe, in the order the choices matter:
1. Print an interval, or at least know it. At daily sampling on 90 days it is plus or minus roughly 9 points, not plus or minus a rounding error. 2. Sample intraday if you can. Going from daily to fifteen minute closes on the same window narrows the normal interval by a factor of 10 and costs nothing but data. 3. Use 365, and say so. The convention gap to 252 is 6.85 points on this data and 20.35% in relative terms on any data. 4. Pick one estimator and state it. Across 45 rolling windows the choice is worth a median of 4.95 points, 0.29 at best and 15.57 at worst, and if you care about capturing stress days you want one that reads the high and the low. 5. Do not tune the boundary. All 24 are equally legitimate and the spread between them is indistinguishable from noise, so choosing the one that produces the number you like is fitting to nothing. 6. State the window and the n every time. The four quarters above range from 38.08% to 54.78% on the same instrument, and the lowest of them is the headline window moved by a single bar.
You can put a volatility figure to work on the free Black-Scholes calculator, which takes it as its most sensitive input, size a position against it on the position size calculator or the Kelly criterion calculator, and see what a given path does to a leveraged position on the liquidation calculator. None of the four asks who you are.
What does this post not say?
It does not say realized volatility is unusable. It is the least opinionated risk number in common use and it beats every alternative built on a forecast. What it says is that the number carries an interval that nobody prints, and that at daily sampling the interval is large enough to swallow every methodological argument people have about it.
It does not say the estimators are interchangeable. The current window's 0.57 point agreement is the 3rd tightest of 45 rolling windows whose median is 4.95 and whose worst is 15.57, so quoting today's near-agreement as the general case would be exactly the window-picking this post argues against. The choice is close to free when nothing is happening and expensive when something is. If you are measuring stress, use an estimator that reads the high and the low.
It does not claim an hour of day result in either direction. We measured a 6.42 point spread across the 24 boundaries and then failed to distinguish it from a tape with no hour of day structure, on two independent tests. That is a null result on this window with this n, not proof that no intraday structure exists anywhere.
It does not generalise past this window and this instrument. Every figure here is Binance's BTCUSDT perpetual over 90 or 91 day windows ending 2026-08-21, with the venue comparison run on five books over the same span. Other assets have different tails, and the bootstrap interval is a function of those tails.
It does not read forward. The four consecutive quarters ran 39.16%, 54.78%, 41.13% and 38.08% on close to close, and nothing in the 2025-11-21 window's data announced the 13.65 point drop that followed it. Realized volatility is a description of what already happened, which is its whole value and also its whole limit. The forward looking counterpart, and how the two are read together, is in our post on Deribit's DVOL index.
What the post does say is narrow. One realized volatility number is a point estimate from a sample, it deserves an interval, the interval at daily sampling is roughly plus or minus 9 points, and five of the six choices behind the number move it by less than that. The cheapest real improvement available is not a better formula, it is more observations.
Every figure above except the order book snapshot, which is a single instant and gone, can be re-pulled from the same public endpoints we used, and you can re-run the ones that need a live cross-exchange view on Athenum, where the derivatives feed is normalized across venues and the 34 calculators beside it are free to use, with no account, no email and no usage limits. The terminal itself opens on a free 7 day Pro+ trial that does not ask for a card.
One terminal. All the data.
Liquidations, orderbook depth, whale walls & open interest from 4 exchanges, all real-time, in one place.
No credit card required

Athenum Analytics
Athenum Analytics is our three-person editorial team covering crypto derivatives, market data and macroeconomic context.