Table of Contents6 sections
- What is a drawdown, and why does the recovery always cost more than the fall?
- How deep is Bitcoin's own drawdown right now?
- What does leverage do to the recovery table?
- Did traders actually de-lever while price fell?
- What does it cost to hold through a drawdown?
- How do you size a position so a normal drawdown is survivable?
Practise with worked lessons
- Drawdown recovery: calculate the return needed to break even
A 25% drawdown needs a 33.33% gain to recover. Calculate peak-to-trough loss and the recovery on remaining equity, and keep deposits out of the result.
TLDR: A crypto drawdown and its recovery are not the same number. Falling 50% costs you half your capital, but getting back to even takes a 100% gain on what is left, because the gain is computed on a smaller base. The formula is recovery = d / (1 - d). Measured on Athenum's daily average cross-exchange readings, Bitcoin fell 27.6% from $81,537 on 2026-05-06 to $59,004 on 2026-07-01, and at $65,262 on 2026-07-27 it still needs 24.9% to reclaim that high. Leverage multiplies the equity drawdown until liquidation truncates it: applied as a single move, that fall puts a 3x long 82.9% down and 485% away from even before funding, and closes every long at 4x or higher outright.
What is a drawdown, and why does the recovery always cost more than the fall?
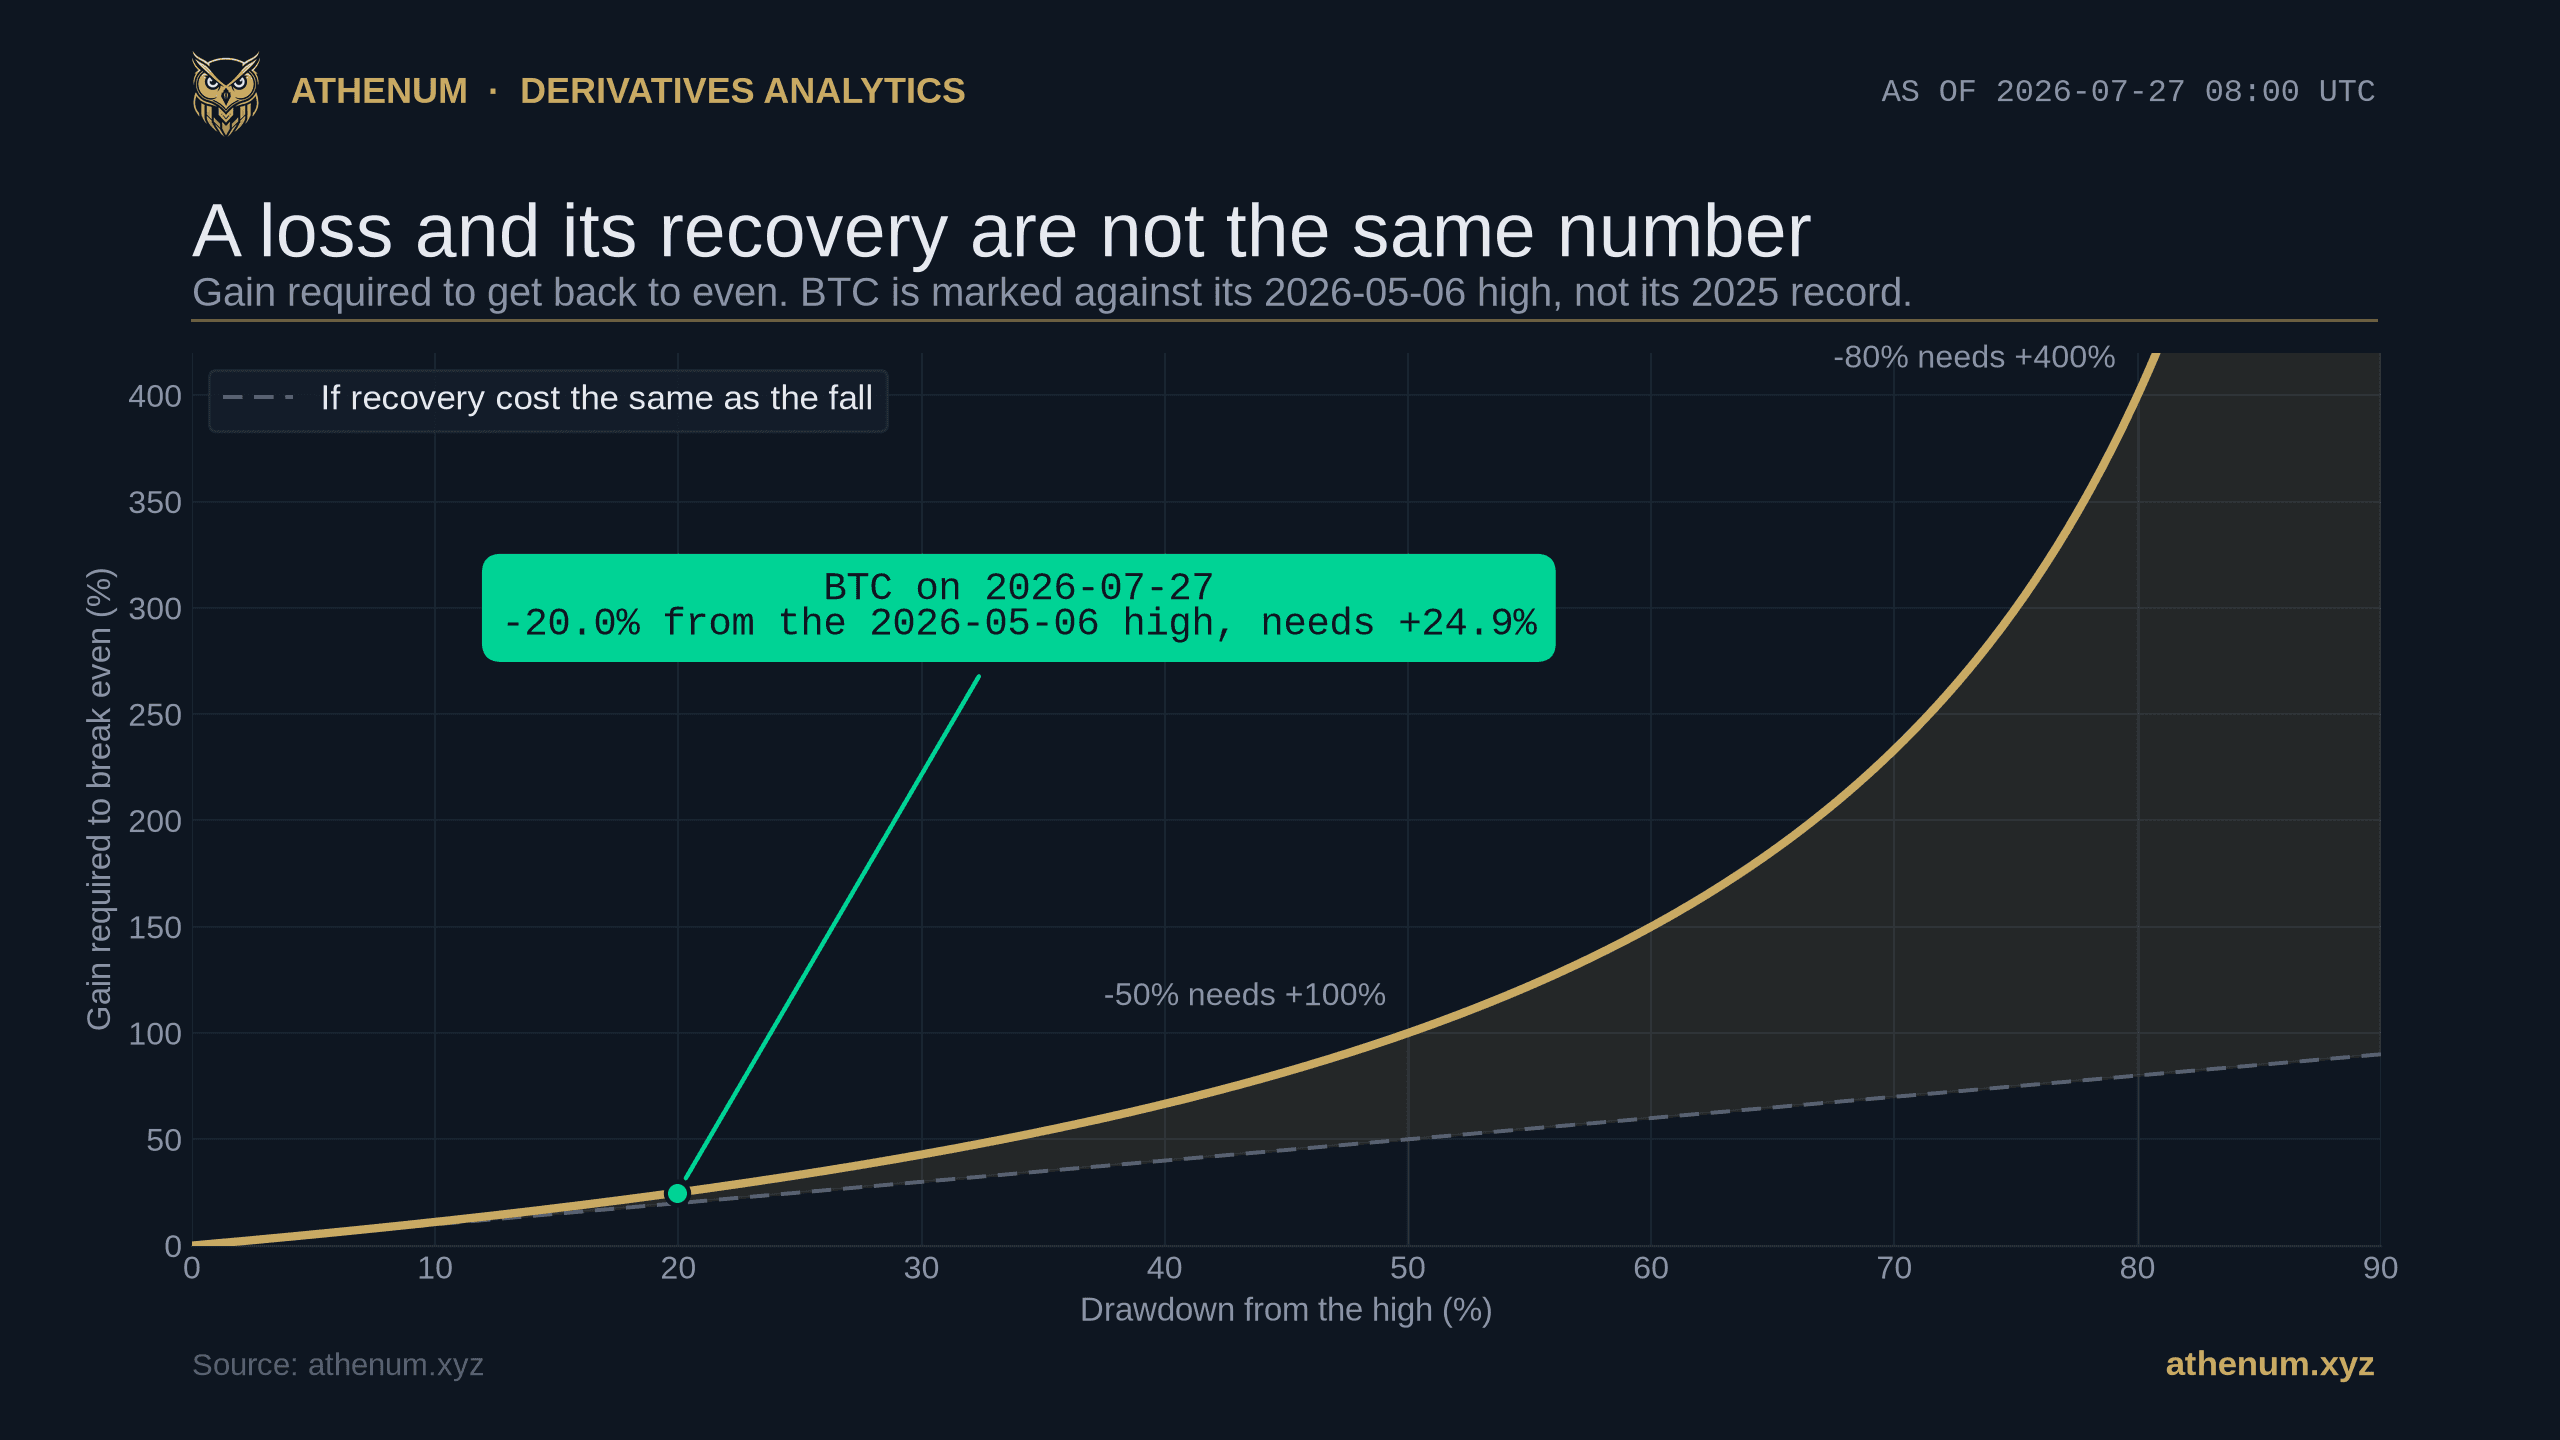
A drawdown is the percentage fall from a peak to a subsequent low, measured against the peak. If an account or an asset goes from 100 to 80, that is a 20% drawdown. The number people get wrong is the one that follows: recovering that 20% drawdown does not take a 20% gain. It takes 25%, because the gain is applied to 80, not to 100.
The general form is short enough to keep in your head. A drawdown of depth d needs a gain of d / (1 - d) to return to the old peak. The two numbers stay close while the drawdown is small, then separate quickly, because the base you are compounding from is shrinking at the same time the distance you must travel is growing. That is the whole asymmetry, and it is arithmetic rather than a market opinion, so it holds on every asset, every timeframe and every account.
Drawdown | Gain needed to break even |
|---|---|
-5% | +5.3% |
-10% | +11.1% |
-20% | +25.0% |
-30% | +42.9% |
-50% | +100.0% |
-80% | +400.0% |
The practical reading of that table is that risk control is worth more than recovery skill. Avoiding a 50% drawdown is a decision you can make in advance by sizing; earning the 100% that undoes one is not something you can decide at all. It is also why the depth of the worst loss matters more than the average loss: a strategy that wins steadily and then gives back 60% in one episode has to find 150% to get back to where it already was.
How deep is Bitcoin's own drawdown right now?
Deep enough to make the point without any hypothetical. Over the 168 daily readings from 2026-02-09 to 2026-07-27, Athenum's cross-exchange series puts Bitcoin's highest daily average at $81,537 on 2026-05-06 and its lowest at $59,004 on 2026-07-01. That is a 27.6% peak-to-trough drawdown inside that window, and it took 56 days to complete. Reversing it from the low requires 38.2%, which is 10.6 percentage points more than the fall itself. Two boundaries belong on that number before you carry it anywhere: the window opens on 2026-02-09, and Bitcoin's publicly reported record high of about $126,198 was set earlier, in October 2025, so measured from the record rather than from the May high Bitcoin is still roughly 48% down on 2026-07-27.
Three measurement notes, because a drawdown number is only as good as the series under it. The first is that window, and it is the one that moves the number most: 27.6% is the worst fall inside it, not Bitcoin's worst fall, and the 2026-07-01 low was about 53% below the October 2025 record. Every drawdown figure below is measured inside the window unless it says otherwise, because inside the window is where the live cross-exchange data sits, so read them with that boundary attached. The other two notes are about the series itself. These are daily averages of a price normalized across venues, not one exchange's candles, so they are deliberately smoother: intraday extremes are averaged away in both directions, and a drawdown measured on candle highs and lows over the same window comes out slightly deeper. Read 27.6% as the conservative floor rather than the worst tick anyone actually saw. The peak day is estimator-dependent for the same reason: 2026-05-06 is the highest daily average here, but 2026-05-11 sits within 0.34% of it at $81,263, so a series built on closes or on a single venue can reasonably name a different day in that same May cluster as the top.

Bitcoin's drawdown against its own running high: peak $81,537 on 2026-05-06, trough $59,004 on 2026-07-01, and $65,262 on 2026-07-27.
The recovery half is where the shaded area above earns its keep, because it shows the asymmetry running in the other direction. Bitcoin has rallied 10.6% off the 2026-07-01 low in the 26 days since, and that 10.6% has moved the drawdown from 27.6% below the high to 20.0% below it, 7.7 points of ground for 10.6% of gain. A gain earned on the smaller base simply does not close as much distance as the equivalent loss opened, so at $65,262 on 2026-07-27, 82 days after the peak, there is still 24.9% to find.
What does leverage do to the recovery table?
It multiplies the drawdown and then truncates it. A move of d against a position at N times leverage takes N times d out of the margin, so the equity drawdown reaches the steep part of the recovery curve at a fraction of the price move. Applying Bitcoin's own 27.6% fall to margin, without ever changing the trade, produces this.
Leverage | Equity drawdown | Gain on remaining equity to break even | Adverse move that liquidates |
|---|---|---|---|
1x | -27.6% | +38.2% | None, nothing is borrowed |
2x | -55.3% | +123.6% | 49.7% |
3x | -82.9% | +485.0% | 33.0% |
4x | Liquidated | No recovery, the position is closed | 24.6% |
5x | Liquidated | No recovery, the position is closed | 19.6% |
10x | Liquidated | No recovery, the position is closed | 9.5% |

The same 27.6% price fall read as an equity drawdown: applied as one move it puts 3x 82.9% down and 485% from even, while 4x and above are liquidated first.
Two things in that table are worth separating. The first is the multiplication: at 3x the 27.6% fall becomes an 82.9% equity drawdown, and the break-even gain jumps from 38.2% to 485%. The second is the truncation, and it is the more important one. Above 3x the recovery column stops existing, because the position was closed on the way down. The final column shows why: an isolated long at N times leverage is liquidated when the adverse move reaches (1/N minus the maintenance margin rate) divided by (1 minus that rate), so at a 0.5% maintenance rate a 4x long is gone after 24.6% and a 10x long after 9.5%. Map your own numbers in the free Athenum liquidation calculator and the Athenum leverage calculator, which prices the margin and the liquidation distance together.
That column is also where the table stops being a simulation and starts needing a warning label. It applies the whole 27.6% fall as if it were one clean move against a position opened exactly at the high, which is the harshest entry this window contains: no other entry day inside it met a fall deeper than 27.6%, so opening below the top only widens the cushion. Three things push the other way. Liquidation is triggered off the mark price intraday, not off a daily average, and intraday marks ran below these smoothed readings. Maintenance margin is tiered, so a large position faces a higher rate than the 0.5% used here and liquidates earlier. And funding accrues the entire time: at the +0.00665% per 8 hours quoted below, the 56 days from peak to trough cost about 1.12% of notional, which comes straight out of the same margin and pulls the liquidation trigger in by roughly that much.
Put those together and the 3x row is not the comfortable survival it looks like. Its liquidation sits 33.0% away against a 27.6% fall, a cushion of 5.4 percentage points on smoothed daily readings, and funding over the fall alone takes that to roughly 4.2. Intraday wicks or a tiered maintenance rate can spend what is left. The safe reading of the table is directional: entered at the high, 4x and above were closed with certainty, 3x was a coin toss dressed as a survivor, and only the unleveraged position was guaranteed that chance in advance. That is the real reason a bigger multiplier is not simply a bigger bet, laid out in 10x versus 100x leverage.
Did traders actually de-lever while price fell?
In dollars it looks like they did. In coins they did not, and the difference is the reason to check both. Bitcoin futures open interest across Athenum's venue panel, of which Binance, Bybit, Hyperliquid, Bitget, OKX and Deribit are broken out individually and together carry 99.3% of it, was $22.56B on the 2026-05-06 peak day and $16.87B at the 2026-07-01 trough, a 25.2% fall that reads like a broad unwind. Convert the same two readings into coins and the contract base went from 276,709 BTC to 285,928 BTC, a +3.3% change. Almost the entire dollar decline was the price of the contracts, not the number of them.
That figure is Athenum's own venue panel, not an industry total, and the distinction matters before anyone compares it with a headline number elsewhere. Trackers that fold in CME, the smaller offshore venues and every contract type publish a much larger figure for the same day. This one is a like-for-like panel held constant across the whole window, which is what makes the dollar-versus-coin comparison valid; it is not a claim about how much leverage exists in the market as a whole. On 2026-07-27 the panel splits Binance 37.9%, Bybit 20.0% and Hyperliquid 13.3%, with the top three holding 71.1% of it.

Dollar open interest fell 20.4% from the 2026-05-06 high while the coin-denominated base was -0.6%: the decline is price, not positions.
By 2026-07-27 the picture is the same: dollar open interest is -20.4% against the peak day while coin open interest is -0.6%, at 275,138 BTC. Positioning moved too. The long to short ratio was 0.73 on the 2026-05-06 peak day, meaning shorts outnumbered longs, and 1.89 at the 2026-07-01 low, meaning the crowd was leaning long into the worst of the fall, easing to 1.40 on 2026-07-27. A drawdown that leaves the leverage stack intact and the crowd longer than it started is a drawdown that has not cleared out the positioning it created. The unit trap behind that dollar reading is worked through in open interest in coins versus dollars.
What does it cost to hold through a drawdown?
Time is not free on a perpetual. A long that waits out a drawdown pays funding for every settlement it stays open whenever funding is positive, and that cost is charged on notional, so leverage multiplies it exactly the way it multiplies the drawdown. On 2026-07-27 at 08:00 UTC, funding on the 5 Bitcoin perpetuals carrying a live funding print ran from +0.00666% per 8 hours on Bybit down to +0.00093% on Bitget, a spread of 0.00573 percentage points for the same exposure. Deribit is in the open interest panel above but not this one. Its funding reading in this snapshot is +0.02092% per 8 hours against the +0.00882% Deribit itself publishes for the same contract, so it is excluded rather than drawn: a bar that disagrees with the venue's own public figure is worse than a missing bar. Those are also the dollar-quoted contracts; coin-margined books on the same exchanges price a different instrument and can carry the opposite sign, so check the exact contract before treating one venue's number as the market's.

Funding on 2026-07-27 at 08:00 UTC, 8-hour equivalent: Bybit +0.00666% is the dearest venue for a long and Bitget +0.00093% charges one almost nothing.
Those readings are normalized to an 8-hour equivalent on purpose, and the normalization changes the ranking rather than just the units. Hyperliquid settles funding every 1 hour rather than every 8, so its +0.00061% headline is +0.00491% over the same window the 8-hour venues quote in one line. On the raw quote Hyperliquid looks like the cheapest of the 5; on the 8-hour equivalent it is dearer than Bitget. Compare the raw quotes and you rank the settlement schedules; compare the 8-hour equivalents and you rank the actual cost. That failure mode has its own post, funding rate intervals.
Put the two costs side by side. Holding a long through the 82 days since the 2026-05-06 peak at Binance's +0.00665% per 8 hours would have cost about 1.64% of notional in funding alone, which is roughly 4.9% of margin at 3x, on top of an 82.9% equity drawdown. Funding is reset every settlement and swings with positioning, so read that as one rate held constant for illustration rather than a bill anyone actually received. Price a real one at the current rate in the free Athenum funding rate calculator.
How do you size a position so a normal drawdown is survivable?
Work backwards from the drawdown you can actually sit through, not forward from the return you want.
1. Fix the equity drawdown you will tolerate before you look at any chart. Write the number down. For most people it is well under the 55% that 2x turned Bitcoin's last fall into. 2. Look up what the asset has actually done, and look further back than one window. Bitcoin's worst drawdown across the 168 daily readings to 2026-07-27 was 27.6%, which is a recent, ordinary reading. Measured from the publicly reported October 2025 record high near $126,198, Bitcoin is about 48% down today and was about 53% down at the 2026-07-01 low. The low is the number your sizing has to survive, because a position sized for today's 48% was already past its own limit at the worse one. 3. Divide. Your leverage cap is the drawdown you will tolerate divided by the drawdown the asset delivers. Tolerating 40% against this window's 27.6% move caps you near 1.45x; against the 53% fall from the record to the 2026-07-01 low it caps you near 0.75x, which means no leverage at all and only about three quarters of the account in the position. That is before any margin call arithmetic. 4. Check the cap against your liquidation, because the cap only counts if the position survives to use it. The 0.75x cap borrows nothing, so the check does not apply to it at all. The 1.45x cap does borrow, but at the 0.5% maintenance rate on the table above it is liquidated only by a 68.8% adverse move, so your own tolerance binds long before the exchange does. Size past the cap and that flips: 4x is liquidated by roughly a 24.6% adverse move, which is less than the fall Bitcoin just produced. 5. Size the trade from that leverage and your account, then check the recovery number the sizing implies. Run the depth and the required recovery in the free Athenum drawdown calculator, and turn the risk per trade into a position in the Athenum position size calculator.
Two companion posts finish the frame. Sizing by edge rather than by tolerance is the Kelly criterion, and sizing a leveraged trade around the liquidation price itself is the risk and reward ratio.
If you want to run these numbers yourself, Athenum aggregates live derivatives data from 14 exchanges, and its 34 calculators are free to use: no account, no email, no usage limits. Every figure above from inside the measurement window comes off that feed, while the October 2025 record high is an external, publicly reported number rather than ours. The number worth knowing before your next trade is the gain your own worst tolerable loss would demand, and the free Athenum drawdown calculator returns it in one line. When you want the same asymmetry read against a live market instead of a hypothetical, it is waiting in the Athenum terminal.
One terminal. All the data.
Liquidations, orderbook depth, whale walls & open interest from 4 exchanges, all real-time, in one place.
No credit card required

Athenum Analytics
Athenum Analytics is our three-person editorial team covering crypto derivatives, market data and macroeconomic context.