Chart-pattern evidence: from success claims to complete records · 4 / 5
Zero observed failures do not mean zero risk
Twenty selected chart examples without a failure do not establish a failure-proof pattern. First establish how the examples were selected and what counts as failure. Even a carefully collected sample with complete outcomes leaves uncertainty about the underlying probability. A short calculation makes the role of the assumptions visible.
Athenum7 minUpdated:
Declare an explicitly simplified model
Consider n independent trials with the same unknown failure probability p. Every trial must have a fully observed outcome. Failure might mean a predefined stop occurs before a target; choosing another event changes the probability under investigation. Selection, event definition and observation horizon must be fixed before outcomes are known.
Under these assumptions, the chance of one trial without failure is 1 − p. The chance of n independent trials with no failures is (1 − p)^n. This model does not automatically describe real trades. Shared market shocks, duplicate trade examples, changing market conditions and selecting winners afterward can violate its assumptions.
Separate an observed frequency from an upper confidence bound
With no failures, the observed frequency is 0/n = 0. For a one-sided upper 95% confidence bound in this binomial model, set the probability of zero events to 0.05 and solve for p: upper p = 1 − 0.05^(1/n). The upper bound is positive even though the observed frequency is zero.
The 95% refers to the procedure’s coverage over repeated samples under the model assumptions. It does not mean that, after this one sample, a fixed unknown number has a 95% probability of lying below the bound. Nor is the bound a guarantee about later market regimes. The calculation quantifies one part of uncertainty; it does not repair a biased selection rule or an unsuitable model.
Twenty, sixty or three hundred fully observed trials
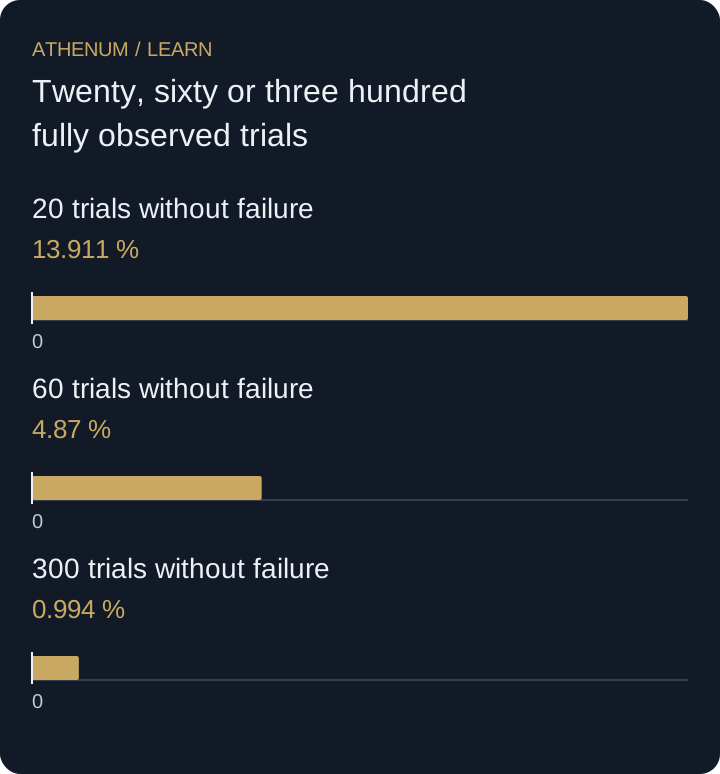
Compare three separate hypothetical samples, each with no failures and each assumed to satisfy the stated model. For n = 20, the formula gives approximately 0.139108, or 13.91%. For n = 60, it gives about 4.87%. At n = 300, the upper bound falls to approximately 0.994%. The zero in the outcome column looks the same in all three cases, but its implications under the model differ.
None of these values is a measured failure probability for a particular flag, coin or Athenum strategy. They are calculations on invented samples. An actual trading journal would also need to demonstrate that all qualifying trials were retained, outcomes were complete and the event definition corresponded to the trading decision being studied.
| Fully observed trials | Observed failures | Upper bound under the model |
|---|---|---|
| 20 | 0 | 13.91% |
| 60 | 0 | 4.87% |
| 300 | 0 | 0.994% |
 Open full-size diagram
- 20 trials without failure: 13.911 %
- 60 trials without failure: 4.87 %
- 300 trials without failure: 0.994 %
More screenshots do not necessarily mean more independent trials
Three pictures of the same winning trade do not provide three independent trade outcomes. Three different coins may also be affected by the same market event. Do not simply use the number of pictures or table rows as n in a binomial calculation. Identify distinct trials and examine dependence. If independence is not defensible, make that limitation explicit and do not present this calculation as a confirmed probability for the actual process.
Before acting
- Define failure and the observation horizon before evaluating outcomes.
- Retain every qualifying trial, including unfavorable results.
- Identify duplicate examples and incomplete outcomes.
- Examine independence and a constant probability as assumptions.
- Report observed frequency, model bounds and forecasts separately.
Check your understanding
A report shows three screenshots for each of twenty winning trades and claims n = 60 independent trials. What count fits the distinct trades, and what remains unchecked?
Show the explained answer
There are at most twenty distinct trades, not sixty. Even those twenty are not automatically independent, completely observed trials collected without outcome selection and with the same failure probability. The data and selection audit must establish whether the simple model is a useful approximation at all.