Chart-pattern evidence: from success claims to complete records
Audit pattern success rates, measured targets, re-entry losses, zero-event samples and unresolved outcomes with original calculations and diagrams.
What you will practise
Evaluate a pattern claim using a defined sample, executable trading rules and a complete accounting of uncertainty.
Before you start
- Understand stops, position size and costs in a linear instrument.
- Complete the introductory risk and strategy-validation lessons.
Course outline
- 1
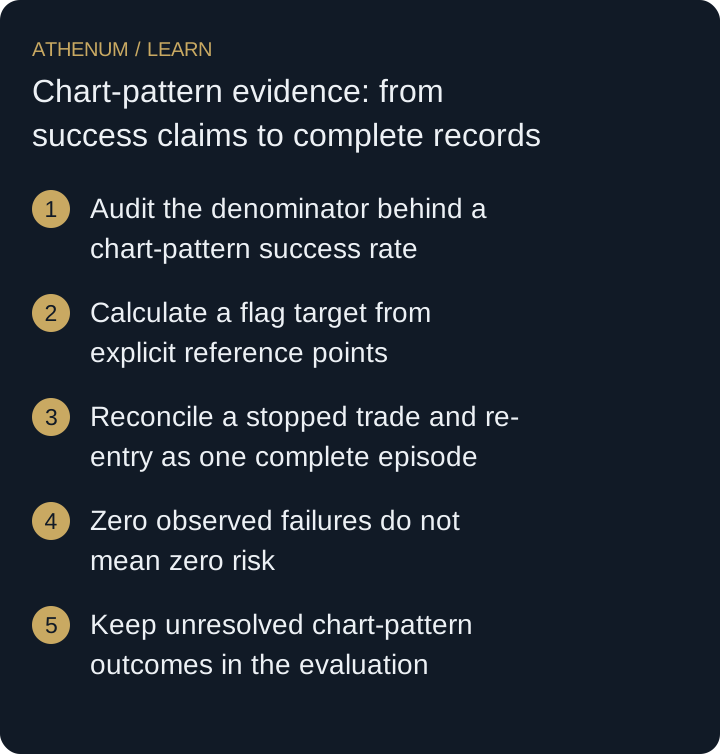
Audit the denominator behind a chart-pattern success rate
Separate pattern candidates, qualified entries, eventual target touches and profitable trades. Reconcile a complete hypothetical event ledger.
7 min - 2
Calculate a flag target from explicit reference points
Separate absolute-price and percentage projections. Check the reference base, executable entry and stop before deriving reward relative to risk.
6 min - 3
Reconcile a stopped trade and re-entry as one complete episode
Include earlier losses, both sides of fees and the remaining risk budget when evaluating a re-entry. A later winner does not erase earlier attempts.
7 min - 4
Zero observed failures do not mean zero risk
Calculate what a sample without failures can establish under a simple model. Separate rare events, sample size and the assumptions behind a confidence bound.
7 min - 5
Keep unresolved chart-pattern outcomes in the evaluation
Separate completed and still-open observations. Calculate transparent outcome bounds without pretending that unknown price paths are wins or losses.
6 min
 Open full-size diagram
- Audit the denominator behind a chart-pattern success rate
- Calculate a flag target from explicit reference points
- Reconcile a stopped trade and re-entry as one complete episode
- Zero observed failures do not mean zero risk
- Keep unresolved chart-pattern outcomes in the evaluation
Educational material. Examples do not establish a profitable strategy. Trading costs, gaps and liquidation can produce losses beyond a planned stop.