Table of Contents9 sections
- What is the publication grid of a funding rate, and why does it have one?
- How coarse is each exchange's grid, in numbers a trader uses?
- How does rounding change comparisons?
- Does the grid explain why exchanges disagree about funding?
- What did the eight venues actually print at the most recent settlement?
- Does Athenum's own cross venue feed see the same spread?
- How does this relate to other published methods?
- How do you measure this yourself?
- What this does not show
The decision before the data
Compare 50 historical BTC funding observations across eight venues. Four lie on a 0.000001 grid; distinguish rounding ties, field definitions and sample limits.
| Your question | What to compare | What this cannot establish |
|---|---|---|
| Round before comparing venues? | Retain exact decimal values; include every tied maximum and minimum. | A rounded tie is not a reversal or an executable arbitrage. |
| Reuse the six-decimal observation? | Check the same contract, field, date and native interval. | Finite sample membership is not a permanent exchange precision rule. |
| Use the longer chart? | Distinguish the new 242-point query from the unrecovered original 230 points. | Hourly indicative rates and settlement-history fields have different meanings. |
Review 2026-10-23: a new historical exchange query reproduces the 50-point comparison. The original long-sample inputs and analysis script could not be recovered; the revised longer chart uses a separately identified 242-point requery. The sample-GCD explanation and treatment of tied extrema are corrected. HTX exposes a computed rate with no realized-rate value. These are observed numeric resolutions, not permanent exchange precision rules or trading returns. Data JSON Reproducible audit HTX API CF Benchmarks BitMEX Q3 2025 Coin Metrics Deribit funding Hyperliquid funding
TLDR. In 50 common nominal eight-hour timestamps from 2026-09-28T00:00Z through 2026-10-14T08:00Z, all Bitget, Gate.io, KuCoin and MEXC readings are exact multiples of 0.000001. A historical requery on 2026-10-23 reproduces that result. Binance and Bybit need up to eight normalized decimal places, OKX sixteen and HTX eighteen in this sample. HTX supplies its computed funding field; its realized field is null. An eight-hour rate step of 0.000001 corresponds to 0.1095 annualized percentage points. Nearest rounding to this grid produces ties at 24 of the 50 timestamps, including eight timestamps already tied before rounding. The set of venues sharing the maximum or minimum changes at four timestamps. These are comparison effects, not demonstrated changes in executable trading decisions. The median cross-venue spread is 10.155 annualized points. A separately labeled longer requery has 242 common timestamps and a median spread of 8.690 points; it does not reconstruct the original 230-point sample.
What is the publication grid of a funding rate, and why does it have one?
A funding API publishes numbers under a particular contract and field definition. Decimal length, numeric resolution, calculated rate and actually charged rate are different properties. The observations below establish which numeric grid fits this sample. They do not reveal every venue's internal rounding algorithm or prove that no documentation exists.
Here, an observed publication grid means a zero-anchored set of multiples containing the sampled rates. Every observed value fitting 0.000001 is compatible with that step, but also with finer possible steps. It does not prove the smallest value a venue can ever express, a permanent exchange-wide rule, or whether the venue rounded rather than truncated.
Keep the original response bytes, parse numeric tokens with decimal arithmetic and test membership in candidate grids. Scientific notation and trailing zeros change the string without changing the value. Compute the greatest common divisor in exact integer units as a sample description. For an underlying zero-anchored grid of exact multiples, this sample divisor can be coarser than the true step; finite membership alone cannot identify the true minimum step.
How coarse is each exchange's grid, in numbers a trader uses?
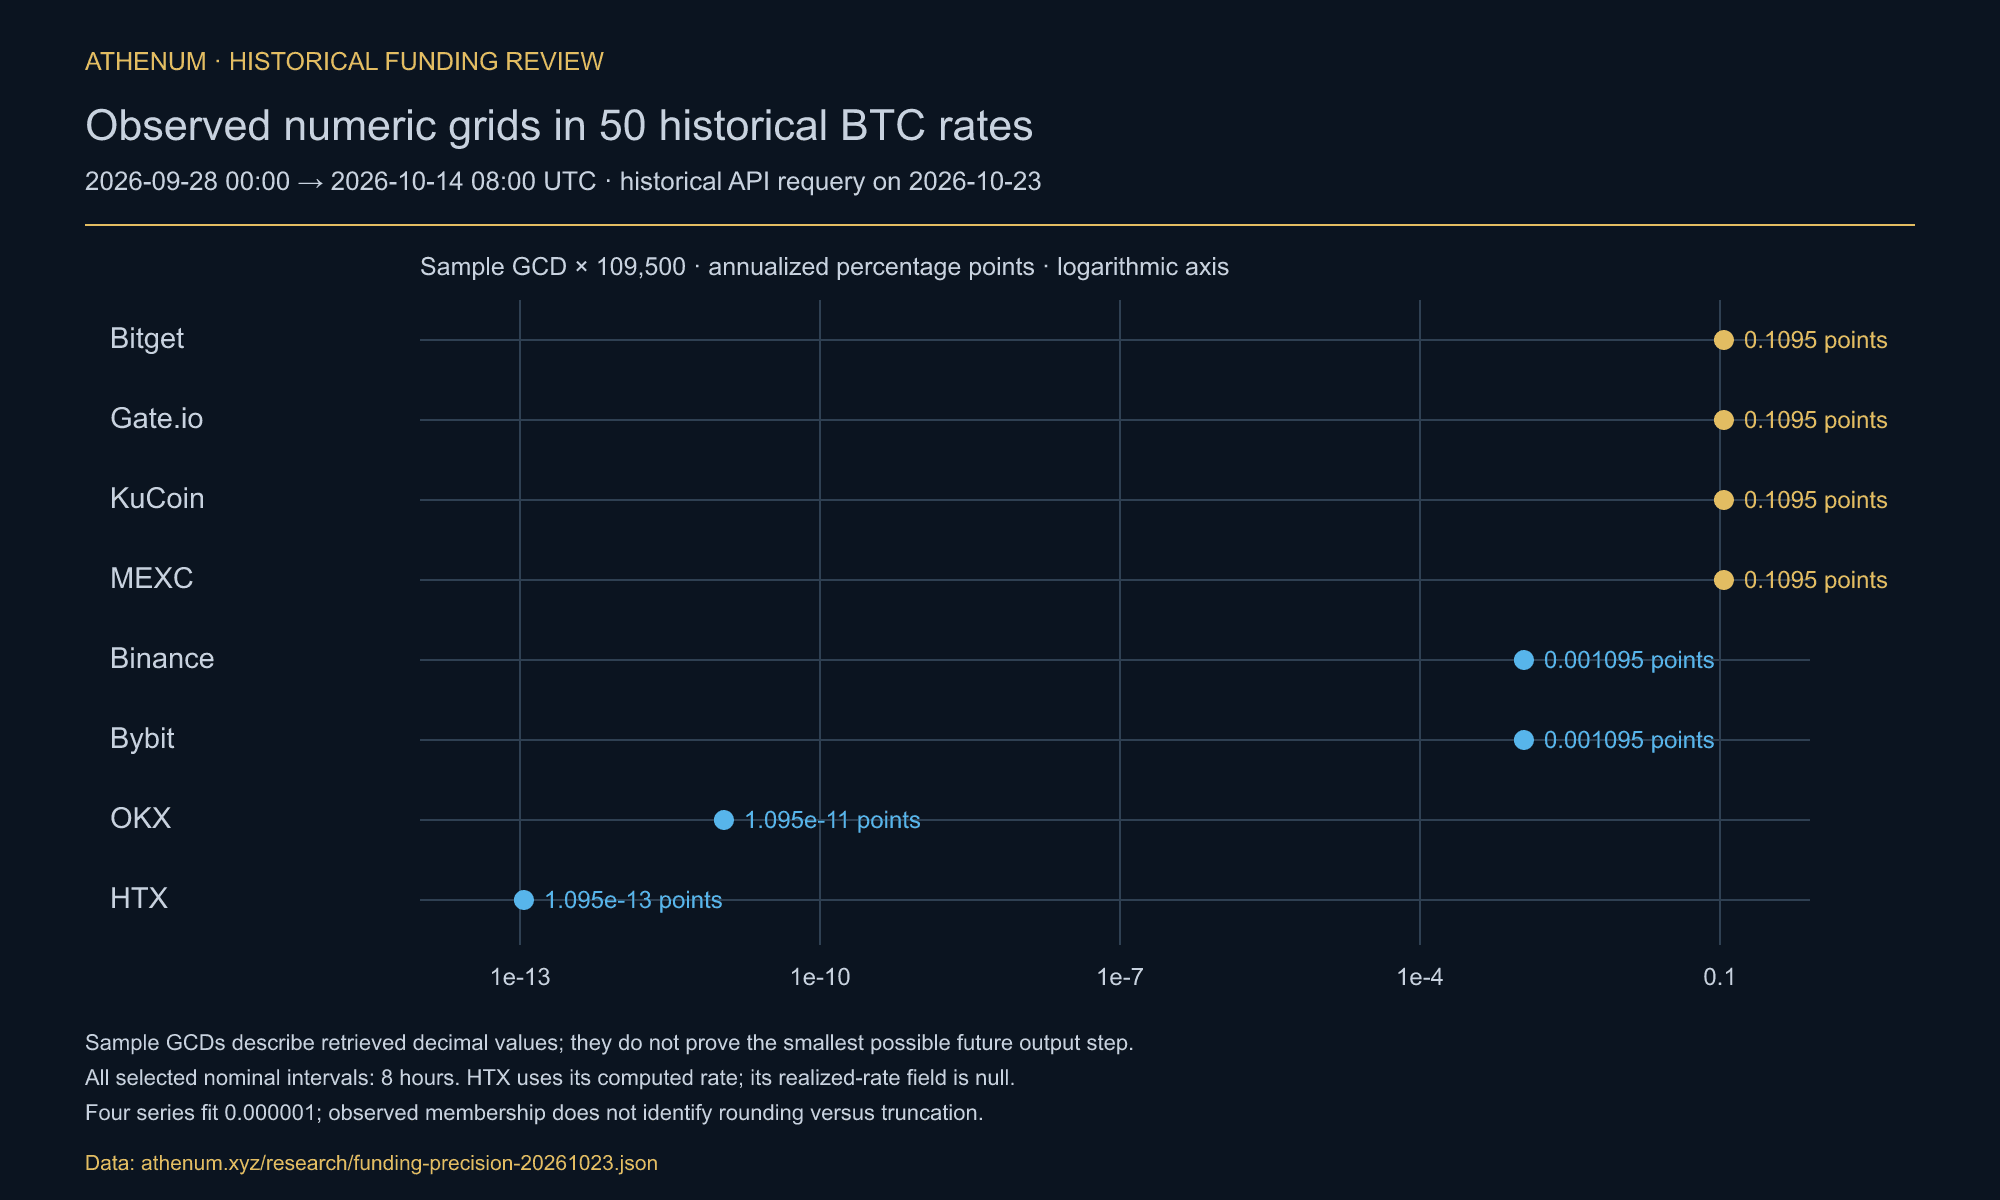
The table describes the same 50 nominal timestamps for all eight contracts. Original timestamps remain in the source: Binance offsets are at most seven milliseconds in this short window. The annualized column multiplies a fractional eight-hour rate by 100 × 3 × 365 = 109,500 to express percentage points. HTX's computed field is included as such, not silently treated as a verified cash-flow rate.
Venue / field | Maximum normalized decimal places | Sample GCD | One sample step, annualized percentage points | On 0.000001 grid / 50 |
|---|---|---|---|---|
Bitget | 6 | 0.000001 | 0.1095 | 50 / 50 |
Gate.io | 6 | 0.000001 | 0.1095 | 50 / 50 |
KuCoin | 6 | 0.000001 | 0.1095 | 50 / 50 |
MEXC | 6 | 0.000001 | 0.1095 | 50 / 50 |
Binance | 8 | 1E-8 | 0.001095 | 1 / 50 |
Bybit | 8 | 1E-8 | 0.001095 | 2 / 50 |
OKX — realizedRate | 16 | 1E-16 | 1.095E-11 | 1 / 50 |
HTX — computed; realized_rate null | 18 | 1E-18 | 1.095E-13 | 4 / 50 |
Within these 50 observations, all four coarse-grid series fit 0.000001. The other series fit it only at the baseline value 0.0001: once at Binance, twice at Bybit, once at OKX and four times at HTX. The original full-history count of 1,520 coarse-venue readings is no longer presented as verified because its original capture and analysis script were not recovered. The public data identify this short sample and the later historical requery separately.
In the short sample, OKX values use at most twelve significant digits and HTX values at most fifteen after removing insignificant zeros. Their maximum normalized decimal-place counts are sixteen and eighteen. This describes the retrieved numbers; it does not establish an internal significant-digit rounding policy.
HTX reports exactly 0.0001 at four of the 50 short-window timestamps. A repeated baseline can reduce the number of distinct values independently of publication resolution. Its realized_rate is null in every retrieved record, so the computed funding_rate is not proof of the amount charged to an account.
The Binance responses preserve eight printed decimal places, whereas Bybit can omit trailing zeros. A token such as 0.00010000 has the same numeric value as 0.0001. In these short-window series both require up to eight normalized decimal places; a 0.00000001 step corresponds to 0.001095 annualized percentage points, one hundredth of the 0.000001 comparison step.
Athenum's free funding rate calculator can illustrate the units: holding a constant 10,000 USDT reference notional at an additional eight-hour rate of 0.000001 for 1,095 settlements would add 10.95 USDT. This is a hypothetical annualization, not observed spending. Nearest rounding changes one annualized observation by at most half a step, 0.05475 percentage points. The RMS value 0.0316 points additionally assumes residuals uniformly distributed within a grid cell; it is not a measured error or a guarantee that errors average away. The historical holding-cost study crosses its assumed fee at settlement 18 in its specific window, not on every typical day.
How does rounding change comparisons?
Round the published decimal values to the nearest multiple of 0.000001, using ties-to-even for exact half steps. Separate an existing tie, a newly created tie and a change in the complete set of highest or lowest venues. Monotone nearest rounding can collapse an ordering into a tie; it cannot reverse a strict ordering into the opposite strict ordering.
The short comparison has ties at eight of 50 timestamps before rounding and 24 afterwards: 16 timestamps become newly tied. The maximum/minimum membership sets change at four of 50 timestamps. Selecting only the first tied venue in the listed order gives one change; changing that arbitrary order can change the count. It is therefore not evidence that rounding flips a trading decision only once. In the separate 242-point requery, ties occur at 78 timestamps before and 170 after rounding; extrema membership changes at 22. Fees, execution, contract terms and later rates still determine whether any trade is viable.
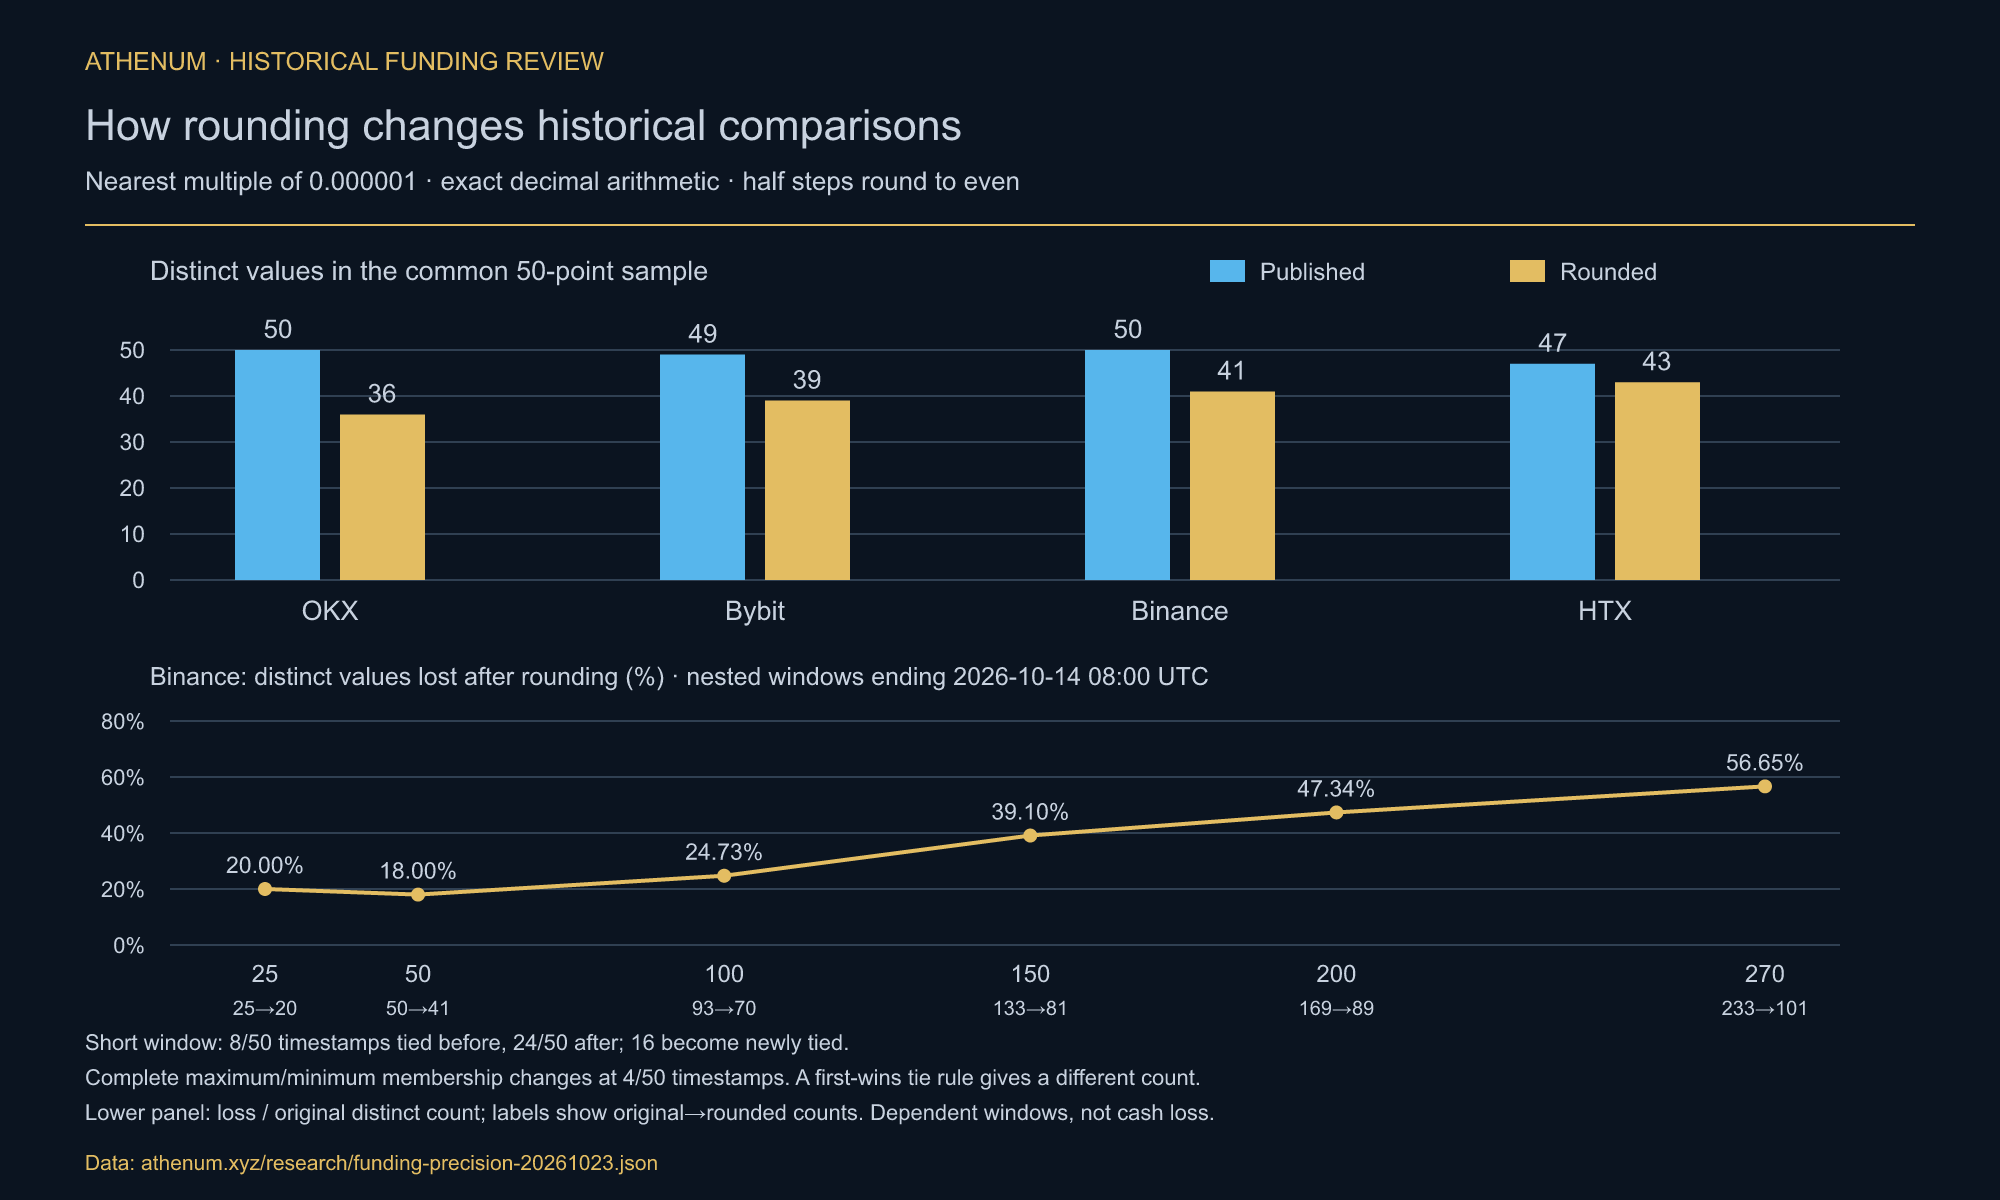
The upper panel counts distinct values in the common 50-point sample. The lower panel uses the most recent 25, 50, 100, 150, 200 and 270 Binance observations ending at 2026-10-14T08:00Z. These nested windows are not independent samples. The metric is the share of originally distinct values that become indistinguishable after rounding.
OKX falls from 50 distinct short-window values to 36, Bybit from 49 to 39, Binance from 50 to 41 and HTX from 47 to 43. For Binance, the loss is 20%, 18%, 24.73%, 39.10%, 47.34% and 56.65% at the six displayed window lengths. These counts are reproduced by the new historical query. The ratio is sample-dependent and need not increase monotonically: it falls between the first two windows. It does not by itself quantify financial loss. The original→rounded distinct-count pairs are 25→20, 50→41, 93→70, 133→81, 169→89 and 233→101, respectively; for example, the 100-observation window loses 23 of its 93 originally distinct values.
The coarse-grid venues have 29 distinct short-window values at Bitget, 38 at Gate.io, 38 at KuCoin and 41 at MEXC. Repeated baseline values contribute to these differences; fewer distinct observations alone do not identify a rounding mechanism.
Bitget reports 0.0001 at 18 of the 50 timestamps; Gate.io at none, Binance/OKX/MEXC once each, Bybit twice, HTX four times and KuCoin six times. Removing this value leaves Bitget with 28 distinct values among 32 observations, or 87.5%; the corresponding ratios are 84.1% for KuCoin, 81.6% for MEXC and 76.0% for Gate.io. A hypothetical formula F = P + clamp(I − P, −0.05%, +0.05%) with I = 0.01% yields the baseline for P between −0.04% and +0.06%. The observed counts do not independently establish each venue's historical clamp inputs or causes.
Does the grid explain why exchanges disagree about funding?
The observed decimal step is much smaller than the usual spread in these samples. This comparison establishes scale; it does not explain the causal source of exchange disagreement.
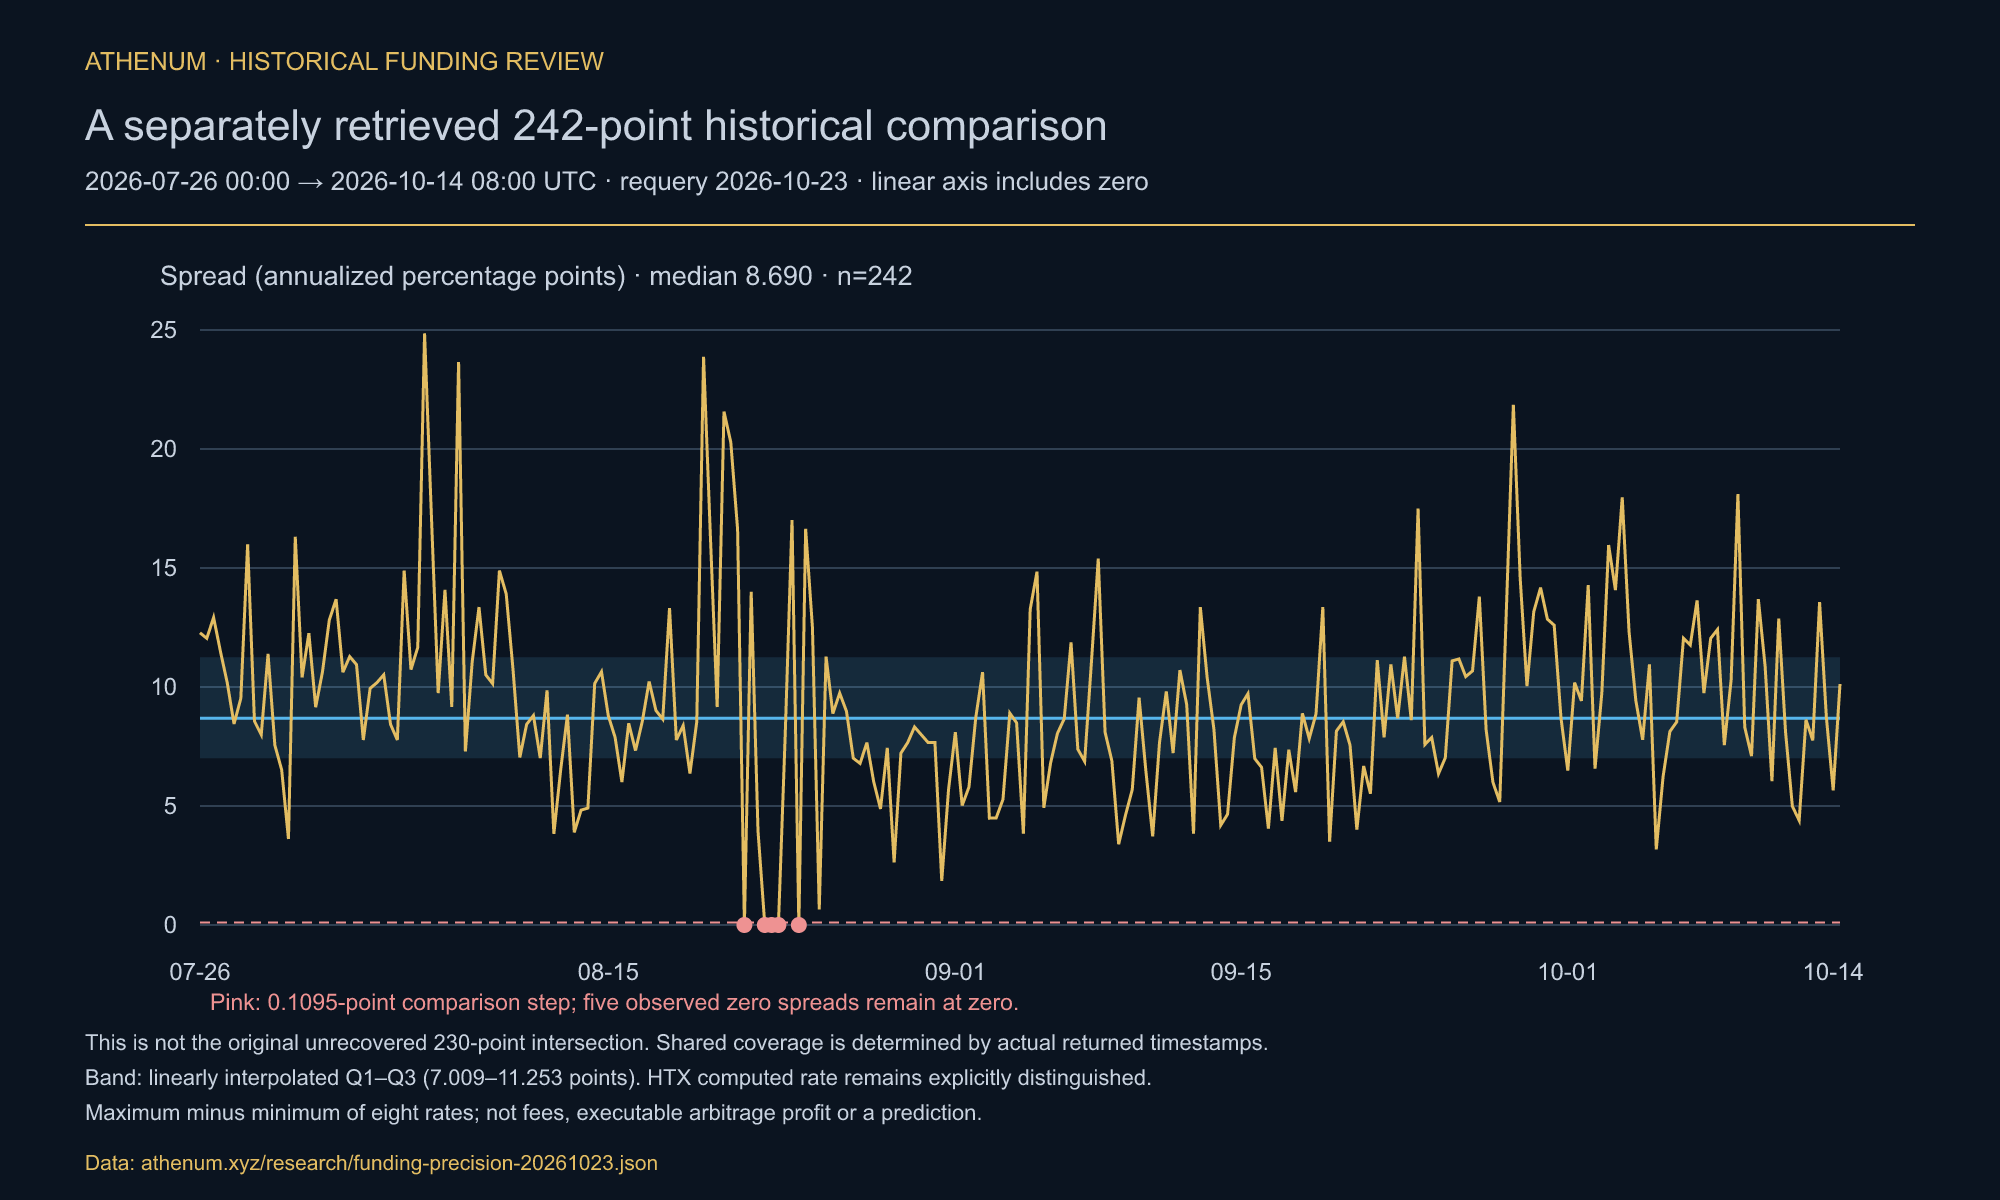
This longer chart uses 242 complete common nominal timestamps from 2026-07-26T00:00Z through 2026-10-14T08:00Z, retrieved on 2026-10-23. It replaces the earlier unrecovered 230-point intersection. The linear axis shows all five zero spreads directly. The 0.1095-point line is a rate-resolution comparison, not an estimated arbitrage profit or realized cost.
For the short 50-point sample, the median maximum-minus-minimum spread is 10.154837… annualized percentage points, or 10.155 rounded. The 0.1095-point grid step is about 1.08% of that median spread. HTX's computed field remains a different evidentiary category from a realized-rate field.
For the later 242-point historical requery, the median spread is 8.689565 points and the linearly interpolated interquartile range is 7.008821 to 11.253141. Five timestamps have all eight rates equal to 0.0001 and therefore zero spread. The requested 270-point range could not be recovered equally: OKX returned 258 relevant points and Bitget 242, while the other venues supplied 270. Missing older observations are not filled with zero. The earlier 230-point results and their reported gaps are not silently reused as this new sample. The requested range was 2026-07-16T16:00Z through 2026-10-14T08:00Z, inclusive: 270 timestamps. The common 242 timestamps span 241 eight-hour gaps, or 80 days and eight hours. Other venues returned earlier July observations, excluded from the common intersection. This reports returned coverage, not a proven fixed 242-record API limit. The new long chart uses interpolated quartiles; the separate hourly chart explicitly retains its original rank convention, so the bands do not use identical estimators.
Including every tie, Bitget belongs to the highest-rate set at 26 of the 50 short timestamps; HTX belongs to the lowest-rate set at 23. The former count of 25 selected one venue from ties and depended on ordering. Removing Bitget gives a median spread of 8.674578 points, removing HTX gives 8.073435, and restricting to the 32 timestamps where Bitget is not at 0.0001 gives 9.233729. These sensitivity checks show the spread remains larger than the grid step; they do not assign a causal share of disagreement to either venue.
There are 1,400 venue pairs across the 50 short timestamps. Sixty gaps are strictly below 0.000001, or 4.29%; including equality gives 62, or 4.43%. Fifteen of those 60 are exact ties already present before rounding. In the separate 242-point requery, 701 of 6,776 pairs are strictly below a step, including 473 exact ties. Pair observations share venues and timestamps and are not statistically independent.
Binance versus MEXC accounts for 39 of the 60 short-window near pairs. Their Pearson correlation is 0.9996536, their median absolute gap 0.56 grid steps and their maximum gap 3.55 steps. This does not prove copying, a common hidden rate or causation by rounding. Excluding that pairing leaves 21 near pairs among 1,350 others, about 1.56%. The profit and loss calculator helps compare price moves and fill-dependent trading fees; funding payments require their own settlement assumptions.
What did the eight venues actually print at the most recent settlement?
The newest common short-window timestamp is 2026-10-14T08:00Z. The rate tokens below are present in the new historical responses, including KuCoin's scientific notation. This confirms the quoted numeric values but does not recreate an independently archived response captured on the original publication date.
Venue | Raw numeric token in the new historical query | Annualized percent |
|---|---|---|
HTX | -0.000029417888209135 | -3.2213 |
MEXC | 0.000014 | 1.5330 |
Binance | 0.00001528 | 1.6732 |
Bitget | 0.000035 | 3.8325 |
Gate.io | 0.000041 | 4.4895 |
Bybit | 0.00004833 | 5.2921 |
KuCoin | 5.3E-5 | 5.8035 |
OKX | 0.0000630585898942 | 6.9049 |
At this timestamp the spread is 10.126174… annualized points. Numeric precision and printed width differ: trailing zeros and scientific notation do not imply a different grid. The annualized figures are comparison units and not a prediction of a year's realized payments.
KuCoin's token 5.3E-5 equals 0.000053. Compare exact decimal values rather than lexicographically sorting strings. Retaining response bytes preserves the original token as evidence while decimal parsing supports numeric comparisons.
Does Athenum's own cross venue feed see the same spread?
The separately queried Athenum history permits another descriptive comparison. It is not an independent measurement of the same settlements: it shares underlying venue feeds and uses different contracts, timestamps and aggregation.
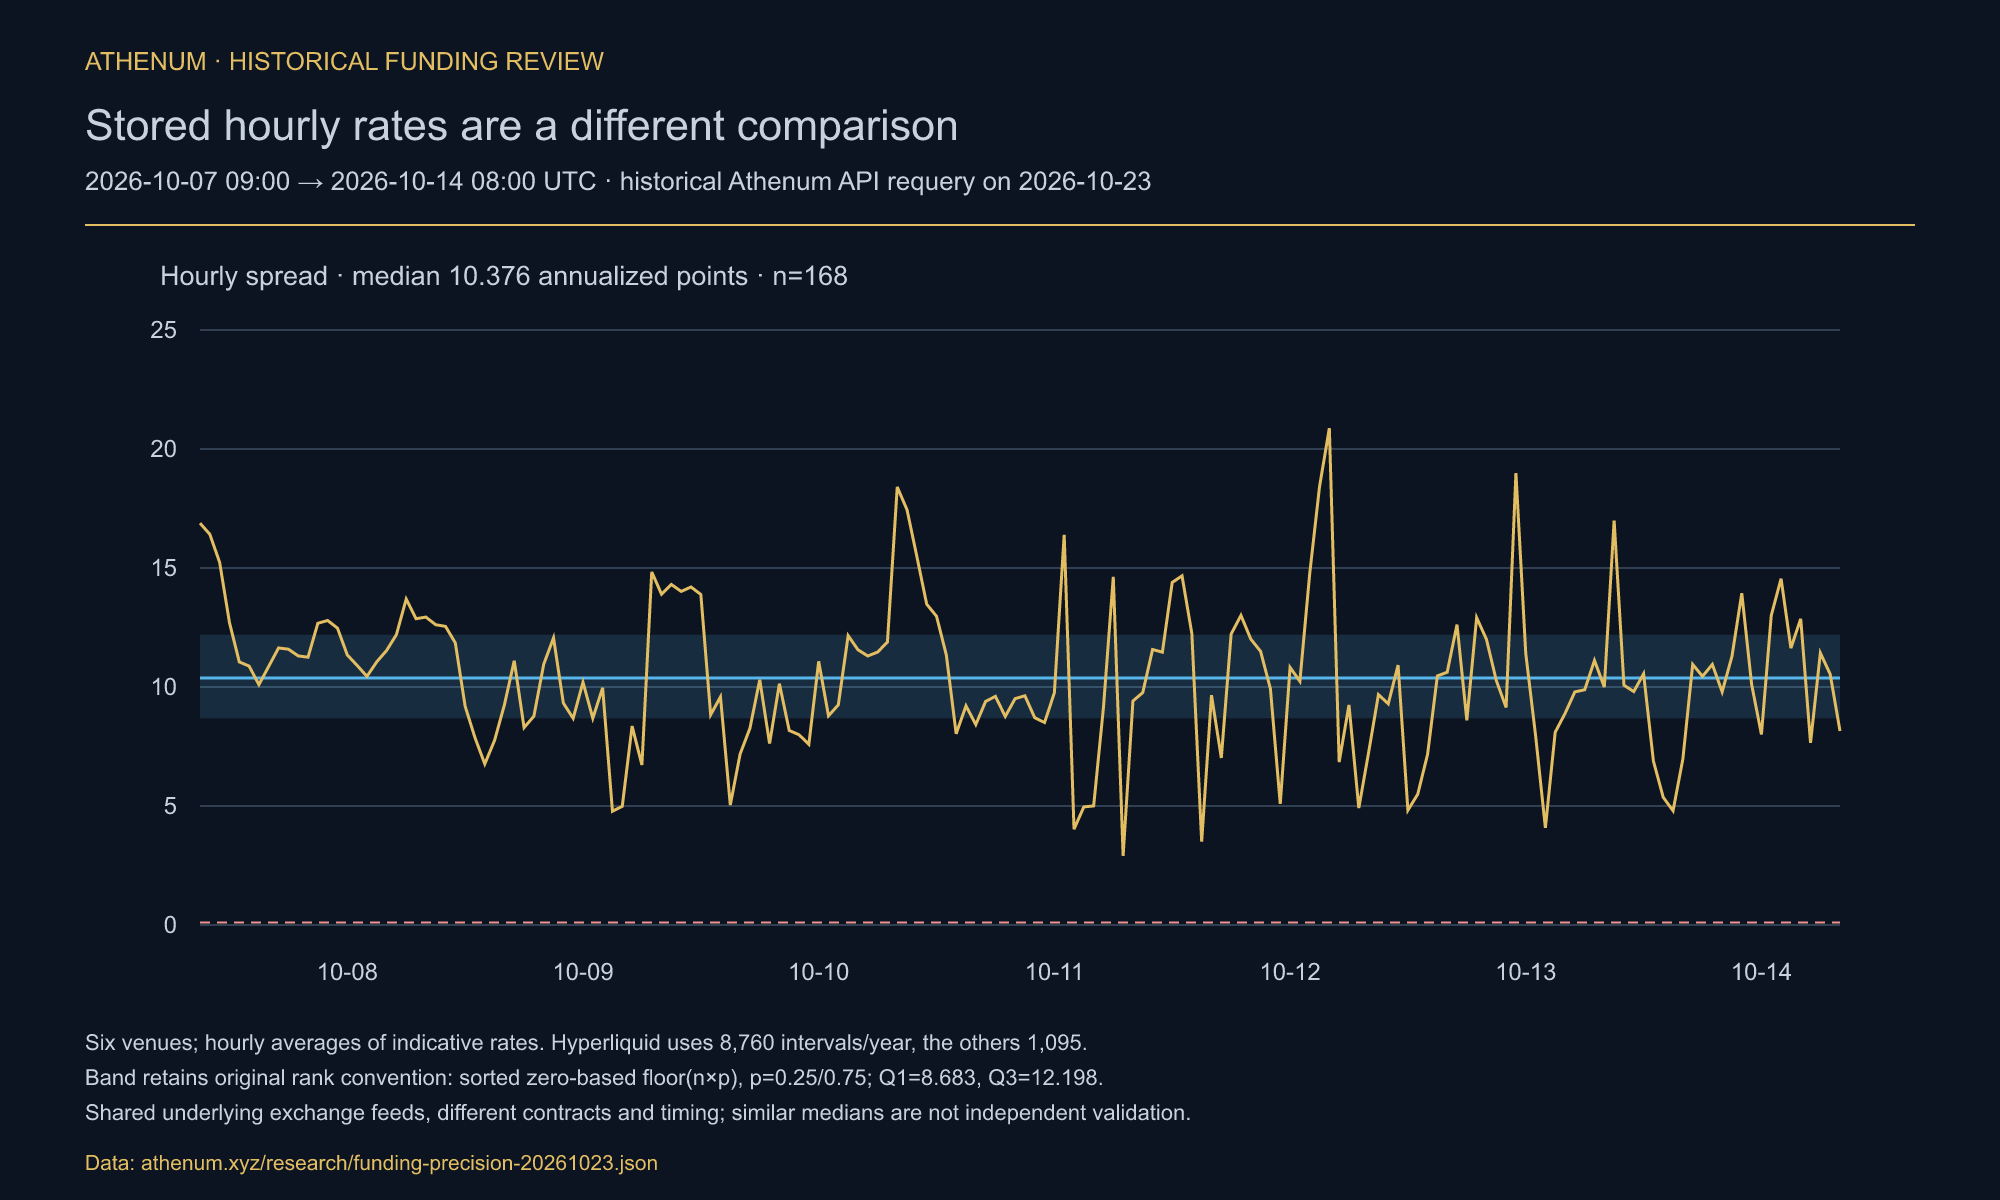
Athenum's 168 stored hourly observations cover 2026-10-07T09:00Z through 2026-10-14T08:00Z. The new query was made on 2026-10-23. This is a six-venue series of hourly averages of indicative native rates, annualized with their corresponding intervals. A similar median does not validate the separate eight-venue settlement comparison.
The hourly spread median is 10.375966 points, with minimum 2.907018 and maximum 20.875450. The original reported quartiles, 8.683407 and 12.198451, reconcile with sorted observations at zero-based indices floor(n × 0.25) and floor(n × 0.75); this rank convention is retained and stated. Linear interpolation would produce different quartiles without making the original arithmetic wrong.
In the completed 2026-10-14T08:00Z hourly bucket, the new historical query gives Binance 2.799%, Bitget 4.005%, Deribit 7.130%, OKX 7.150%, Bybit 10.545% and Hyperliquid 10.950% as annualized indicative rates; the spread is 8.151 percentage points. The original capture reported different final-bucket values and was not recovered, so this is a later stored-hour reconstruction; the cause of the difference remains unverified. Deribit accrues continuously and publishes an eight-hour equivalent; Hyperliquid's native hourly rate uses 8,760 intervals per year. USDT-linear, coin-settled and USDC-margined contracts remain different exposures. See the funding-interval study before normalizing other symbols or dates.
How does this relate to other published methods?
This comparison does not establish that no earlier funding-precision study exists. The following documents answer related but different questions.
CF Benchmarks' February 2025 methodology, version 1.0, specifies six decimals for dissemination of its own perpetual funding index. That is a benchmark output convention, not a census of exchange API steps. BitMEX's Q3 2025 report states that its BTC funding equaled 0.01% at 78.19% of observations; that published statistic concerns baseline frequency, and is attributed to BitMEX rather than independently re-audited here. Coin Metrics documents numeric strings and preservation of source decimal places. None of these facts establishes novelty or a permanent precision rule for the eight venues in this sample.
For reuse, compare instrument, field meaning, native interval, observation time, serialization and numeric resolution separately. A long numeric string is not evidence of economic accuracy, and a coarse-looking string may simply omit trailing zeros.
How do you measure this yourself?
The public data and offline audit record the following procedure.
1. Fetch each named BTC contract's public historical endpoint and check both HTTP and body-level errors. Use OKX realizedRate; disclose HTX's computed funding_rate and null realized_rate.
2. Keep response bytes and hashes; parse numeric tokens with decimal arithmetic, including scientific notation.
3. Preserve original timestamps and map to the nearest eight-hour UTC point only after checking phase and a maximum 3,000 ms offset. In the short window Binance differs by at most 7 ms; the longer query includes Gate records 3,000 ms late.
4. Paginate until the requested boundary or actual exhaustion. KuCoin returns at most 100 records per query here; use the older time cursor. Intersect actual timestamps and report missing coverage.
5. Measure numeric-grid membership, sample GCD and ties explicitly. Nearest ties-to-even rounding is the comparison rule; highest/lowest membership includes every tied venue.
6. Annualize fractional eight-hour rates with 109,500 to percentage points. Use the appropriate native interval for the separate hourly series. The stored data and script reproduce all displayed calculations without private credentials.
For exact observations from a zero-anchored grid, the sample GCD is an integer multiple of the underlying step. It can therefore be coarser, not finer by chance. For example, observed rates 0.000002 and 0.000004 have GCD 0.000002 but remain compatible with an underlying step of 0.000001. A finite sample does not prove the true minimum step; additional observations may reduce the sample GCD. The earlier description of this as a lower bound was incorrect.
What this does not show
This is one named BTC perpetual contract at each venue. No result is automatically extended to other symbols, inverse contracts, future dates or all products on an exchange.
The short window contains 50 nominal timestamps across 16 days and 8 hours. The separately identified longer requery contains 242 shared points. These finite observations establish sample properties, not permanent venue rules or population-wide frequencies. Near-pair counts are dependent and concentrated in particular venue pairs.
No formal exchange precision guarantee is inferred. The review reports the documented fields and the values actually returned for the historical windows. An unlocated policy document is not proof that no such document exists.
Eight-hour alignment applies to these selected contracts and observations. Intervals and caps can change by symbol and date. Recheck actual contract information before annualizing another rate; an exchange name alone is insufficient.
HTX supplies the computed funding_rate, with realized_rate null in every retrieved response. Its numeric resolution can be measured, but its values are not independently verified charged rates. This difference is disclosed in the lead, table and source data as well as here.
Hyperliquid and Deribit are outside the eight-venue grid comparison. They appear only in the separately scoped hourly series, where hourly and continuous funding conventions are made explicit. Their inclusion does not make contracts or account cash flows interchangeable.
Annualization assumes an unchanged rate across a conventional year and involves no compounding. It is a comparison unit, not realized APR/APY, a guaranteed return or a forecast of future funding.
The 0.0001 baseline counts are observations. Establishing each venue's historical interest component, premium window and cap requires separate contract-level documentation and inputs. This precision comparison does not verify a universal 0.375% cap or a permanent clamp across all eight venues.
The reviewed historical queries use public endpoints. Their response hashes, selected records and reproducible calculations are linked above. The funding rate calculator and profit and loss calculator support explicit scenarios; inspect current product terms before using the application. This article makes no guarantee about a future tariff, trial or funding outcome.
One terminal. All the data.
Liquidations, orderbook depth, whale walls & open interest, all real-time, in one place. 29 supported exchanges; coverage differs by tool.
No credit card required

Athenum Analytics
Athenum Analytics is our three-person editorial team covering crypto derivatives, market data and macroeconomic context.