Table of Contents9 sections
- What is the publication grid of a funding rate, and why does it have one?
- How coarse is each exchange's grid, in numbers a trader uses?
- What does rounding actually cost, measured rather than asserted?
- Does the grid explain why exchanges disagree about funding?
- What did the eight venues actually print at the most recent settlement?
- Does Athenum's own cross venue feed see the same spread?
- Has anyone published this census before?
- How do you measure this yourself?
- What this does not show
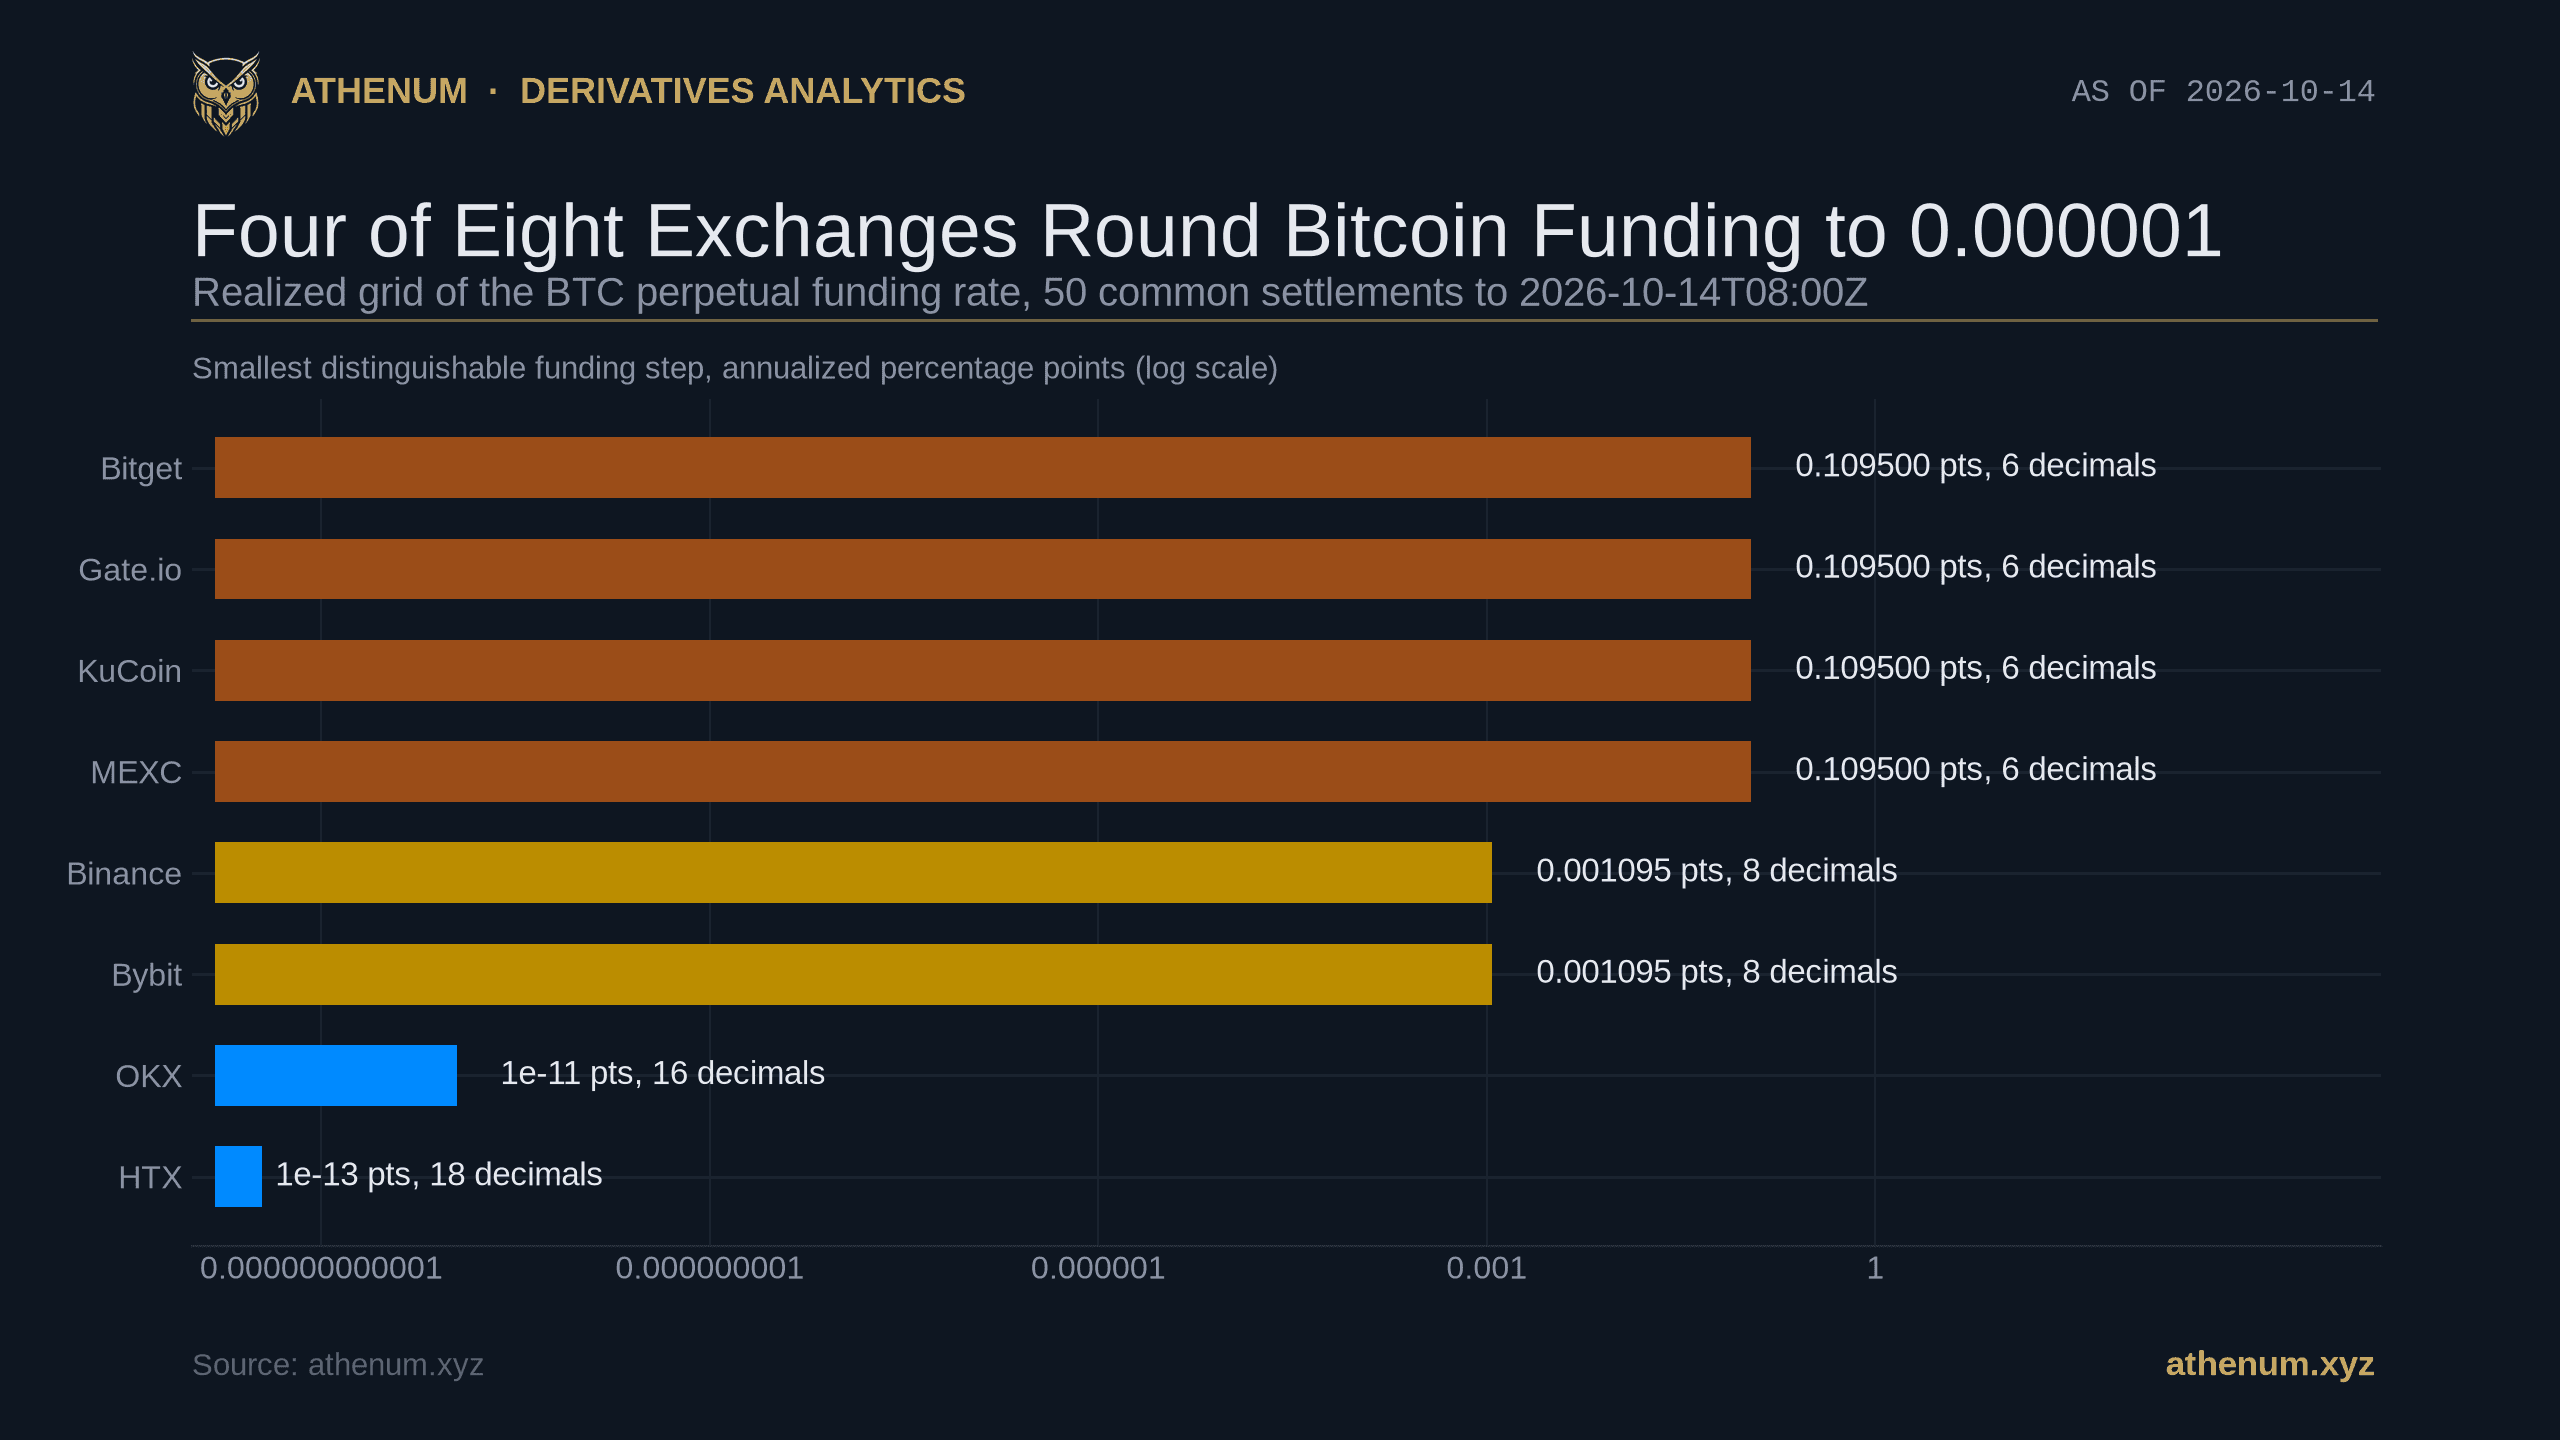
TLDR. Eight exchanges publish the same quantity, the Bitcoin perpetual funding rate, and they do not publish it to the same precision. Measured over the 50 eight hour settlements common to all eight between 2026-09-28T00:00Z and 2026-10-14T08:00Z, Bitget, Gate.io, KuCoin and MEXC put every one of their readings on an exact multiple of 0.000001, and so do all 1,520 readings in those four venues' full retrievable history. Binance and Bybit land on 0.00000001. OKX lands on 0.0000000000000001 and HTX on a grid finer still. One 0.000001 step is 0.1095 annualized percentage points. Rounding all eight onto that grid makes at least two of them print the identical number at 24 of the 50 settlements, and at 153 of the 230 settlements in the longest window the eight share, while it changes which venue is highest or lowest only 1 time in 50 and 9 times in 230. So the grid reliably destroys comparisons and rarely flips a decision. The honest counterweight: the gap between the highest and lowest venue has a median of 10.155 points over those 50 settlements and 9.085 over the 230, so the grid is around 1 percent of the ordinary disagreement. The exception is the regime where the grid is the whole story. At 5 settlements in the 230, all eight venues printed the identical value 0.0001, in four different string forms, and the spread was exactly zero.
What is the publication grid of a funding rate, and why does it have one?
A funding rate is a number an exchange computes and then prints. The computation produces a real number with as many digits as its arithmetic carries. The printing does not: before the rate reaches the API, the venue decides how many decimal places to keep. Not one of the eight exchanges below documents that decision anywhere. They document the funding formula, the settlement interval and the cap, and they are silent on precision, which is why everything here is observed publication granularity rather than a published rule.
Call the result the publication grid: the set of values the venue is actually capable of sending you. If a venue prints six decimals, its grid is every multiple of 0.000001, and any computed rate between two of those multiples arrives as one of them. The grid is not an approximation error you can average away across venues, because it is not random with respect to the venue. It is a fixed property of that venue's output.
Since nobody publishes it, the grid has to be measured. Pull the venue's own funding history, keep the raw text of each rate exactly as the wire carried it rather than the number your JSON parser reconstructs, and ask what share of the readings are exact multiples of each candidate grid. A venue on 0.000001 lands on it every single time; a venue that is not rounding there lands on it only by coincidence. The greatest common divisor of the readings corroborates that, with one caveat worth stating up front: the divisor can only ever come out coarser than the truth, never finer, and a single stray value destroys it, so it belongs beside the membership count rather than in place of it.
How coarse is each exchange's grid, in numbers a trader uses?
Here is the census on the matched window, 50 settlements, the same 50 timestamps at every venue. The annualized column converts one grid step at three eight hour settlements a day across 365 days, the factor of 1,095 that every one of these eight contracts shares.
Venue | Decimals published | Realized grid | One step, annualized | On the 0.000001 grid, window | On the grid, full history |
|---|---|---|---|---|---|
Bitget | 6 | 0.000001 | 0.109500 points | 50 of 50 | 270 of 270 |
Gate.io | 6 | 0.000001 | 0.109500 points | 50 of 50 | 450 of 450 |
KuCoin | 6 | 0.000001 | 0.109500 points | 50 of 50 | 400 of 400 |
MEXC | 6 | 0.000001 | 0.109500 points | 50 of 50 | 400 of 400 |
Binance | 8 | 0.00000001 | 0.001095 points | 1 of 50 | 79 of 1,000 |
Bybit | 8 | 0.00000001 | 0.001095 points | 2 of 50 | 51 of 800 |
OKX | 16 | 0.0000000000000001 | 0.00000000001 points | 1 of 50 | 33 of 279 |
HTX | 18 | finer than 0.0000000000000001 | below 0.000000000001 points | 4 of 50 | 131 of 400 |
The last two columns are the control that makes the first three honest, and the full history column is where the claim actually gets its strength. The four coarse venues land on the 0.000001 grid at every one of the 1,520 readings their endpoints will give up, with no exception anywhere. The fine venues do land on the coarse grid sometimes, and the reason is not coincidence, which is the part that would be easy to report wrongly. Over their full histories Binance lands on it 79 times in 1,000, Bybit 51 in 800, OKX 33 in 279 and HTX 131 in 400, and almost all of those are a single value: 72, 47, 33 and 131 of them respectively are exactly 0.0001, the funding formula's interest rate baseline. Set that one value aside and the residue is 7 readings at Binance, 4 at Bybit and none at all at OKX or HTX. In the matched 50 settlements the residue is zero at all four. So the fine venues effectively never land on the coarse grid except where the formula itself pins them there.
OKX and HTX cut by significant figures rather than decimal places, which is worth knowing before anyone quotes the 16 decimals as a venue property. Across the matched window OKX never uses more than 12 significant digits and HTX never more than 15; the decimal counts in the table are what that becomes for rates sitting near 0.00001, not a fixed number of places.
HTX's 131 deserves saying out loud. 131 of its 400 readings, 32.8 percent, are the identical constant 0.000100000000000000. That is the funding formula's interest rate baseline, discussed below, printed to eighteen decimals. HTX writes eighteen decimals on all 400 of its readings whether they need them or not, and a third of the time what it is spelling out that precisely is one repeated number.
The two 8 decimal venues are worth a separate note, because one of them looks more precise than it is and the other looks less. Binance pads: all 1,000 of its readings are written to exactly eight decimal places, so a rate of 0.0001 arrives as 0.00010000. Bybit does not pad, and its written widths run 4, 7 and 8 decimals depending on the value. The padding is cosmetic either way. The grid underneath both is real, and at 0.001095 annualized points it is a hundred times finer than the coarse group's.
A useful reference point for the size of 0.1095 points: Athenum's free funding rate calculator turns an eight hour rate into the annualized cost of carrying a position, and 0.1095 points is roughly what a 10,000 dollar position pays in eleven dollars a year. The worst a single rounding can do is half a step, 0.05475 points, and across many settlements the root mean square error of a uniform grid is the step over the square root of twelve, 0.0316 points. Set against the thing that actually dominates the carry, it is nothing: funding only overtakes the round trip fee at the eighteenth settlement on a typical day. That is small. It is not zero, and the question is where it stops being small.
What does rounding actually cost, measured rather than asserted?
The cleanest way to price the grid is to impose it: take the readings as published, round them onto the 0.000001 grid, and ask what changed. Two things can change, and they are worth separating, because one happens constantly and the other almost never.
The first is that two venues stop being distinguishable. Rounding all eight onto the coarse grid makes at least two of them print the identical number at 24 of the 50 settlements in the matched window, 48 percent of them, and at 153 of the 230 settlements in the longest window the eight share, 66.5 percent. The second is that the rounding changes which venue is the highest or the lowest. That happens at 1 of the 50 and at 9 of the 230, 3.9 percent. Taken together: the grid destroys comparisons routinely and flips a decision rarely. If your question is which venue pays the most, the coarse grid will almost always still answer it. If your question is by how much, or whether two venues differ at all, it frequently will not.

The upper panel is the usual way this gets reported and the lower panel is why it should not be reported alone. Binance loses 18 percent of its distinguishable readings to the grid over 50 settlements and 57 percent over 270, because collisions accumulate with sample size. A single percentage here is a statement about the window, not about the exchange.
Counting distinguishable values is the other way to see it, and it comes with a trap that is easy to publish and hard to notice. Over the matched 50 settlements, OKX falls from 50 distinct values to 36, Bybit from 49 to 39, Binance from 50 to 41 and HTX from 47 to 43. Those read like venue properties. They are not. Run the same count on Binance over its own history and the loss goes 20 percent at 25 settlements, 18 at 50, 25 at 100, 39 at 150, 47 at 200 and 57 at 270. It is a collision statistic: the more readings you pour onto a fixed grid, the more of them share a cell, so the number rises towards one hundred percent with window length and says nothing about the exchange on its own. The ranking between venues moves with the window too. The scale free statements are the half step and the root mean square above; everything else here is quoted with its sample size attached.
The coarse venues do read fewer distinct values natively over the same 50: Bitget 29, Gate.io 38, KuCoin 38, MEXC 41. It is tempting to call that the grid showing up in the wild. For three of them that holds. For Bitget it does not, and the reason is a different mechanism entirely.
Bitget printed exactly 0.0001 on 18 of the 50 settlements. Gate.io printed it zero times, Binance, OKX and MEXC once each, Bybit twice, HTX four times, KuCoin six. That value is not a rounding artefact: 0.0001 per eight hours is the interest rate component that the standard funding formula falls back to whenever the gap between that rate and the premium index stays inside the venue's clamp, which on the common 0.05 percent clamp means a premium anywhere between minus 0.04 and plus 0.06 percent, and it is worth 10.95 points annualized. Strip those 18 readings out and Bitget's remaining 32 settlements hold 28 distinct values. Measured that way Bitget is the least collapsed of the four coarse venues, not the most: 87.5 percent of its non baseline readings are distinct, against 84.1 at KuCoin, 81.6 at MEXC and 76.0 at Gate.io. Bitget's low headline number is a clamp story, not a decimals story, and reporting it as evidence for the grid would have been exactly backwards.
Does the grid explain why exchanges disagree about funding?
Almost never, and the exception is the interesting part. This is the control the headline needs.

The red line is the entire subject of this post, drawn to scale against the thing it is often blamed for. Across 230 settlements the spread has a median of 9.08 points and an interquartile band of 7.33 to 12.28, two orders of magnitude above the grid. The five triangles on the floor are the counter-case, and a shorter window would not have contained them.
At each of the 50 matched settlements, take the highest and the lowest of the eight annualized readings. The median gap is 10.155 points, the middle half of the settlements fall between 8.103 and 13.165 by the Hazen quantile convention, the smallest gap is 3.176 and the largest is 21.857. Not one of those 50 came in under 1 point, and one grid step is 0.1095 points, 1.08 percent of the median gap.
That window is too short to be the whole answer, so here is the longest one the eight venues share, 230 settlements running back to the middle of July, bounded by the shortest funding history any of them will return. It is not contiguous: two stretches of 20 settlements each, in late July and in early September, are missing from at least one venue and so from the intersection, which is why the chart carries two long flat segments that are the line crossing a gap rather than data. The median gap there is 9.085 points, the interquartile band 7.331 to 12.277, the largest 41.319. And the smallest is zero. At 6 of the 230 settlements the eight venues were less than 1 point apart, and at 5 of those the spread was exactly zero because every one of the eight printed the identical value 0.0001, the interest rate baseline, at the same instant. They did not print the identical string: the same number arrived as 0.0001, as 0.00010000, as 0.000100000000000000 and as 1.0E-4, which is the census in miniature. That is the regime where the grid is not a rounding detail but the entire resolution of the measurement, and a post that stopped at the 50 settlement window would have told you it never happens.
Half of the disagreement also comes from two venues. Over the 50 matched settlements Bitget supplies the highest reading 25 times and HTX the lowest 23 times. The headline survives dropping either: without Bitget the median spread is 8.67 points, without HTX 8.07, and over the 32 settlements where Bitget was not printing its baseline it is 9.23. All three are still 74 grid steps or more. Away from the zero spread regime, venues disagree about funding because they are different markets with different participants, different index baskets, different clamps and different premium windows. They do not disagree because four of them cut the number at six decimals. Anyone selling you the rounding as the explanation for a 9 point spread has the magnitude wrong by two orders of magnitude.
Between the two regimes sit the fine comparisons, and those are not rare. Counting strictly, pairs whose published rates differ by less than one full 0.000001 step, 60 of the 1,400 venue pairings in the matched window qualify, 4.29 percent, and 663 of the 6,440 in the 230 settlement window, 10.30 percent. The strictness matters: exactly 2 pairs in the short window differ by precisely one step, so an inclusive count reads 4.43 percent instead.
Those 60 are not spread across the board, and the concentration is the most interesting thing in the dataset. 39 of them are a single pairing, Binance against MEXC. The next largest is HTX against KuCoin at 3. Over the 50 settlements MEXC's published funding correlates with Binance's at 0.9997, with a median absolute gap of 0.56 of one grid step and a maximum of 3.55. Whatever MEXC is doing, it tracks Binance closely enough that for most of the window the two are the same number, and MEXC's six decimal grid is precisely the thing that stops anyone demonstrating it from the published feed. Strip that one pairing out and the other 1,350 pairings yield 21 near instances, about 1.6 percent, and 15 of the original 60 are exact ties where the ordering is undefined whatever the grid. So the fine comparisons are not common in general. They are common between two specific venues, and there the grid is the binding constraint on what can be shown. The same limit applies to any statistic that differences two venues, to any backtest that claims basis point precision on a carry trade, and to any chart that plots a coarse venue and a fine one on the same axis and asks a reader to compare slopes. If you want the rest of the cost beside it, the free profit and loss calculator sizes the entry, the exit and the fees on the same position, which is the scale against which eleven dollars a year should be read.
What did the eight venues actually print at the most recent settlement?
The window's newest common settlement is 2026-10-14T08:00Z. These are the raw tokens off the wire, unaltered, sorted from the lowest annualized reading to the highest.
Venue | Raw rate as published | Annualized |
|---|---|---|
HTX | -0.000029417888209135 | -3.2213 points |
MEXC | 0.000014 | +1.5330 points |
Binance | 0.00001528 | +1.6732 points |
Bitget | 0.000035 | +3.8325 points |
Gate.io | 0.000041 | +4.4895 points |
Bybit | 0.00004833 | +5.2921 points |
KuCoin | 5.3E-5 | +5.8035 points |
OKX | 0.0000630585898942 | +6.9049 points |
Read the raw column rather than the annualized one and the census is visible without any statistics at all: three venues print six decimals, two print eight, one prints sixteen, one prints eighteen, and one answers in scientific notation. The spread at this settlement is 10.1262 points, close to the median of the matched window and a point above the median of the long one.
The KuCoin row carries a second, smaller lesson. Its API sends 5.3E-5 rather than 0.000053, which is the same number and a different string, and a parser that reads rates as text will mis-sort it or drop it. It is on the 0.000001 grid either way; its exponent form is a serialization choice, not a precision one.
Does Athenum's own cross venue feed see the same spread?
It does, measured independently and on a different clock.

A second, independent read of the same disagreement. This is Athenum's normalized feed rather than eight separate venue endpoints, reading Binance, Bybit, OKX, Bitget, Hyperliquid and Deribit hourly rather than per settlement. The median spread lands at 10.38 points against the 10.155 the venue endpoints gave, which is the kind of agreement that makes both numbers worth trusting.
Athenum's feed carries Binance, Bybit, OKX, Bitget, Hyperliquid and Deribit on one hourly clock. Over the 168 hours to 2026-10-14T08:00Z, the spread between the highest and lowest of those six has a median of 10.376 annualized points, an interquartile band of 8.683 to 12.198, a minimum of 2.907 and a maximum of 20.875. That is a different venue set, a different sampling frequency and a different pipeline from the one behind the table above, and it lands within a quarter of a point of the same median.
At the 2026-10-14T08:00Z bar the six read Binance +2.671, Bitget +3.996, OKX +7.046, Deribit +7.585, Bybit +10.587 and Hyperliquid +10.950 annualized points, a spread of 8.279. Three cautions on that row, all of which the numbers would hide. Deribit does not settle funding discretely at all: it accrues continuously and publishes an eight hour equivalent, which is what is annualized here, so it is in this chart on a different footing from the rest. The six also mix contract types, with Deribit's perpetual settled in coin and Hyperliquid's margined in USDC against USDT linear contracts elsewhere. And Hyperliquid settles hourly rather than every eight hours, so its rate is annualized at 8,760 rather than 1,095; treating every venue's rate as an eight hour rate is a far larger error than any rounding discussed here, and it is the subject of our earlier post on funding intervals. And Hyperliquid's +10.950 is the same 0.0000125 per hour baseline that appears over and over in its series, the hourly cousin of the 0.0001 clamp above, not an independent reading.
Has anyone published this census before?
Not this one, and the near misses are worth naming so nobody has to wonder.
CF Benchmarks' *CF Perpetual Funding Rate Index* methodology specifies a dissemination precision of 6 decimals for its own funding index. That is a benchmark administrator choosing its output precision, which is the same idea pointed the other way, and it is not a measurement of what venues publish. BitMEX's third quarter 2025 derivatives report, "The Anchor and the Ceiling", measures how often funding prints exactly 0.01 percent per eight hours, 78.19 percent of that quarter on its own Bitcoin contract, comparing itself against Binance and Hyperliquid. That is the clamp and the interest anchor, not a publication grid, and it covers three venues rather than eight; it is the closest published work to this one and it measures something different, so the distinction is worth making loudly. Coin Metrics documents that it returns funding rates as JSON strings specifically to preserve precision, which is a transport guarantee rather than a census, and is the only vendor acknowledgement we found that the digits are load bearing at all. The methodological ancestor is the price clustering and tick discreteness literature, which has measured the same effect on quoted prices for decades and, as far as we can tell, never on funding.
Searches of the usual trading libraries and data vendors turned up nothing: no per venue funding precision table at any of them.
How do you measure this yourself?
Six steps, no key required at any of them.
1. Pull each venue's public funding history endpoint for the BTC perpetual. All eight used here answer an anonymous GET. Ask for the realized rate and not the predicted one where a venue offers both: OKX's history carries a predicted field and a realized field side by side, and only the second is what was charged. 2. Keep the rate as the raw text from the response body. Parsing it into a float first destroys exactly the thing you are measuring, because a float has no memory of how many decimals arrived. 3. Bucket each row's timestamp to the nearest eight hour boundary before comparing venues. Settlement stamps differ by milliseconds between venues and one of them reports seconds rather than milliseconds, so an exact timestamp join silently drops most of the sample. Nearest boundary bucketing has its own trap: a venue settling on a different phase is folded into the wrong bucket rather than dropped, which pairs readings that were never contemporaneous, and a four hour offset lands exactly on a bucket boundary where the rounding is a coin flip. Check the phase rather than assuming it. KuCoin is the case to check: its own help page still documents 04:00, 12:00 and 20:00 UTC, while its live endpoint returned 00:00, 08:00 and 16:00 on every reading used here. 4. Intersect the timestamp sets so every venue is scored on the same settlements. An unmatched window compares a calm week at one venue with a volatile one at another. 5. Take the greatest common divisor of the absolute rates in integer units. Use a decimal type, not a float: binary floating point cannot represent 0.000001 exactly and will report a grid finer than the truth. 6. Convert to annualized points by multiplying by the number of settlements per year at that venue, which is 1,095 for all eight here and 8,760 for an hourly venue.
The divisor is a lower bound, not a certainty. With 50 readings, a venue that genuinely rounds to 0.000001 will show that divisor; a venue that rounds to something coarser could in principle show a finer one by chance, and the fix is more readings rather than a better statistic. The four coarse venues are secure here because the claim is also checked directly: every one of their 50 readings is an exact multiple, which a single off grid value would have ended.
What this does not show
It is one contract on one asset. BTC against USDT is the most heavily quoted perpetual at all eight venues, and a venue is free to use a different precision on a thinner contract or an inverse one. Nothing here was tested on a second symbol.
The matched window is 50 settlements, 16 days and 8 hours, and the long one is 230 settlements spread across about 90 days, with two gaps of 20 settlements in it. That is enough to establish a grid, which is a structural property, and not enough to characterize how often the fine comparisons bind. The 4.29 percent is a reading from this window and not a constant, and as the section above shows it is also dominated by one venue pairing rather than spread evenly.
None of the eight grids was read from documentation, because none of the eight publishes one. The census is inferred from published values, so it describes what each venue did over the settlements measured rather than what it has promised to do, and a venue can change its serialization without telling anybody.
The eight hour interval is a current state, not a guarantee. Binance, OKX, Gate and KuCoin all document that they may shorten the funding interval, to four, two or one hour, when the rate reaches the cap, and Gate says it will do so without prior announcement. Several of the eight publish intervals per symbol rather than per venue, and none declares the interval fixed. Every settlement in both windows here was eight hourly, which is why the factor of 1,095 is correct for all of them, and a stretch at a shorter interval would break that conversion.
HTX's number is the computed rate, not provably the charged one. Its history endpoint returns a null realized rate on all 400 rows and exposes only the computed field, and its own documentation says the two can differ when the charge would liquidate the position. Its eighteen decimals are real, and what they are eighteen decimals of is a slightly different quantity from the other seven.
Hyperliquid and Deribit are absent from the eight because their funding intervals differ, hourly and continuous rather than eight hourly, and mixing intervals into one grid comparison would have been the larger error. Both publish finely, at ten decimals and more, so excluding them makes the coarse group look no worse than it is.
The annualization is a convention, not a forecast. Multiplying an eight hour rate by 1,095 states what a year at that rate would cost, and funding does not stay at one rate for a year. It is used here only to put the grids and the spreads on one comparable axis.
The clamp reading is partial. 0.0001 per eight hours is the interest rate component, stated in that form by Binance, OKX, KuCoin and, hedged as typically, by Bitget, while Gate publishes it as 0.03 percent a day and MEXC's funding article assigns the component no value at all, and the count of exact 0.0001 prints above is a count, not a test of each venue's clamp rule. The caps themselves are mostly published as a formula rather than a number, three quarters of the maintenance margin ratio at several venues, and where a number is published for Bitcoin it is 0.375 percent per settlement. Separating premium window from clamp width properly is a different measurement.
Nothing above needed a key. The census came off eight exchanges' own public endpoints in a single pass on 2026-10-14, and the raw tokens are quoted in full precisely so the arithmetic can be redone by hand. The hourly six venue series is ours: Athenum reads Binance, Bybit, OKX, Bitget, Hyperliquid and Deribit onto one clock, which is what made the second, independent estimate of the spread possible at all. Alongside that terminal sit 37 free tools, 35 of them calculators, and they are free in the literal sense: nothing to sign, nothing to confirm, no counter running against you. Seeing the normalized cross venue view itself takes a 7 day Pro+ trial, which is also free, needs no card, and lapses on its own at app.athenum.xyz.
One terminal. All the data.
Liquidations, orderbook depth, whale walls & open interest from 4 exchanges, all real-time, in one place.
No credit card required

Athenum Analytics
Athenum Analytics is our three-person editorial team covering crypto derivatives, market data and macroeconomic context.