Table of Contents8 sections
- What is the convexity condition, and why can no real option board break it?
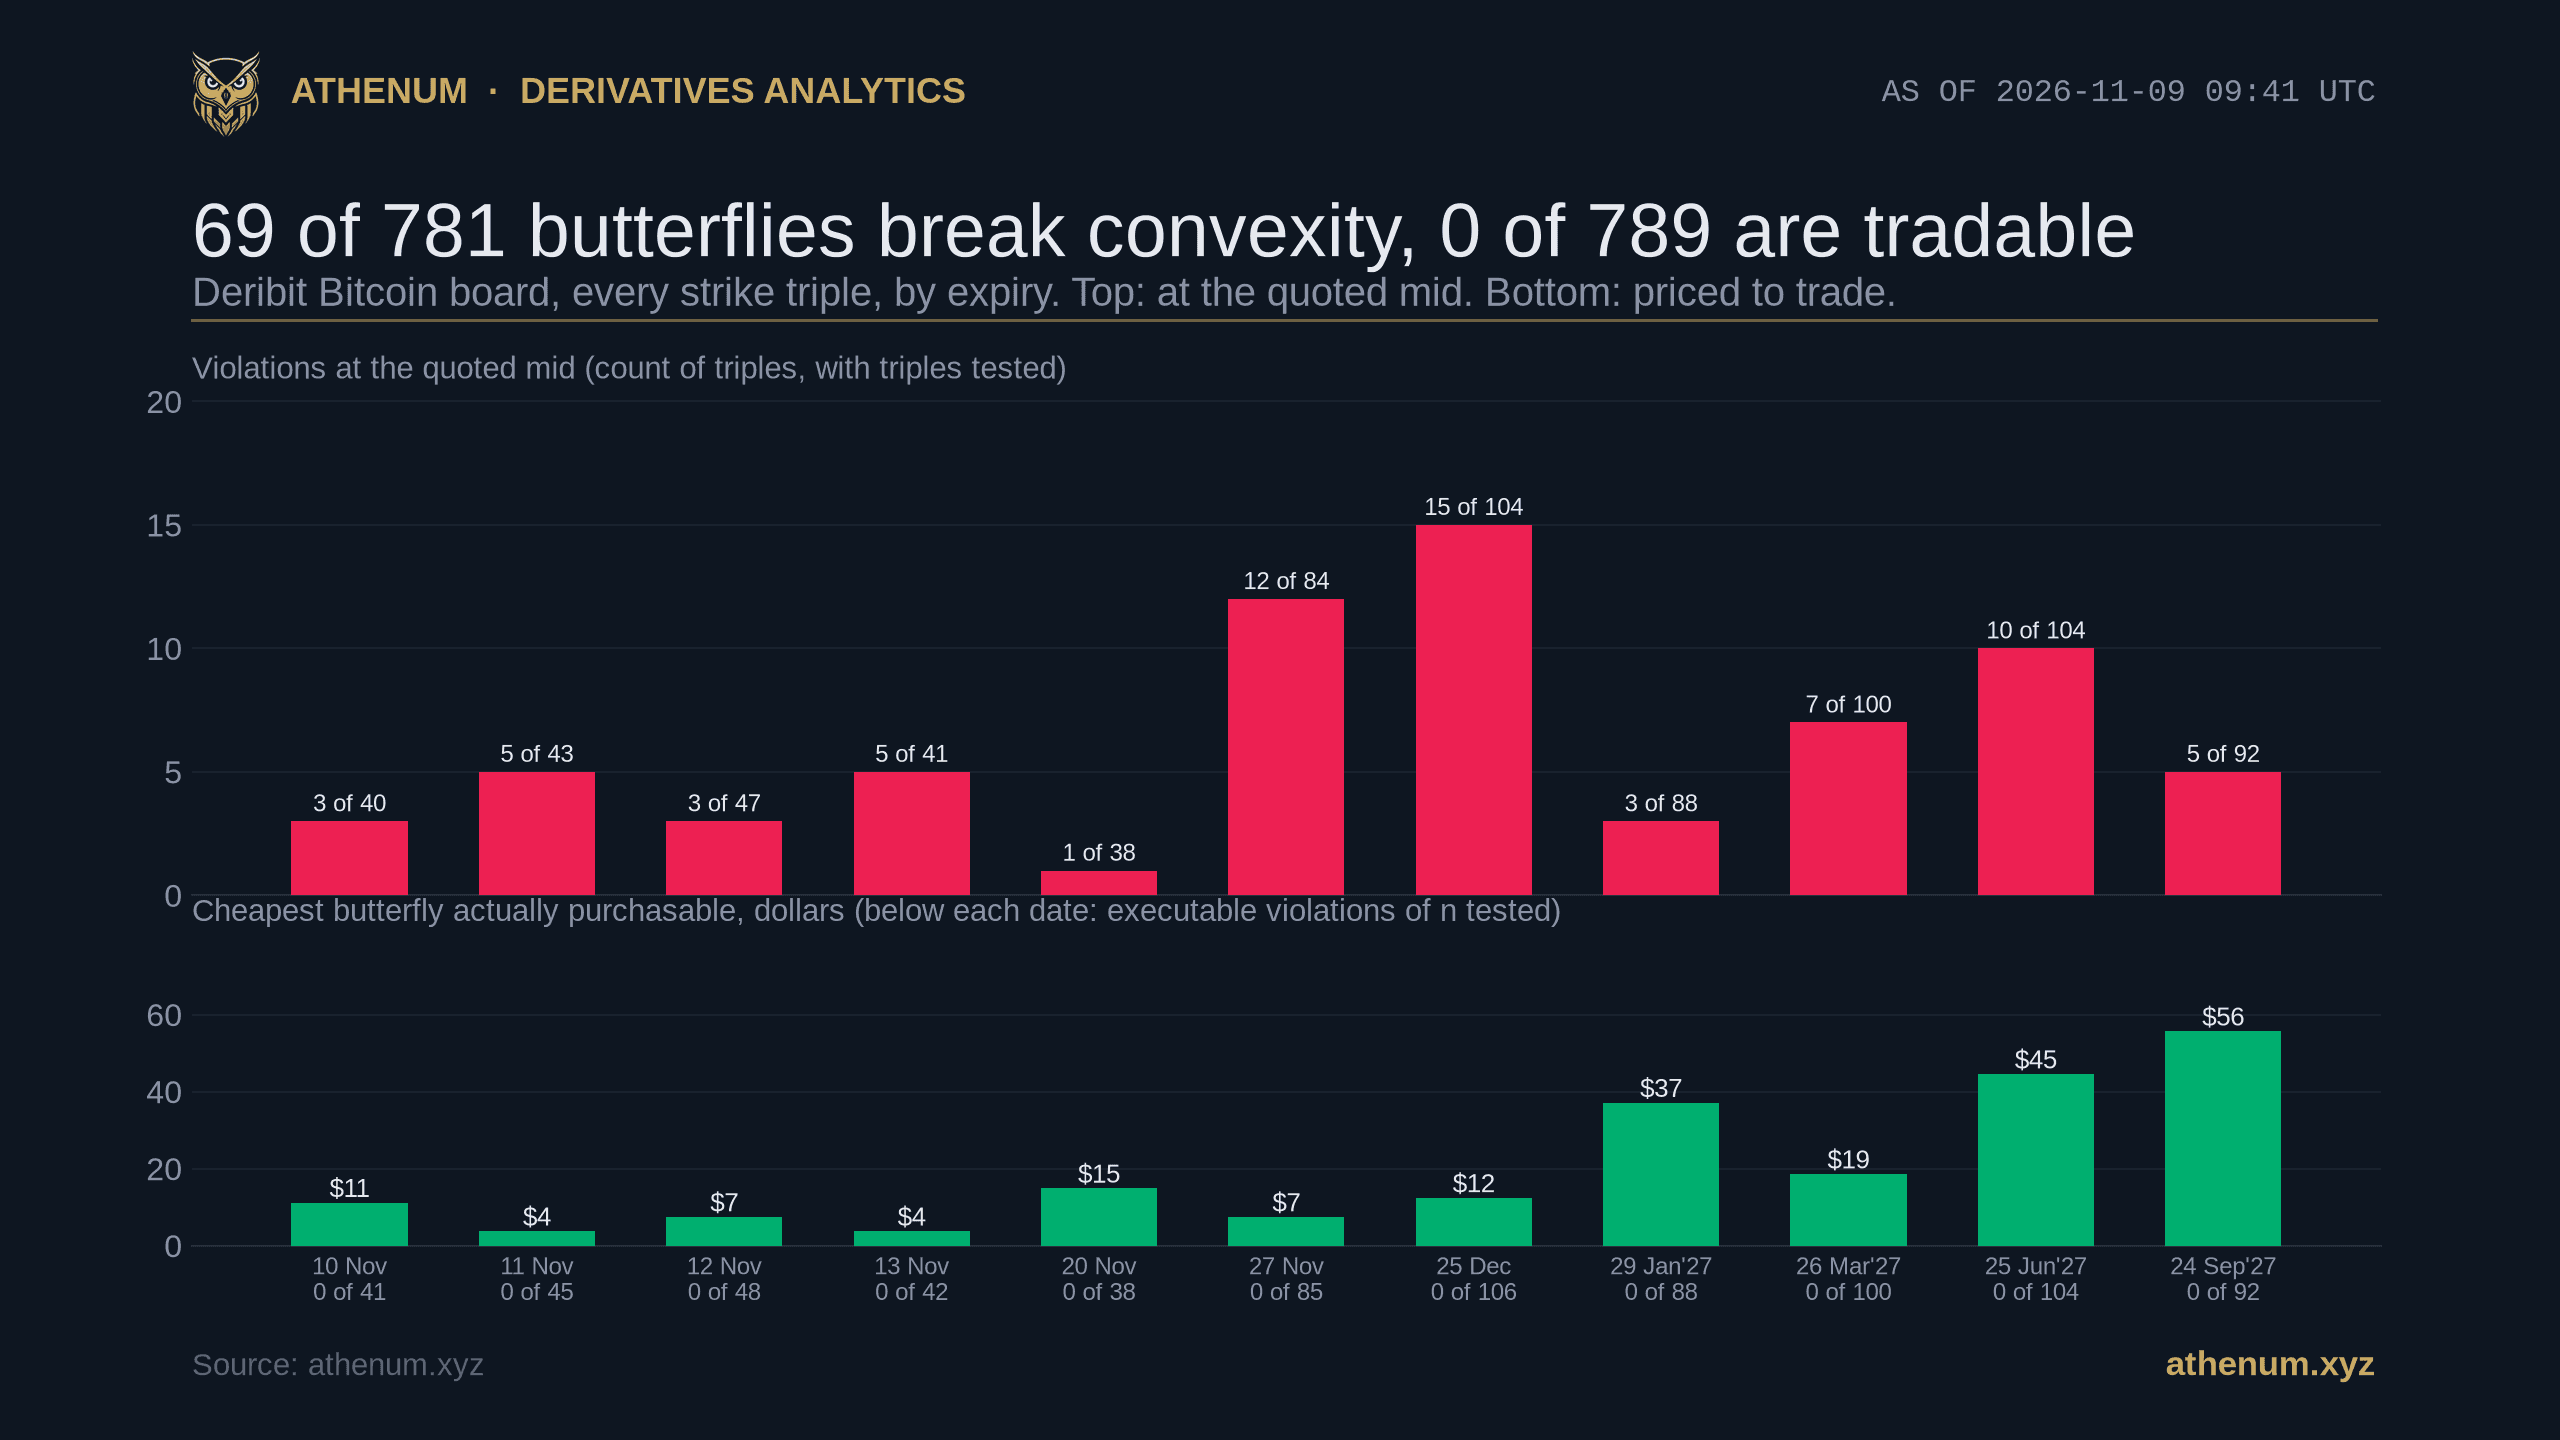
- How many Bitcoin butterflies break convexity at the quoted mid?
- Are those violations real prices, or rounding to the tick?
- Does a single one of those violations survive the bid-ask spread?
- Does Deribit's own mark price surface stay convex, and what does the Ether board say?
- Which strikes produce the violations?
- Does Athenum's own max pain feed match a from-scratch recompute?
- How do you run this check yourself?
TLDR. On 2026-11-09 at 09:41:06 UTC, with the Deribit index at 74,190.50 dollars, we tested every consecutive strike triple on the live Bitcoin option board against the convexity condition that any arbitrage free set of option prices has to satisfy. At the quoted midpoint, 69 of 781 triples fail it (8.8 percent), which looks like free money sitting on a screen. Three things say it is not. First, 44 of the 69 are no larger than two of Deribit's finest price increments (0.0001 coin), and the median is 1.25 increments, so most of the "arbitrage" is rounding. Second, priced where a taker would actually trade, buying the wings at the ask and selling the body at the bid, 0 of 789 triples fail, and the cheapest butterfly on the board still costs 3.71 dollars. Third, the median violation is 4.3 percent of the extra cost of crossing the spread on its three legs, and the single worst is 50.0 percent. The Ether board, tested in the same pass, agrees: 63 of 675 at the mid, 0 of 681 when you pay. The midpoint is not a price.
What is the convexity condition, and why can no real option board break it?
Option prices carry restrictions that hold without any model. The one that matters here goes back to Merton's 1973 paper on rational option pricing and Breeden and Litzenberger's 1978 paper on state-contingent claims: a call price must be convex in the strike. The second derivative of the call price with respect to the strike equals the discounted risk neutral probability density at that strike, so a board that breaks convexity implies a negative density. By put-call parity the same holds for puts, and the test below runs on both.
The tradable form is the butterfly. Buy the call at a low strike, buy the call at a high strike, sell the call in the middle, weighting the two wings so the payoff is exactly zero beyond both of them (the low wing gets the high gap over the total width, the high wing gets the low gap over the total width). Its payoff at expiry is a tent that is zero outside the wings and positive between them. It can never pay less than nothing, so it can never cost less than nothing. If a board prices it below zero, you are being paid to accept a payoff that cannot lose.
Deribit quotes Bitcoin option premiums in coin, not in dollars. That does not disturb the test: within one expiry every strike is quoted against the same expiry specific underlying, so converting to dollars multiplies all three legs by the same positive number and cannot change the sign. Dollar figures in this post are coin amounts times the 74,190.50 dollar spot index at the stamp, not times each expiry's forward, so they are approximate for the later expiries.
How many Bitcoin butterflies break convexity at the quoted mid?
69 of the 781 testable triples on 2026-11-09, or 8.8 percent. Deribit listed 862 Bitcoin options across 11 expiries at that stamp, 826 of them quoted on both sides and 36 with an ask but no bid, so the board is quoted on both sides almost throughout. The executable test below covers 789 triples rather than 781 because it can use ask-only wings but needs a bid on the body. The largest single violation is 166.93 dollars per butterfly, on the 25 December 2026 expiry. The median is 9.27 dollars.
The failures appear in every one of the 11 expiries, from 1 of 38 on 20 November to 15 of 104 on 25 December and 10 of 104 on 25 June 2027. With counts that small per expiry, the ordering between expiries should not be read as a term structure of mispricing; the per bar counts are printed on the chart so you can judge that for yourself.
One rule needs stating, because it changes the headline. 108 triples price at 0.00 dollars after rounding to a millionth of a dollar, and in 21 of them floating point arithmetic produced a tiny negative number that looks like a violation. We round every package first and count a violation only when it is below zero after that. Without the rounding the count would have read 90.
The vertical conditions behave differently. Monotonicity, the requirement that a lower strike call never cost less than a higher strike one (and the mirror image for puts), holds at 803 of 803 adjacent pairs at the mid, with no exceptions. Convexity is a second difference of quotes, so it is the condition most sensitive to noise, and it is the one that fails.
Are those violations real prices, or rounding to the tick?
Mostly rounding. Deribit's finest price increment on these options is 0.0001 coin, which is 7.42 dollars at this index, and above a price of 0.005 coin the increment widens to 0.0005, according to the tick size fields in the instrument list. A butterfly built from three prices that are each a whole number of increments can land a fraction of an increment below zero purely because the wing weights are not whole numbers.

Size of each of the 69 mid-price violations in units of 0.0001 coin, 2026-11-09. 44 of the 69 are within two increments (7.42 dollars each at the 74,190.50 index) and the median is 1.25 increments, or 9.27 dollars. Each bin includes its upper edge. Only 4 are larger than 10 increments.
Measured in those units, 13 of the 69 violations are no larger than one increment and 31 more fall between one and two, so 44 of 69 sit within two increments. The median is 1.25 increments, which is the 9.27 dollars quoted above. Only 4 of the 69 exceed 10 increments. A violation worth one or two ticks is not a pricing error you could harvest; it is the resolution of the price grid showing through a second difference.
Does a single one of those violations survive the bid-ask spread?
No. Not one, in any expiry.
A violation at the mid is not an opportunity, because nobody trades at the mid. The honest version of the test prices the position as it would be filled: the two wings you buy cost the ask, the body you sell pays the bid. Done that way, all 789 testable Bitcoin butterflies cost money. The cheapest one anywhere is 3.71 dollars, and the cheapest per expiry runs from about 4 dollars on the 11 and 13 November contracts to 55.64 dollars on 24 September 2027.

Each dot is one of the 69 violating triples. The dashed line is where the violation would exactly pay for the spread. All 69 sit above it, so the spread costs more than the violation is worth. The median violation is 4.3 percent of its own spread cost; the single worst is 50.0 percent, still short of break even. The spread cost is measured from the mid: half the quoted spread on each leg, weighted by the butterfly.
Here the cost to trade is measured from the mid, as half the quoted spread on each leg weighted by the butterfly. Across all 781 testable triples its median is 120.56 dollars. The margin is not narrow: the worst violation reaches only half of its own cost, and the typical one reaches 4.3 percent. A taker cannot close a gap of that shape, because the quantity being compared is the spread itself. A resting order could in principle be filled at the mid, but that depends on being hit at a price the book is not offering, and quotes say nothing about size.
Does Deribit's own mark price surface stay convex, and what does the Ether board say?
The mark price, which Deribit smooths across the surface rather than taking raw from the book, fails convexity at 62 of 818 triples (7.6 percent). Those violations are small: a median of 0.46 dollars and a worst case of 7.33 dollars, against 9.27 and 166.93 at the mid. Mark prices are model derived, and they still fail convexity at 62 of 818 triples.
The Ether board, tested at the same stamp with the index at 2,105.82 dollars, tells the same story in the same proportions. Deribit listed 740 Ether options, 720 of them two sided.
Test | Bitcoin board | Ether board |
|---|---|---|
Options listed, of which two sided | 862, of which 826 | 740, of which 720 |
Convexity at the quoted mid | 69 of 781 fail (8.8 percent) | 63 of 675 fail (9.3 percent) |
Convexity at the mark price | 62 of 818 fail (7.6 percent) | 39 of 696 fail (5.6 percent) |
Convexity priced to trade | 0 of 789 fail | 0 of 681 fail |
Cheapest butterfly on the board | 3.71 dollars | 0.21 dollars |
Monotonicity in strike at the mid | 0 of 803 fail | 0 of 697 fail |
Two independently quoted boards, two underlyings, and the same ordering both times: noisy at the mid, smaller at the mark, clean when you pay.
Which strikes produce the violations?
The ones far above spot. Grouped by the distance of the middle strike from the index, with calls and puts pooled, the violations are not spread evenly, and the counts per group matter as much as the rates, so both are shown.
Middle strike versus spot | Violations at the mid | Triples tested | Share |
|---|---|---|---|
Below 0.7 times | 1 | 25 | 4.0 percent |
0.7 to 0.9 times | 1 | 88 | 1.1 percent |
0.9 to 1.1 times | 12 | 297 | 4.0 percent |
1.1 to 1.5 times | 37 | 262 | 14.1 percent |
Above 1.5 times | 18 | 109 | 16.5 percent |
Triples centred above 1.1 times spot fail at 55 of 371 (14.8 percent); everything at or below 1.1 times fails at 14 of 410 (3.4 percent). The two groups at the low end rest on 25 and 88 observations, so their individual rates carry wide uncertainty and only the split between triples centred above 1.1 times spot and the rest is safe to read. Splitting the same table by option type shows what drives it: 44 of the 55 violations above 1.1 times spot are puts (29 of 139 in the 1.1 to 1.5 band and 15 of 61 above 1.5 times), and only 11 are calls. A put struck well above spot is deep in the money and quoted at a large coin price, where Deribit's grid widens to 0.0005. A plausible reading is that grid rounding is largest there; this post did not test that cause directly.
Does Athenum's own max pain feed match a from-scratch recompute?
It would be a cheap post that scrutinised only somebody else's numbers, so here is a check on ours. It is a different test from the one above: a recompute of a deterministic definition, not a convexity test. Athenum's keyless options max pain endpoint returns, for each listed Bitcoin expiry, the strike at which total intrinsic value paid to option holders is smallest given open interest. At 09:42 UTC on 2026-11-09, with spot at 74,214.99 dollars, it returned 11 expiries.
We then recomputed the same quantity from scratch from Deribit's public book summaries taken in the same two seconds: sum call and put open interest per strike for each expiry, and for every listed strike compute the payout holders would collect if the contract settled there, then take the strike with the smallest total. All 11 of 11 expiries matched to the dollar, ranging from 74,500 dollars (12 November) to 84,000 dollars (24 September 2027), and all 11 sit above spot.

Max pain by expiry, Athenum feed (gold) against a recompute from Deribit open interest (ring), 2026-11-09 09:42 UTC. The two agree on all 11 expiries, and every one lies above the 74,214.99 dollar spot. Agreement shows the definition is implemented correctly; it says nothing about whether price gravitates to max pain.
That is a limited claim and it should be read as one. Two computations of a deterministic definition on the same inputs agreeing shows the feed implements the definition; it is not evidence that price is pulled toward those strikes. For what the number does and does not predict, see Athenum's explainer on options max pain.
How do you run this check yourself?
Every option figure above comes from Deribit endpoints that ask for no key, at one stamp named in the text.
1. Pull the instrument list and the book summary for the currency from Deribit's public API (get_instruments, get_book_summary_by_currency), and the index price at the same moment so every quote converts against one number.
2. Group by expiry and option type, sort by strike, and take every consecutive triple.
3. Weight the wings so the butterfly is strike neutral, then price the package three times: at the mid, at Deribit's mark, and at the ask for what you buy and the bid for what you sell.
4. Round each package to a millionth of a dollar, count a violation only when it is below zero, and report the count against the number tested.
5. Express each violation in price increments before you call it an opportunity.
Only the third pricing is a price you could get. If you want to feel the size of the spread you are ignoring, the Black-Scholes calculator prices a single leg and the options profit calculator draws the tent shaped payoff this whole test is built on. For what a round trip on one option costs, see the spread cost of a Bitcoin option round trip, and for where the open interest sits by strike, see the concentration of option open interest by strike.
The Deribit figures can be rebuilt by anyone from the public endpoints and will differ on a later read, since the board changes every second. The max pain comparison uses Athenum's keyless request at https://api.athenum.xyz/api/v1/options/max-pain, and the calculators next to it stay free with nothing to sign up for and no cap on use. If you would rather watch the cross-venue derivatives data live, the terminal opens on a free 7 day Pro+ trial at app.athenum.xyz; the trial asks for no card and ends on its own.
One terminal. All the data.
Liquidations, orderbook depth, whale walls & open interest from 4 exchanges, all real-time, in one place.
No credit card required

Athenum Analytics
Athenum Analytics is our three-person editorial team covering crypto derivatives, market data and macroeconomic context.