Table of Contents8 sections
- What is the bitcoin taker buy sell ratio and how was it measured here?
- Does a high taker buy ratio predict the next hour?
- How much of an hour's move does the taker split explain?
- Does the buying carry on into the next hour, or does price lead it?
- Do exchanges even agree on the taker ratio?
- What does this mean when you read a taker ratio on a dashboard?
- What are the limits of this measurement?
- How do you check this yourself?
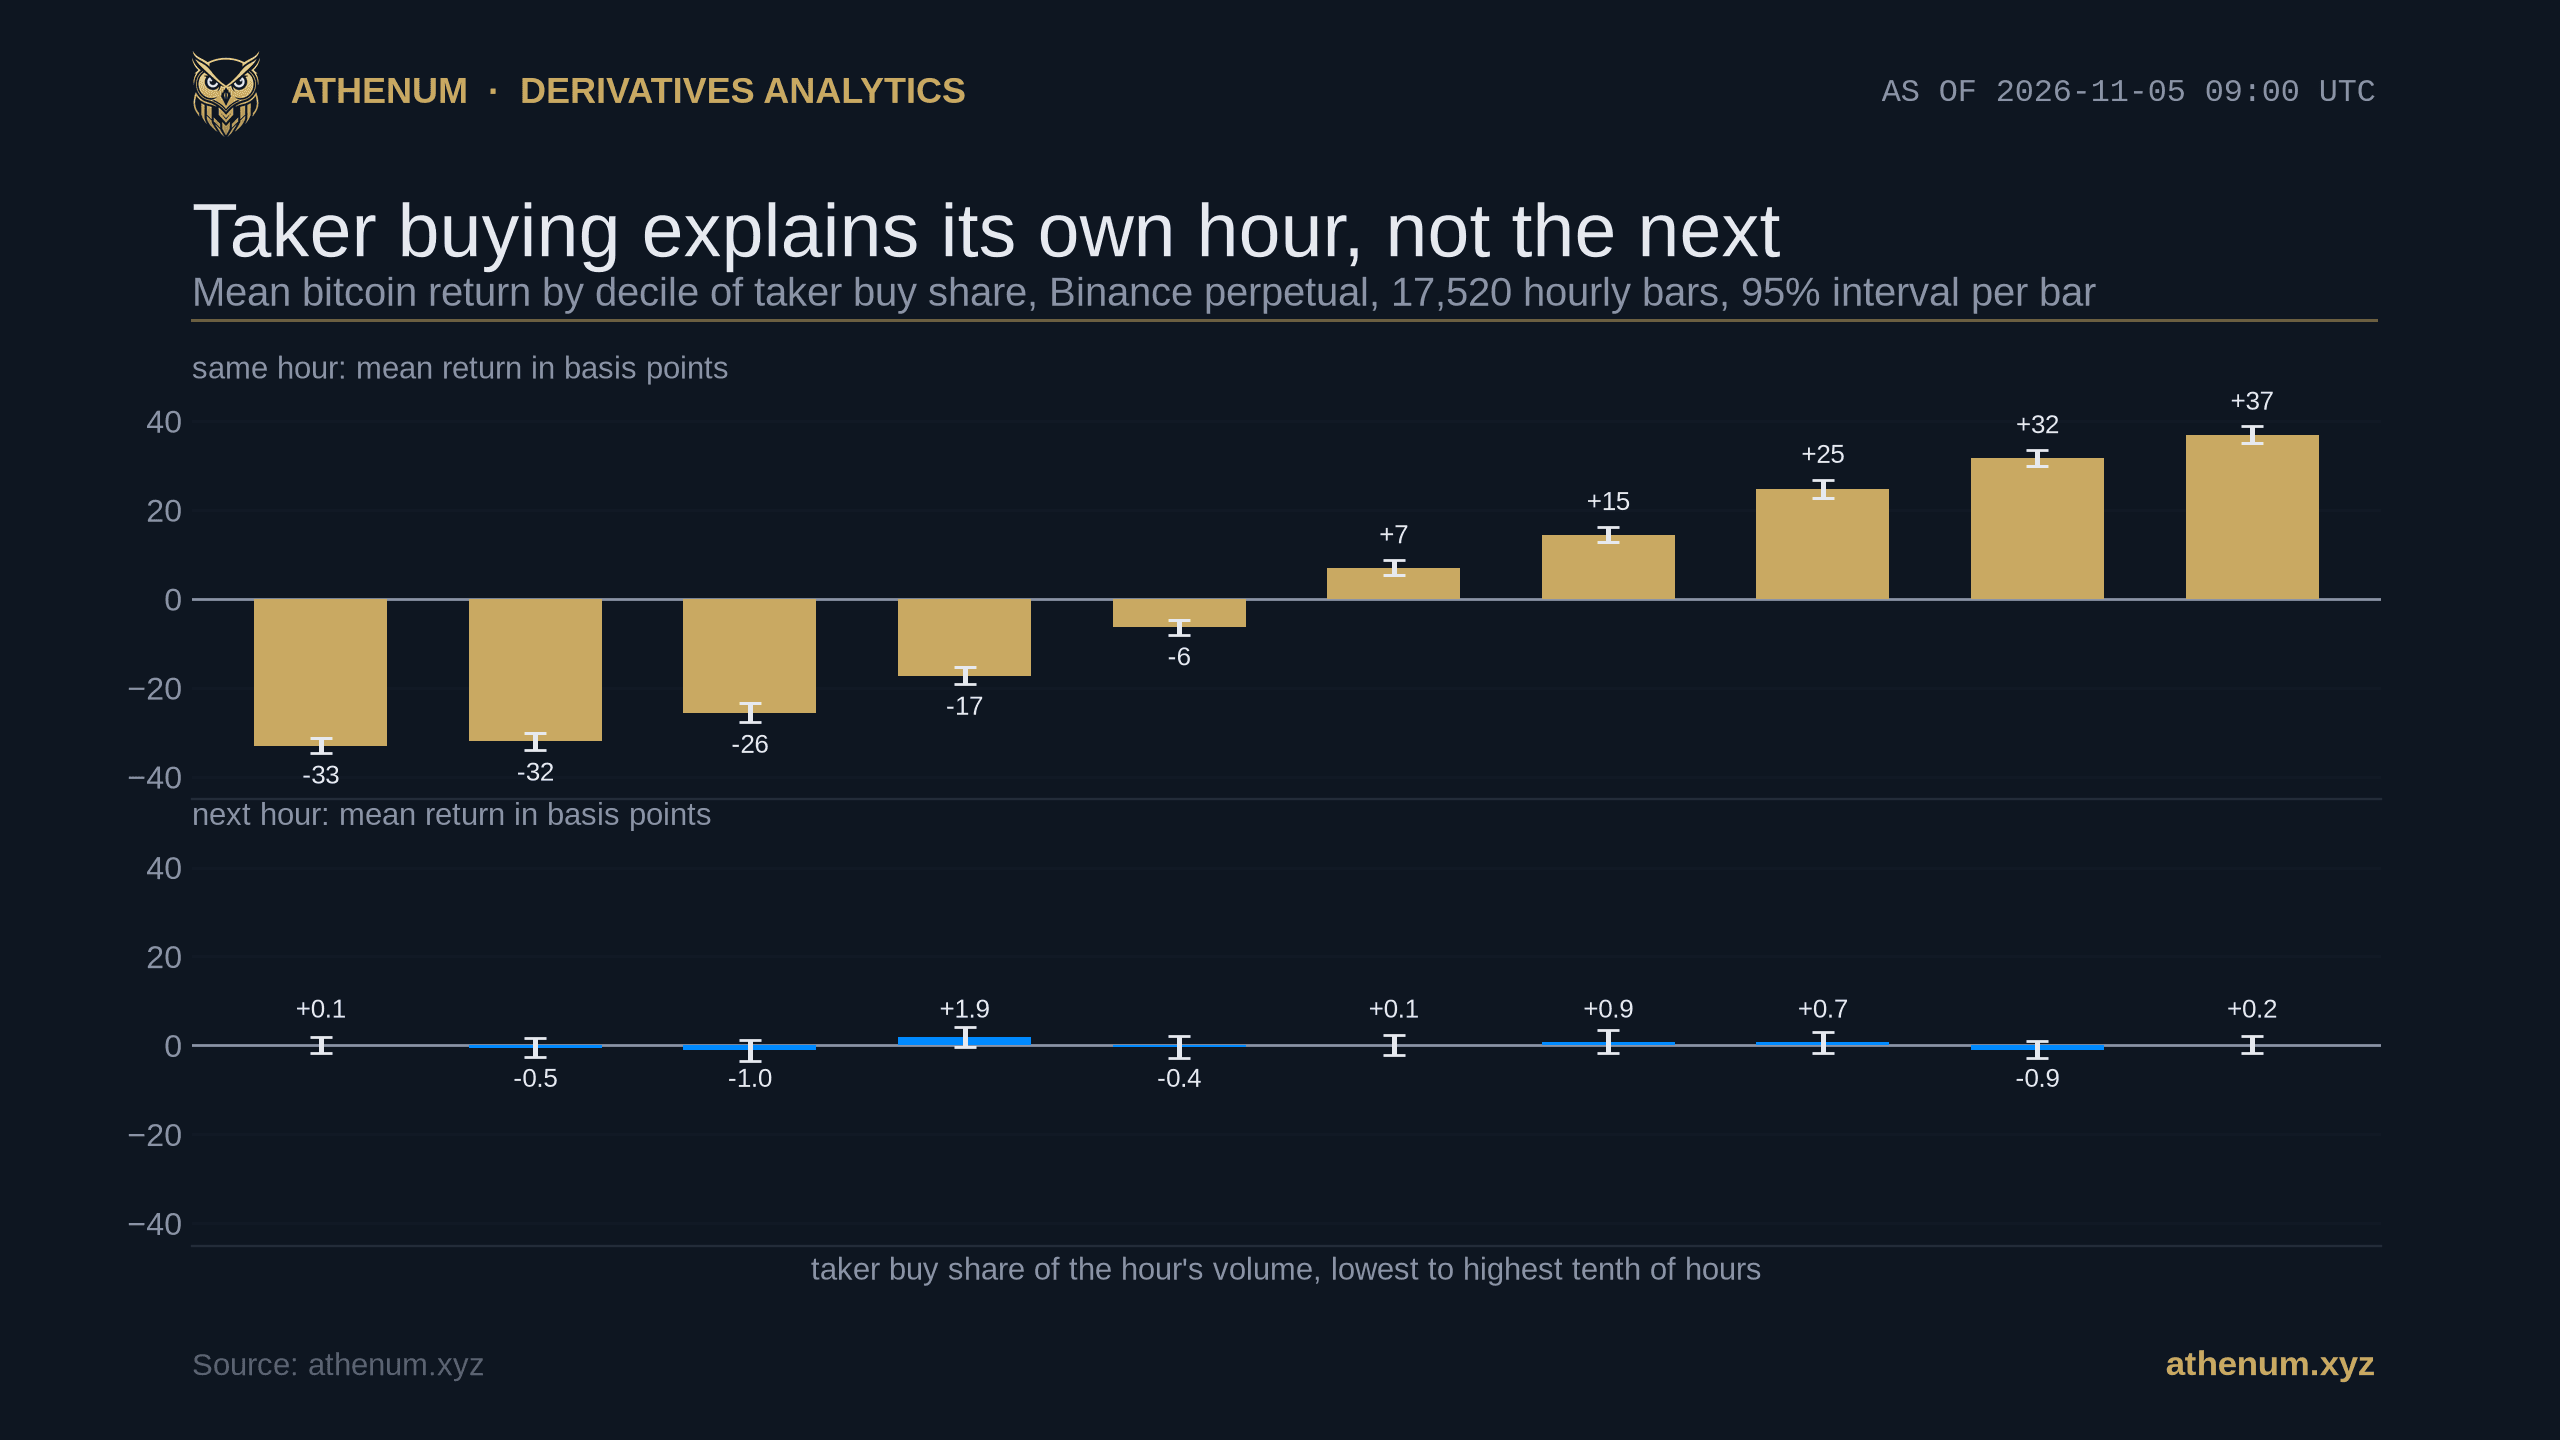
TLDR. The taker buy sell ratio tells you who was aggressive in the hour that just closed, and in two years of Binance bitcoin data it tells you almost nothing about the next hour. Across 17,520 hourly candles from 2024-11-05 09:00 UTC to 2026-11-05 09:00 UTC, the hour's taker imbalance correlates +0.49 with the same hour's return on the perpetual (+0.42 on spot) and +0.003 with the following hour's return (95 percent interval -0.010 to +0.015). The tenth of hours with the most taker buying (share above 56.5 percent, a ratio above 1.30) returned +36.9 basis points inside the hour and +0.2 in the next, with an interval of plus or minus 1.9; the tenth with the least returned -32.9 and +0.1. For scale, the average hour moves 30.8 basis points either way. The ratio is also not one number: on 2026-11-05 Athenum's cross-venue taker feed read the 08:00 UTC hour at 1.13 on Binance, 1.39 on OKX, 1.21 on Bitget and 0.92 on Gate.
What is the bitcoin taker buy sell ratio and how was it measured here?
Every trade on a futures exchange has an aggressor: the side that crossed the spread with a market order is the taker. Taker buy volume is the bitcoin bought by takers in an interval, taker sell volume the bitcoin sold by them. The ratio is buy divided by sell, so 1.00 is balance and 1.30 means takers bought 30 percent more than they sold. This post also uses the taker buy share, buy divided by buy plus sell, because a share of 56.5 percent is the same thing as a ratio of 1.30, and an imbalance, 2 times the share minus 1, which runs from -1 (all selling) to +1 (all buying).
The measurement uses Binance's public candle endpoints, which return a taker buy base volume field next to total volume for every candle. For BTCUSDT on the perpetual and on spot we pulled every hourly candle that had closed by 2026-11-05 09:00 UTC, 17,520 hours (730 days) each, and computed each hour's imbalance and its return in basis points, the log of close over open times 10,000. Nothing else was filtered out or adjusted.
Market (17,520 hours) | Imbalance vs same hour return | Imbalance vs next hour return | Share of hours with net taker buying | Up hours after a buying hour | Up hours after a selling hour |
|---|---|---|---|---|---|
Binance perpetual | +0.493 (0.480 to 0.507) | +0.003 (-0.010 to +0.015) | 47.6 percent | 49.2 percent | 51.1 percent |
Binance spot | +0.423 (0.412 to 0.436) | -0.012 (-0.025 to 0.000) | 44.0 percent | 48.6 percent | 51.6 percent |
Brackets are 95 percent intervals from a block bootstrap with 24 hour blocks and 2,000 resamples, so a day's worth of linked hours is resampled together. The base rate for an up hour is 50.2 percent on the perpetual and 50.3 percent on spot.
Does a high taker buy ratio predict the next hour?
On this data it does not. The next-hour correlation is +0.003 on the perpetual, with an interval that contains zero, and -0.012 on spot, with an interval that ends at about zero; the spot estimate is tiny and slightly negative, the wrong sign for a lead. Sorting the hours into ten equal groups by taker buy share and averaging the next hour's return in each gives the lower panel of the cover chart: the ten bars run from -1.0 to +1.9 basis points, every one with an interval of roughly plus or minus 2 that crosses zero, and the highest-buying tenth (+0.2) sits next to the lowest-buying tenth (+0.1). The difference between the top and bottom tenth, +0.06 basis points, comes with an interval of plus or minus 2.6, under a tenth of the 30.8 basis points an average hour moves.
The result is not an accident of one half of the sample. Splitting the 17,520 hours at the midpoint, the next-hour correlation on the perpetual is +0.001 in the first year and +0.005 in the second, and the same-hour correlation is +0.486 and +0.504. On spot the next-hour figures are -0.018 and -0.005. A buying hour was followed by an up hour 49.2 percent of the time and a selling hour by an up hour 51.1 percent of the time, against a 50.2 percent base rate, a gap within noise, and in the opposite direction to a lead.

Correlation of taker imbalance with the bitcoin return of the same hour and of the next hour, Binance perpetual and spot, 17,520 hourly bars to 2026-11-05 09:00 UTC. Lines are 95 percent block bootstrap intervals; the same-hour bars are about 0.5 and 0.4, the next-hour bars are indistinguishable from zero.
How much of an hour's move does the taker split explain?
A quarter of it, and it is the same hour. The same-hour correlation of +0.493 on the perpetual means the imbalance accounts for about 24 percent of the variance of that hour's return (18 percent on spot). Among hours with net taker buying, 77.7 percent closed up on the perpetual, against 25.2 percent of hours with net taker selling; between the lowest and highest tenth of buying the average hour's return moved from -32.9 to +36.9 basis points, a gap of 69.9.
That is a strong link, and it is a description of what already happened. A taker buy is a market order that lifts the offer, so heavy taker buying and a rising price are largely the same event counted twice. Reading the ratio after the fact tells you that an hour was driven by aggressive buying or selling. It does not follow that the aggression continues, and on this evidence it does not.
Does the buying carry on into the next hour, or does price lead it?
Neither strongly. The imbalance of one hour correlates only +0.024 with the next hour's imbalance on the perpetual and +0.196 on spot, so perpetual taker flow barely persists from one hour to the next and spot flow does a little. The one lagged link between price and flow that clearly clears zero runs from price to flow: the correlation between an hour's return and the next hour's imbalance is -0.047 on the perpetual (interval -0.057 to -0.035) and +0.054 on spot (+0.042 to +0.066). The signs differ between the two markets, and each explains under 0.3 percent of the variance, so treat it as a curiosity about microstructure rather than a pattern to trade.
Do exchanges even agree on the taker ratio?
Not hour by hour. Athenum's taker feed carries the hourly buy and sell split for bitcoin perpetuals on four venues, and the three latest completed hours on 2026-11-05 show how far apart the readings sit.
Hour (UTC, 2026-11-05) | Binance | OKX | Bitget | Gate |
|---|---|---|---|---|
06:00 to 07:00 | 1.15 | 0.99 | 1.24 | 0.98 |
07:00 to 08:00 | 0.91 | 0.78 | 0.77 | 1.10 |
08:00 to 09:00 | 1.13 | 1.39 | 1.21 | 0.92 |
In the 07:00 hour Gate's ratio was above 1 while the other three were below it, and in the 08:00 hour the picture flipped: Binance, OKX and Bitget read net buying, Gate net selling. Over the completed hours the feed holds, the sign of each hour's imbalance agreed with Binance's in 66.7 percent of hours on OKX (99 hours), 75.9 percent on Bitget (29 hours) and 55.9 percent on Gate (499 hours), against 50 percent for a coin flip, with correlations of the buy share of +0.54, +0.32 and +0.15. The hour counts differ because the feed keeps a different history for each venue, so the short windows carry wide uncertainty. Gate is the outlier for a reason the feed itself flags: its taker sizes come from a contract statistics endpoint and do not reconcile to its candle volume, so its ratio is best read as the provider's own statistic. Two more venues in the roster, Bybit and HTX, have no taker split source in the feed.

Share of completed hours in which a venue's taker imbalance pointed the same way as Binance's, bitcoin perpetuals, Athenum taker feed read on 2026-11-05. The Bitget window is only 29 hours, which is why its interval spans 58 to 88 percent; Gate's 499 hours give the tightest interval, 52 to 60 percent.
The feed's Binance series is the same quantity as the candles used above: over the 500 hours it holds, the buy share matched Binance's own perpetual candles to within 0.31 percentage points in every hour. OKX publishes its taker volume in contracts and the feed converts each at 0.01 bitcoin.

Bitcoin perpetual taker buy sell ratio by venue for the three completed hours to 09:00 UTC on 2026-11-05, Athenum taker feed. A bar above 1.00 means takers bought more than they sold. Gate sat on the opposite side of the other three in two of the three hours.
What does this mean when you read a taker ratio on a dashboard?
1. A ratio above 1 describes the past hour. With 17,520 hours behind it, 77.7 percent of buying hours on the Binance perpetual closed up, which is a statement about the candle you are already looking at.
2. A ratio is a statement about one venue. Other venues' aggressor splits matched Binance's direction in only 56 to 76 percent of hours (OKX, Bitget and Gate, over windows of 99, 29 and 499 hours), so quote the venue and the hour with the number.
3. Judge any claim that taker flow leads price by its interval, not its point estimate. Here the next-hour estimates are +0.003 and -0.012 with intervals that include or touch zero, and a ratio of 1.30 or more did not beat a ratio of 0.75 or less by more than the noise.
What are the limits of this measurement?
- One asset (BTCUSDT), one exchange's candles, one two-year window, one horizon (the next closed hour). The next-hour tests use 17,519 pairs, since the last hour has no successor. Nothing here says taker flow is useless over minutes, over days, for other coins, or inside a rare event; the test only covers the horizon most dashboards quote. - The tests are linear correlations and ten-group averages. A nonlinear or regime-specific pattern would not show up in them. - Return is open to close of the hour in UTC, in basis points. No fees, spreads, funding or slippage were applied, and no trading rule was tested. - Decile intervals use a normal approximation on 1,752 hours each; correlation intervals use a 24 hour block bootstrap with 2,000 resamples. Cross-venue sign agreement uses only completed hours, and the OKX and Bitget windows are short. - Taker means aggressor, not informed: a taker buy can be a stop, a liquidation or a hedge. Athenum's cross-venue feed makes the sources comparable, but it does not remove the definitional differences between venues.
How do you check this yourself?
At the time of writing none of these asks for a key.
1. Candles. GET fapi.binance.com/fapi/v1/klines?symbol=BTCUSDT&interval=1h&limit=1500 for the perpetual and GET api.binance.com/api/v3/klines?symbol=BTCUSDT&interval=1h&limit=1000 for spot, paged by startTime. Each row is an array in which index 5 is volume and index 9 is taker buy base volume, so the share is index 9 divided by index 5.
2. Statistics. Compute return as ln(close / open) times 10,000, imbalance as 2 times share minus 1, then correlate imbalance with the same row's return and with the next row's.
3. Cross-venue reading. GET api.athenum.xyz/api/v1/derivatives/positioning/taker-volume?symbol=BTC&period=1h returns the series per venue with buy volume, sell volume, ratio, a completeness flag and a note where a source does not reconcile.
To turn a view into a size, the free Athenum position sizing tool converts a risk budget into a position and the PnL calculator shows the result if the move does or does not come. For the definitions behind the ratio, Athenum's earlier explainers on taker versus maker flow and on cumulative volume delta cover how aggressor flow is summed into a running line.
Each figure from Athenum's taker feed was read on 2026-11-05 and can be re-checked from a keyless request; the feed is a rolling window, so a later read returns a later window and the 99, 29 and 499 hour counts will change. The calculators next to it stay free, with nothing to sign up for and no cap on use, and the cross-venue taker series sits in the terminal behind the free 7 day Pro+ trial at app.athenum.xyz; the trial asks for no card and ends on its own.
One terminal. All the data.
Liquidations, orderbook depth, whale walls & open interest from 4 exchanges, all real-time, in one place.
No credit card required

Athenum Analytics
Athenum Analytics is our three-person editorial team covering crypto derivatives, market data and macroeconomic context.