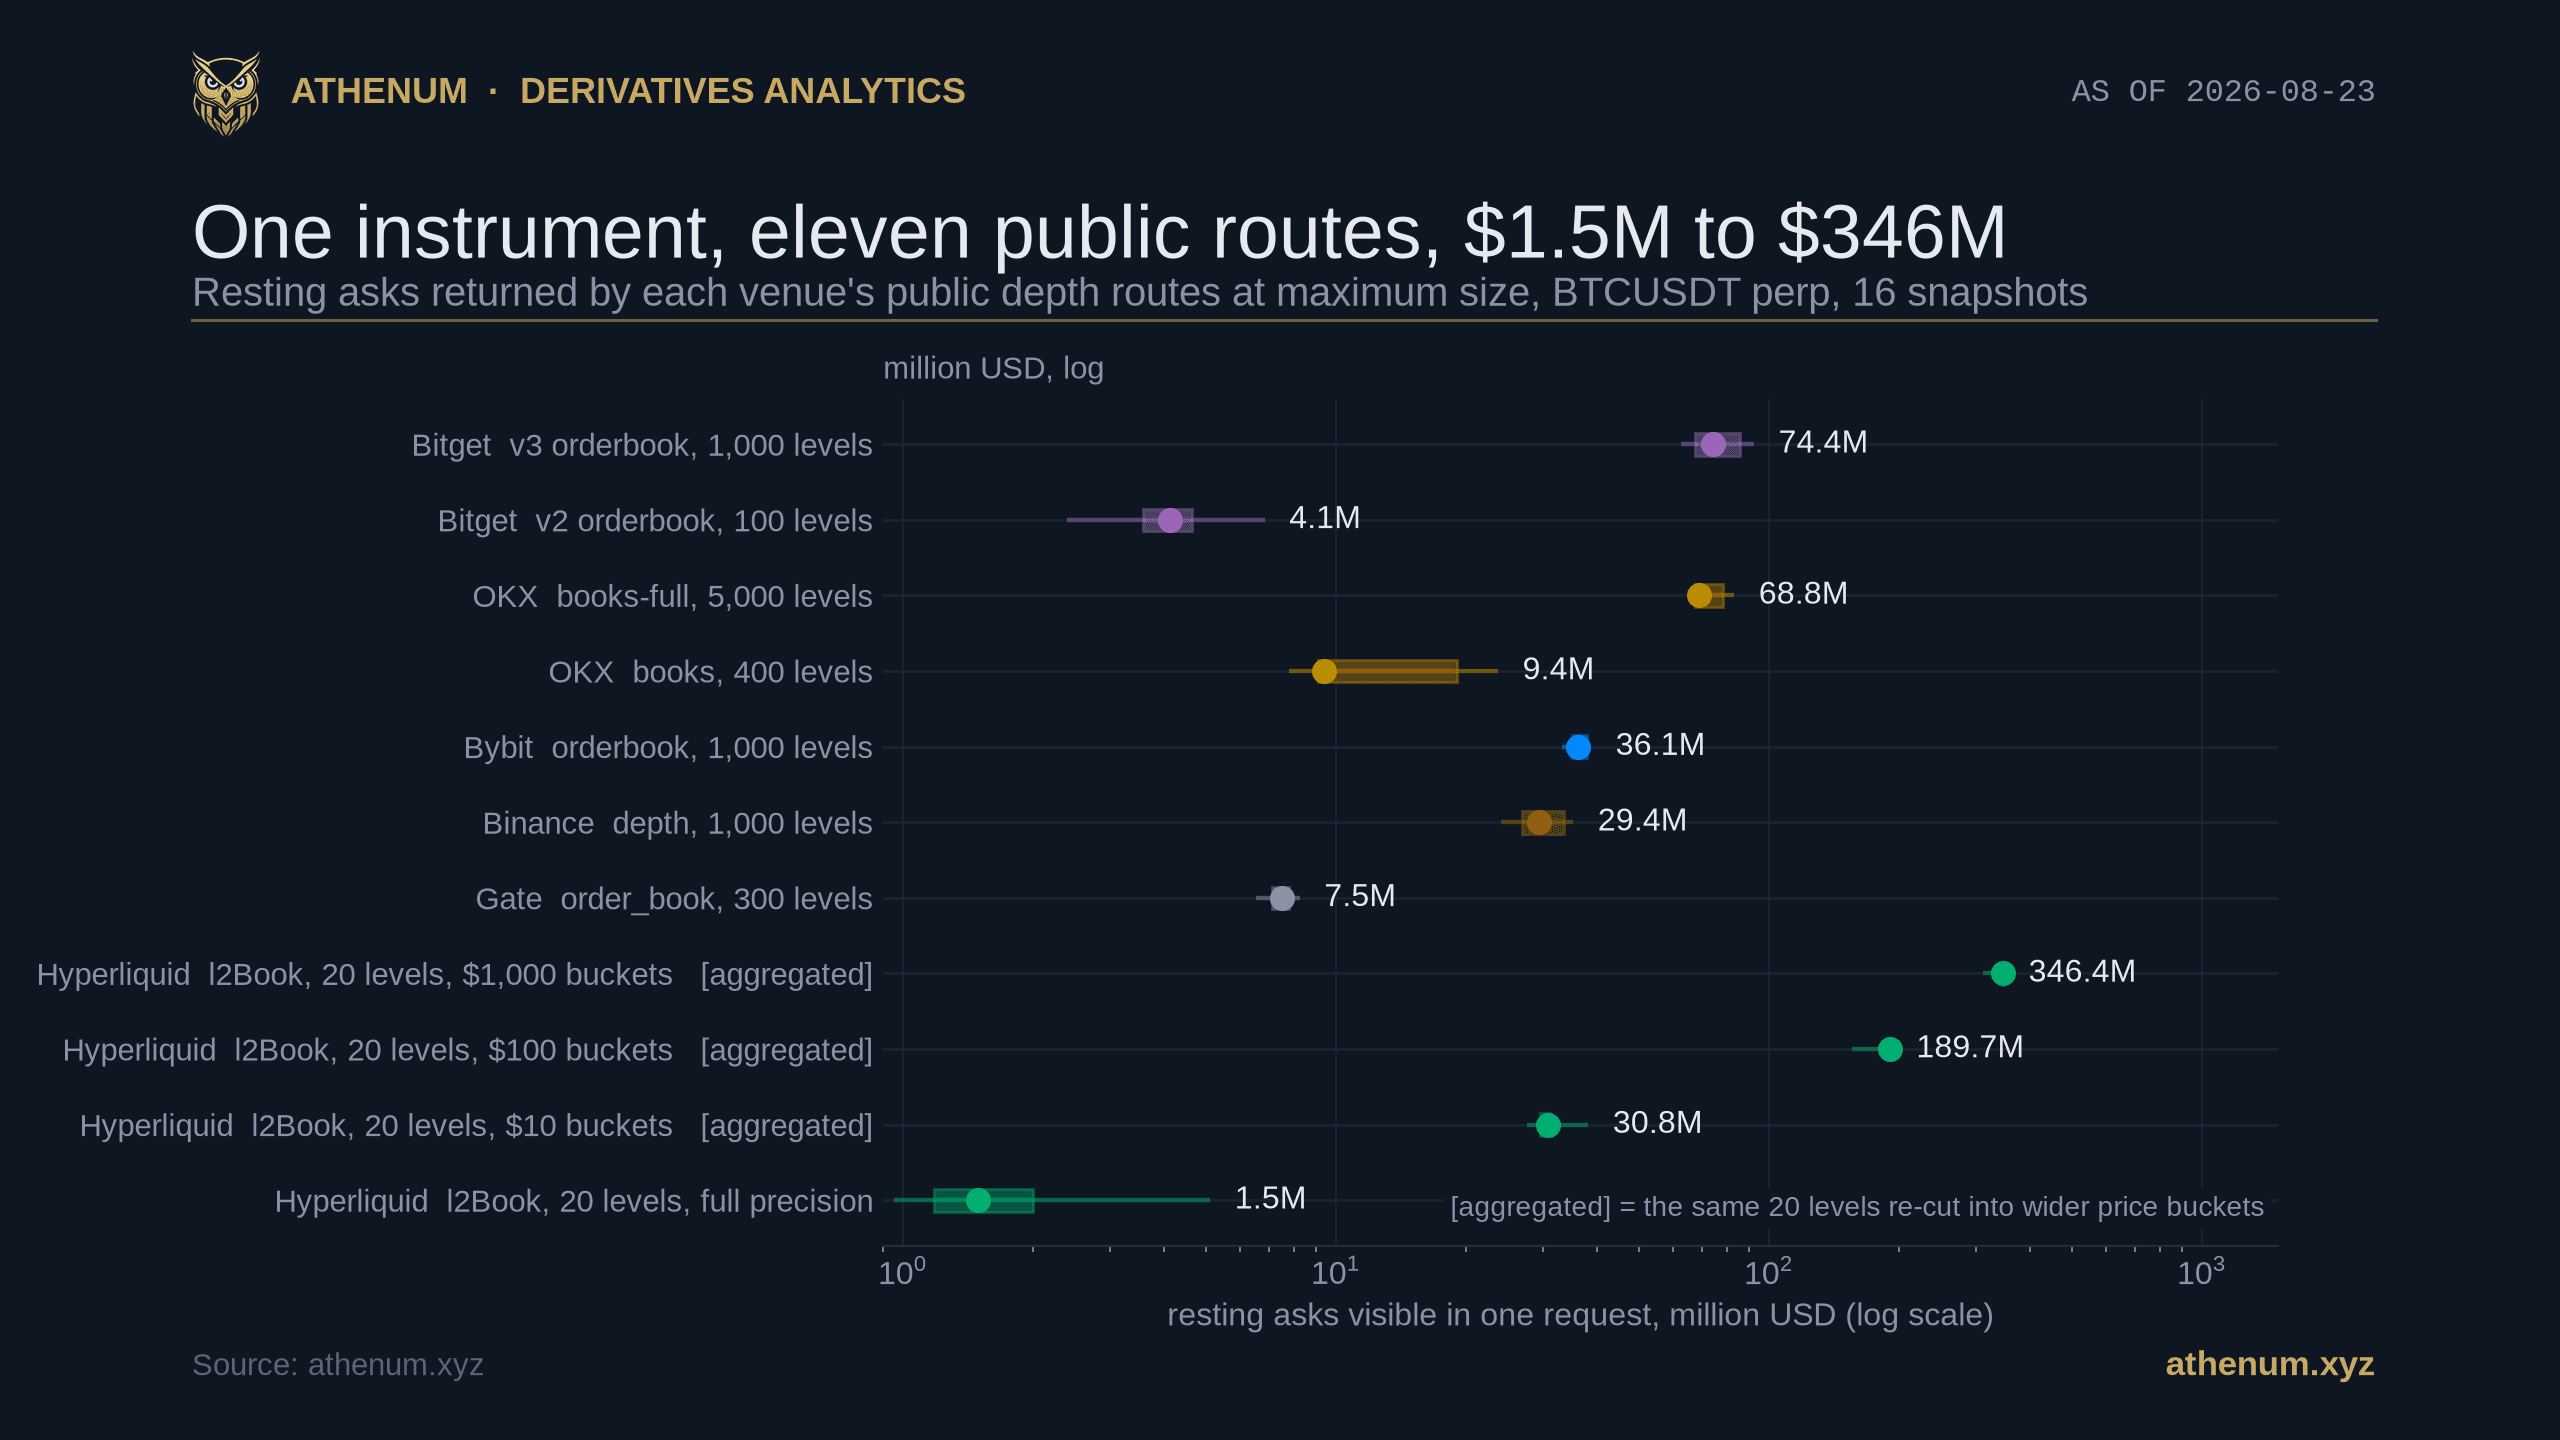
Athenum horizontal dot and box chart of the resting asks returned by eleven public order book routes on six Bitcoin perpetual venues, measured over 16 snapshots on 2026-08-23, drawn on a logarithmic million dollar axis. Each row shows the median as a dot with an interquartile box and a full range whisker. Reading down: Bitget v3 orderbook with 1,000 levels at 74.4M, Bitget v2 orderbook with 100 levels at 4.1M, OKX books-full with 5,000 levels at 68.8M, OKX books with 400 levels at 9.4M, Bybit orderbook with 1,000 levels at 36.1M, Binance depth with 1,000 levels at 29.4M, Gate order_book with 300 levels at 7.5M, and four Hyperliquid l2Book rows that all return 20 levels but hold 346.4M in 1,000 dollar buckets, 189.7M in 100 dollar buckets, 30.8M in 10 dollar buckets and 1.5M at full precision. The three bucketed Hyperliquid rows are tagged aggregated in their labels, and a note explains that aggregated means the same 20 levels re-cut into wider price buckets
Featured

Bitcoin Orderbuch Tiefe: dieselbe Börse, zwei Routen, das 18-Fache des Buchs

Am 2026-08-23 lieferte ein einzelner öffentlicher Request zwischen 1.49M und 346.37M USD an ruhenden Asks. Die größte Lücke entsteht nicht zwischen den Handelsplätzen, sondern zwischen zwei Routen derselben Börse.

Athenum AnalyticsAthenum Analytics20 min read
Read Article
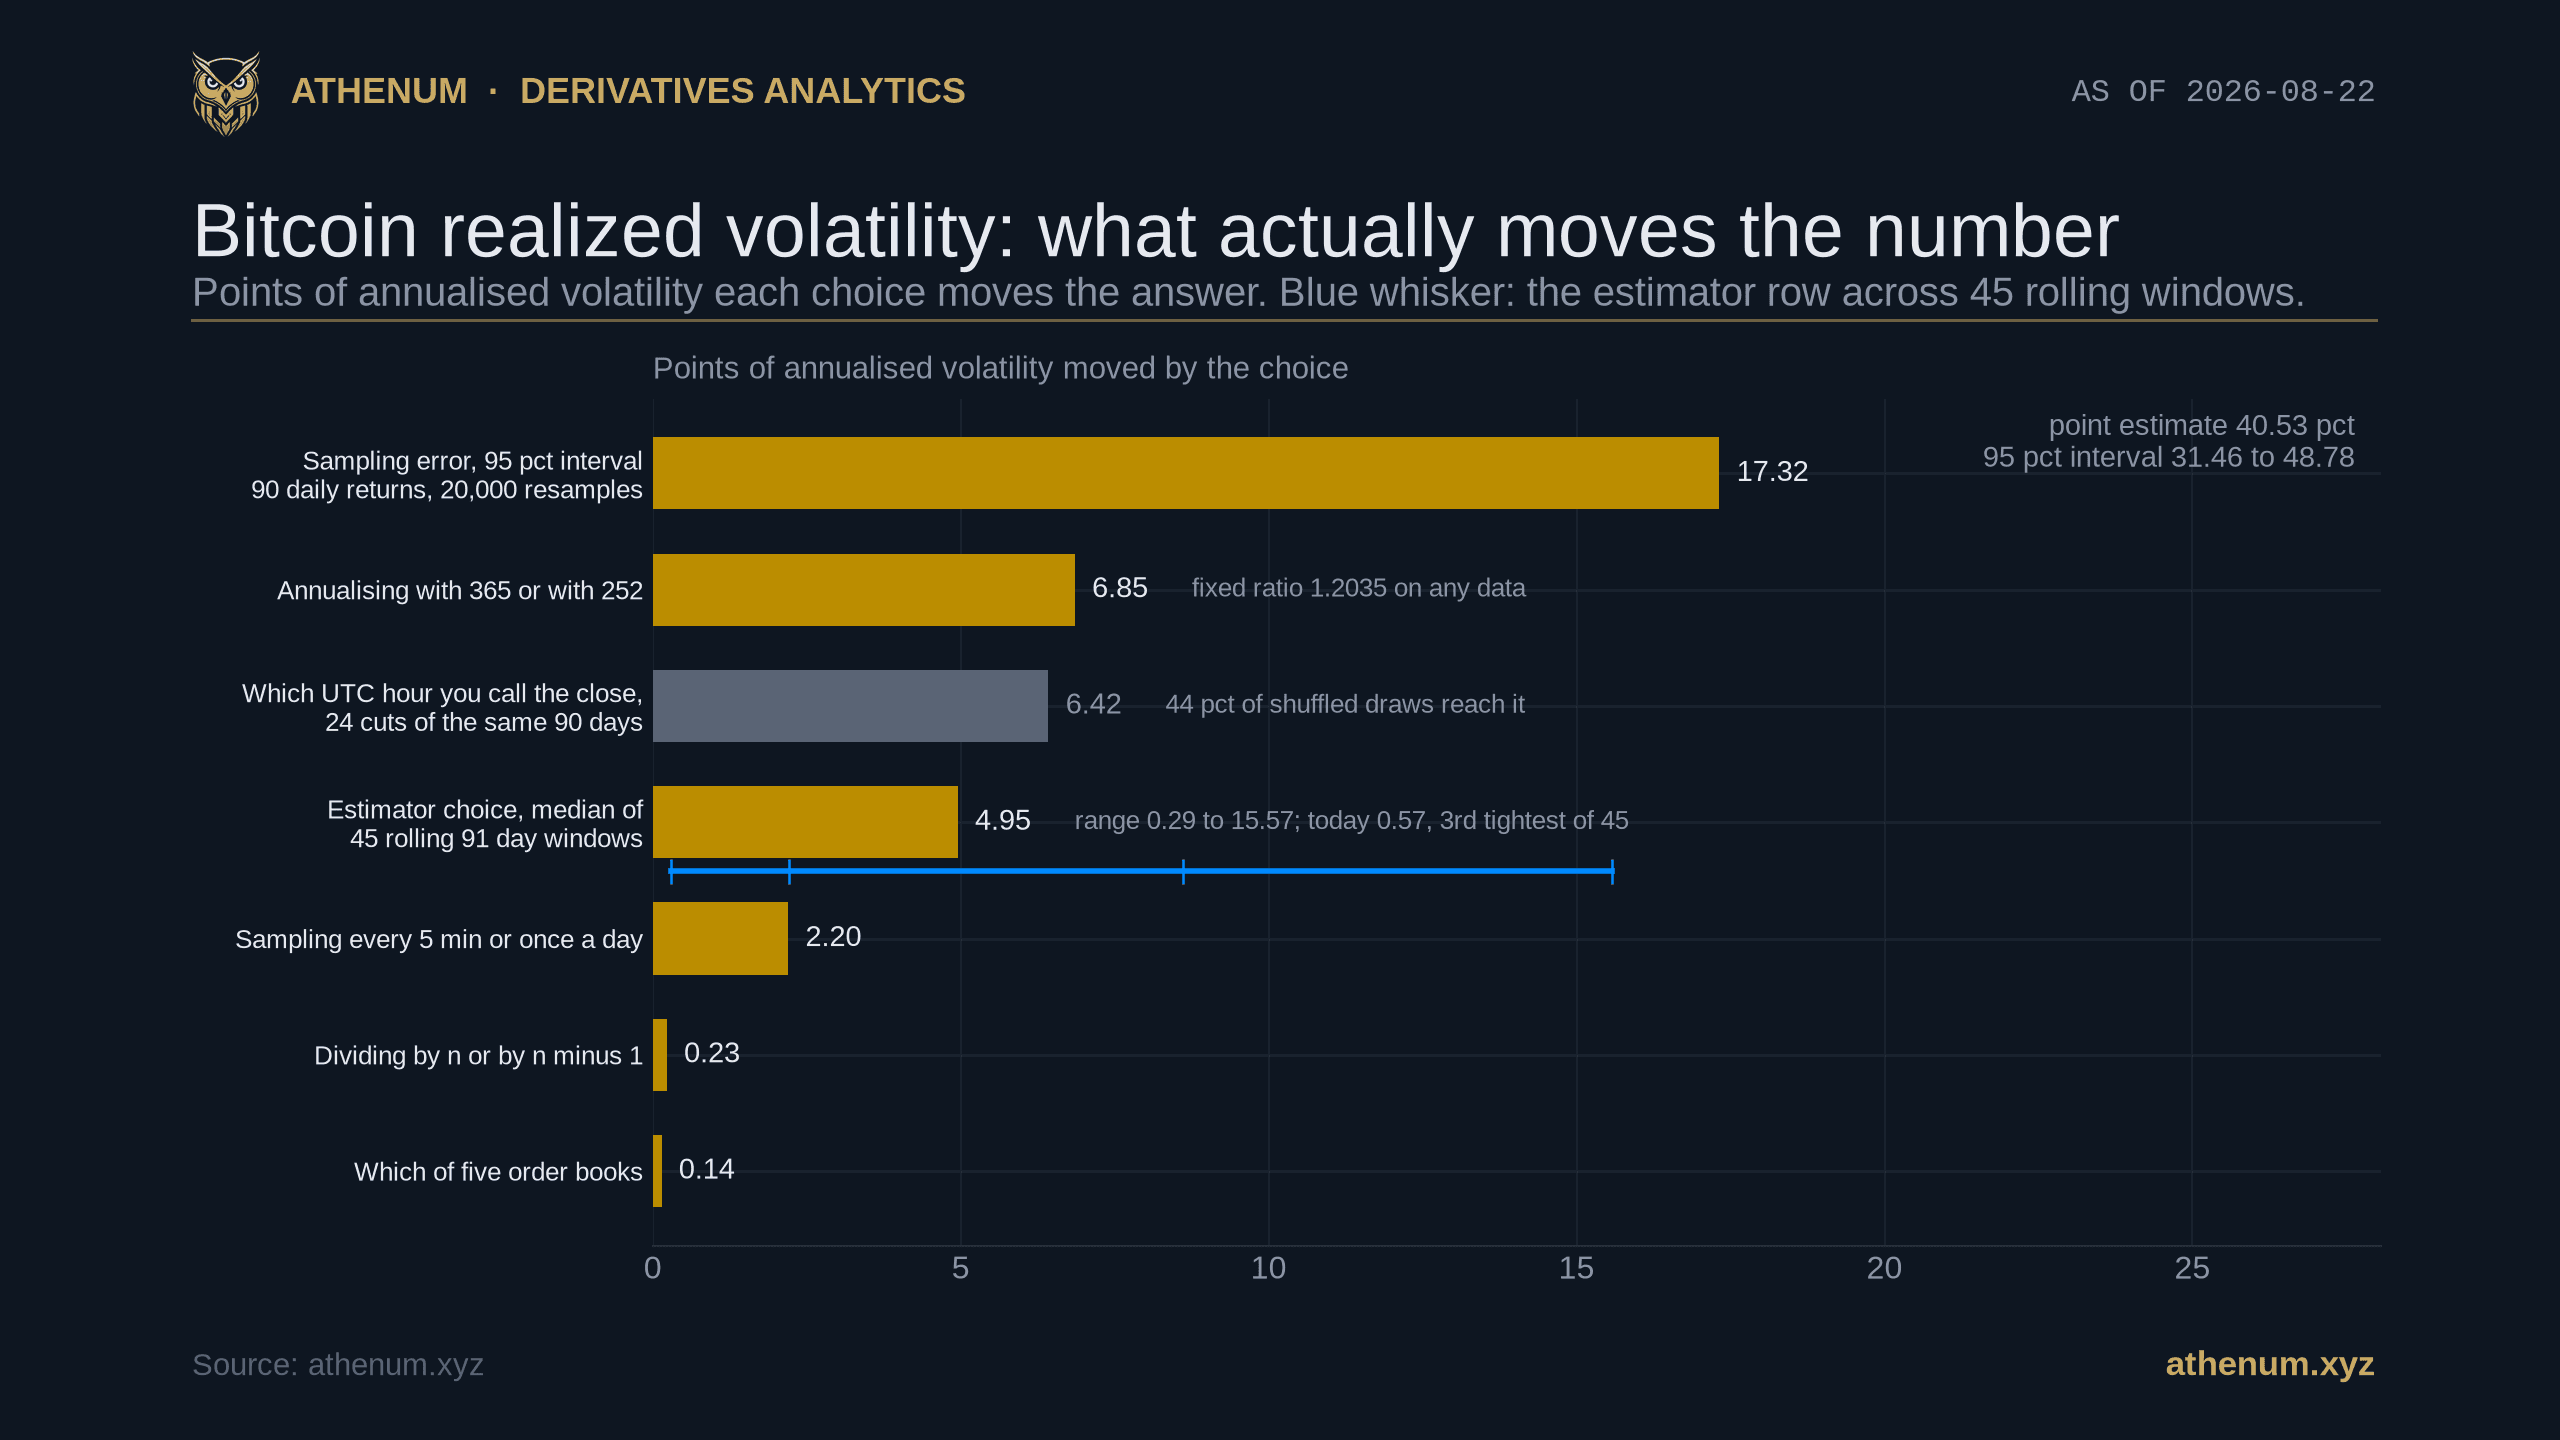
Athenum horizontal bar chart ranking seven ways to change Bitcoin's realized volatility number, each measured on the identical 90 day window of Binance BTCUSDT ending 2026-08-21. The bars read: sampling error 95 per cent interval 17.32 points, annualising with 365 or with 252 6.85, which UTC hour you call the close 6.42 drawn in grey and labelled as reached by 44 per cent of shuffled draws, estimator choice at a median of 4.95 across 45 rolling 91 day windows with a blue whisker beneath it spanning its 0.29 to 15.57 range and quartile ticks, sampling every 5 minutes or once a day 2.20, dividing by n or by n minus 1 0.23, and which of five order books you sample 0.14. A note in the corner gives the point estimate 40.53 per cent and the 95 per cent interval 31.46 to 48.78

Bitcoins realisierte Volatilität liegt bei 40.5 Prozent, plus oder minus 9

Realisierte Volatilität wird überall als einzelne Zahl veröffentlicht und fast nie mit einem Intervall. Wir haben sie für Bitcoin über 90 Tagesrenditen bis zum 2026-08-21 gemessen und danach jede Entscheidung geprüft, die hinter der Zahl steckt. Der Punktschätzer liegt bei 40.53 Prozent, das Bootstrap-Intervall bei 31.46 bis 48.78 Prozent, und dieses Band ist breiter als jede methodische Wahl, die wir getestet haben.

Athenum AnalyticsAthenum Analytics
21 min
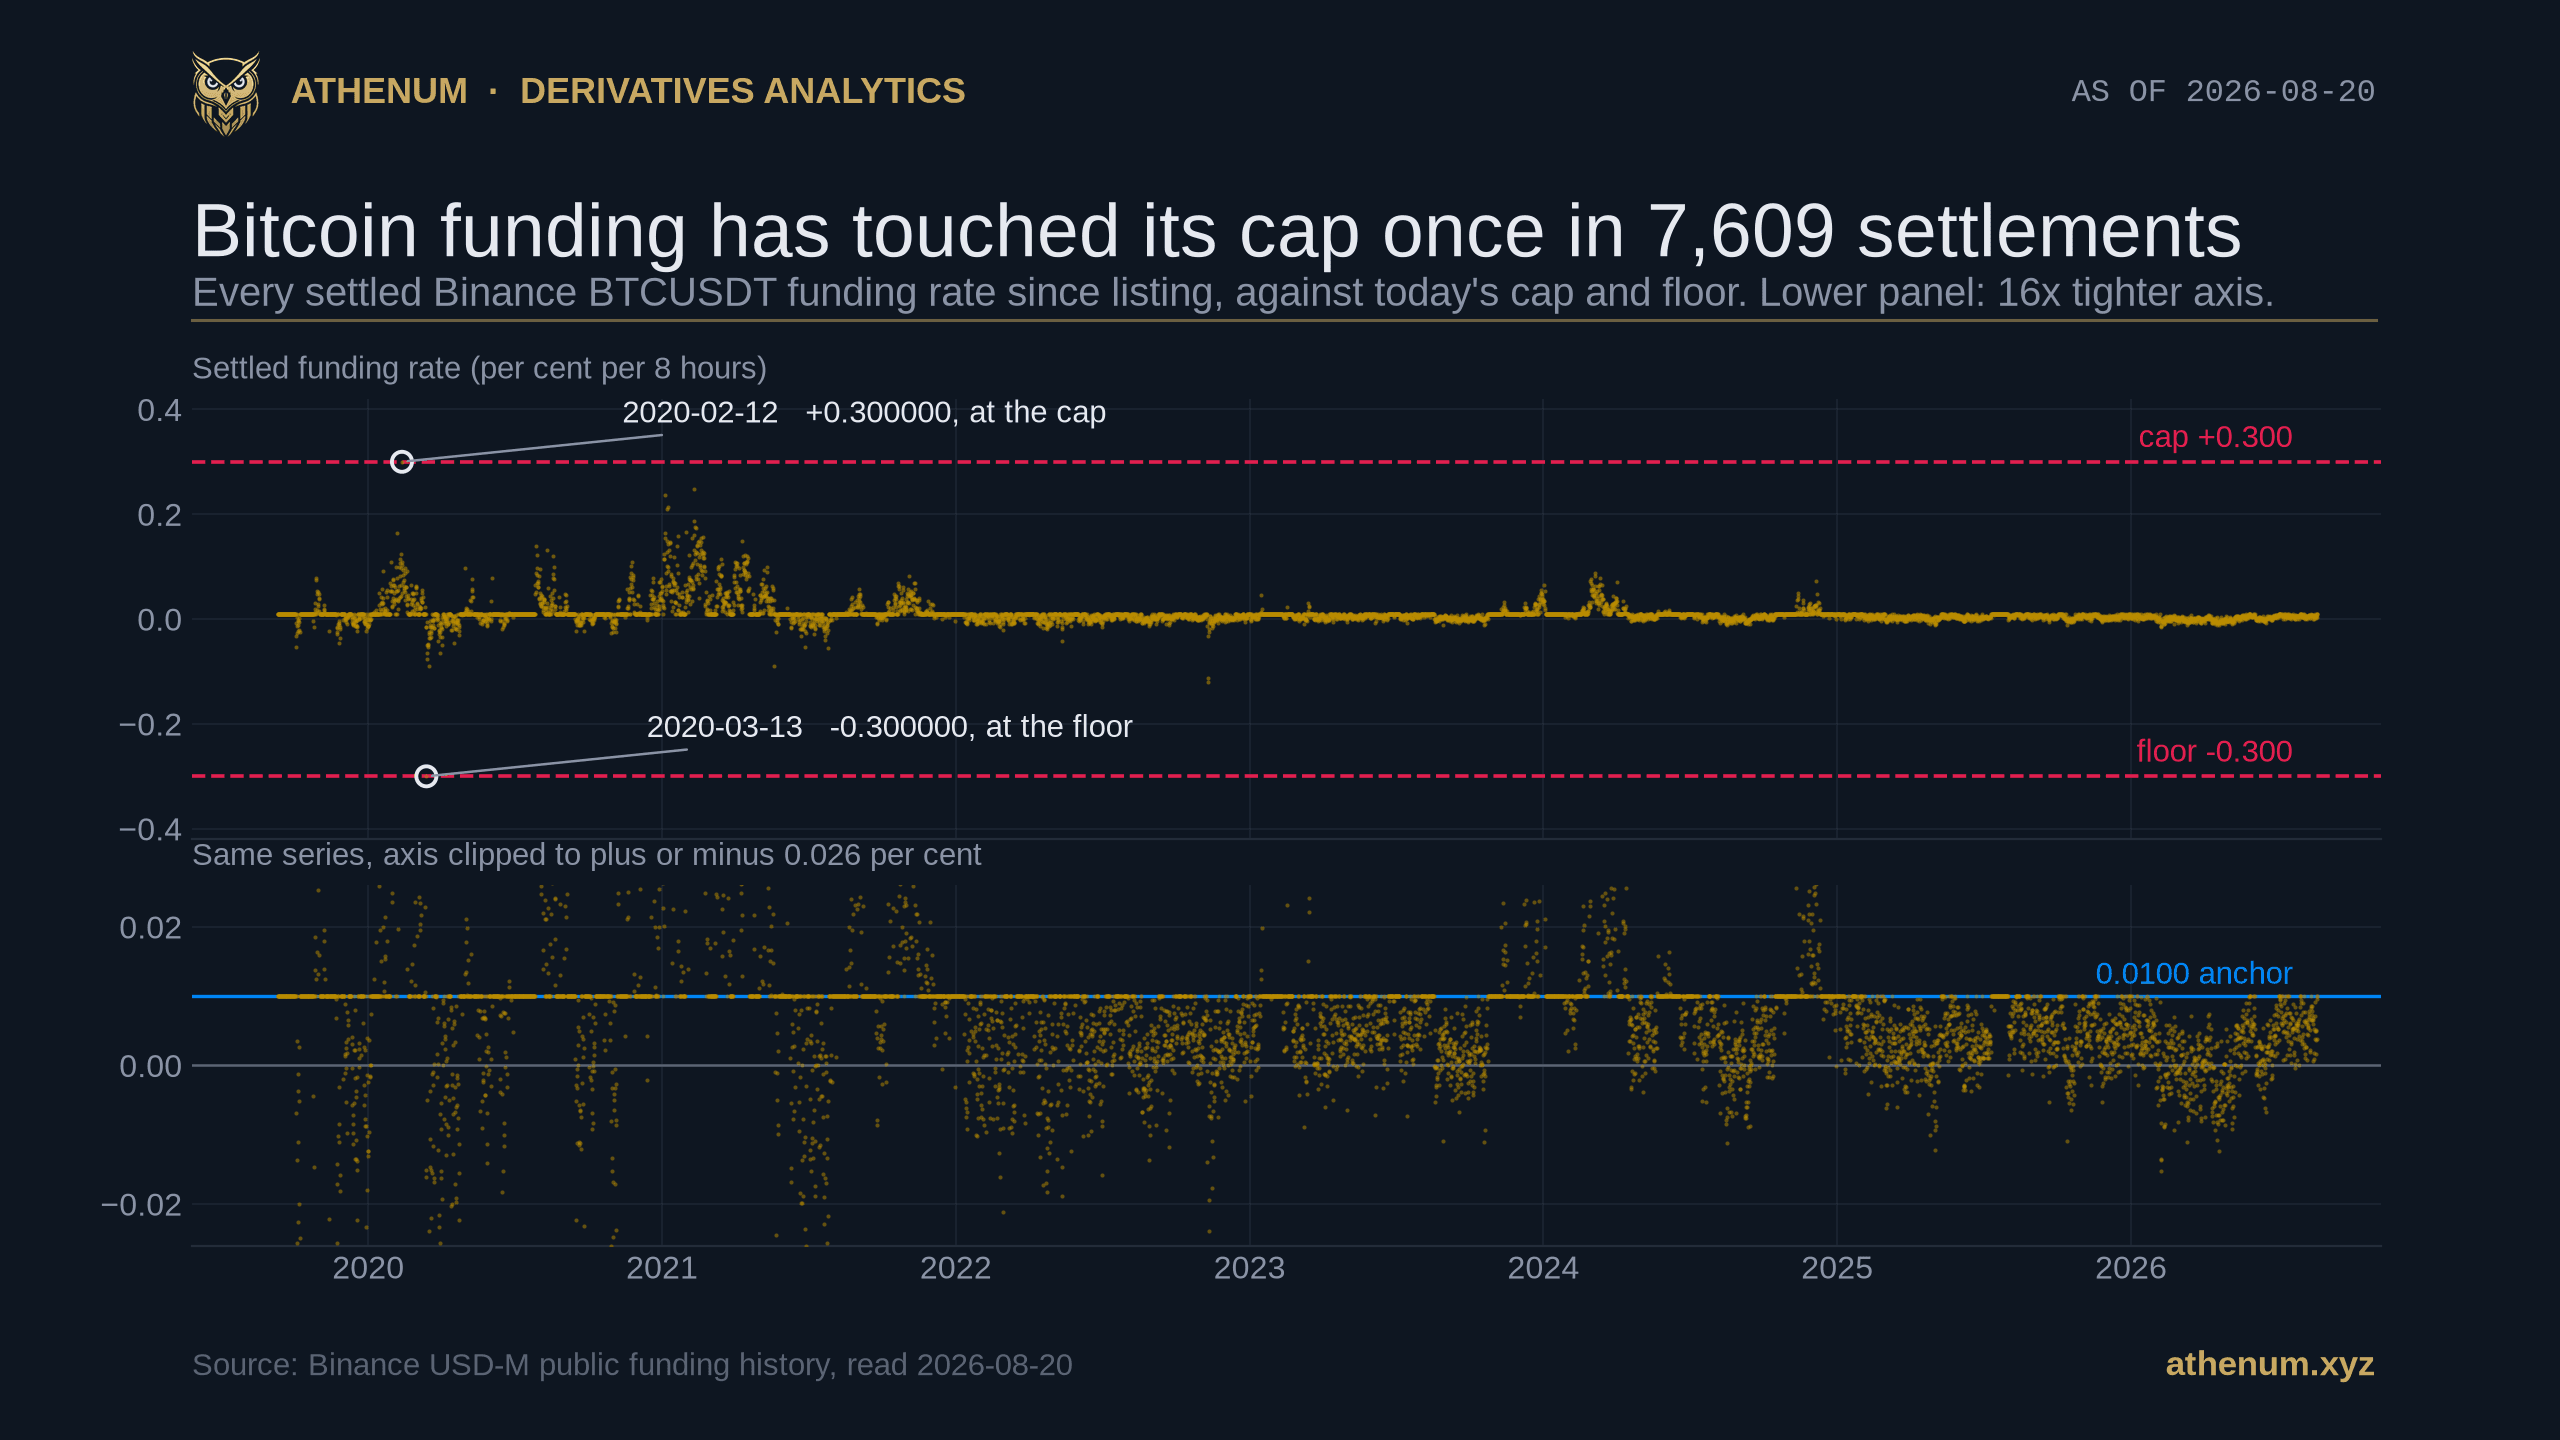
Athenum two panel scatter chart of every settled Binance BTCUSDT funding rate from September 2019 to 2026-08-20, 7,609 settlements. The upper panel plots them against dashed cap and floor lines at plus and minus 0.300 per cent per 8 hours, with a single circled point touching the cap on 2020-02-12 and a single circled point touching the floor on 2020-03-13; every other settlement sits far inside the band. The lower panel redraws the identical series on an axis clipped to plus or minus 0.026 per cent, where the 0.0100 per cent interest anchor shows up as a level the settlements stop at in 2022, 2025 and 2026 while 2023 and 2024 still print above it

Funding-Rate-Cap: einmal auf Bitcoin in sieben Jahren, im Long Tail Routine

Jedes Krypto-Perpetual veröffentlicht eine maximale Funding Rate, und fast niemand prüft, wie oft sie tatsächlich erreicht wird. Über alle 7.609 Abrechnungen des BTCUSDT-Perpetuals von Binance wurde der Cap einmal erreicht, am 2020-02-12, und der Floor einmal, am 2020-03-13. Kleinere Kontrakte erreichen ihren dutzendfach pro Jahr, und ihn zu erreichen deckelt die Rechnung nicht: Auf Binance, OKX und Bybit schaltet er den Kontrakt auf stündliche Abrechnung, was die Tagesdecke verachtfacht.

Athenum AnalyticsAthenum Analytics
20 min
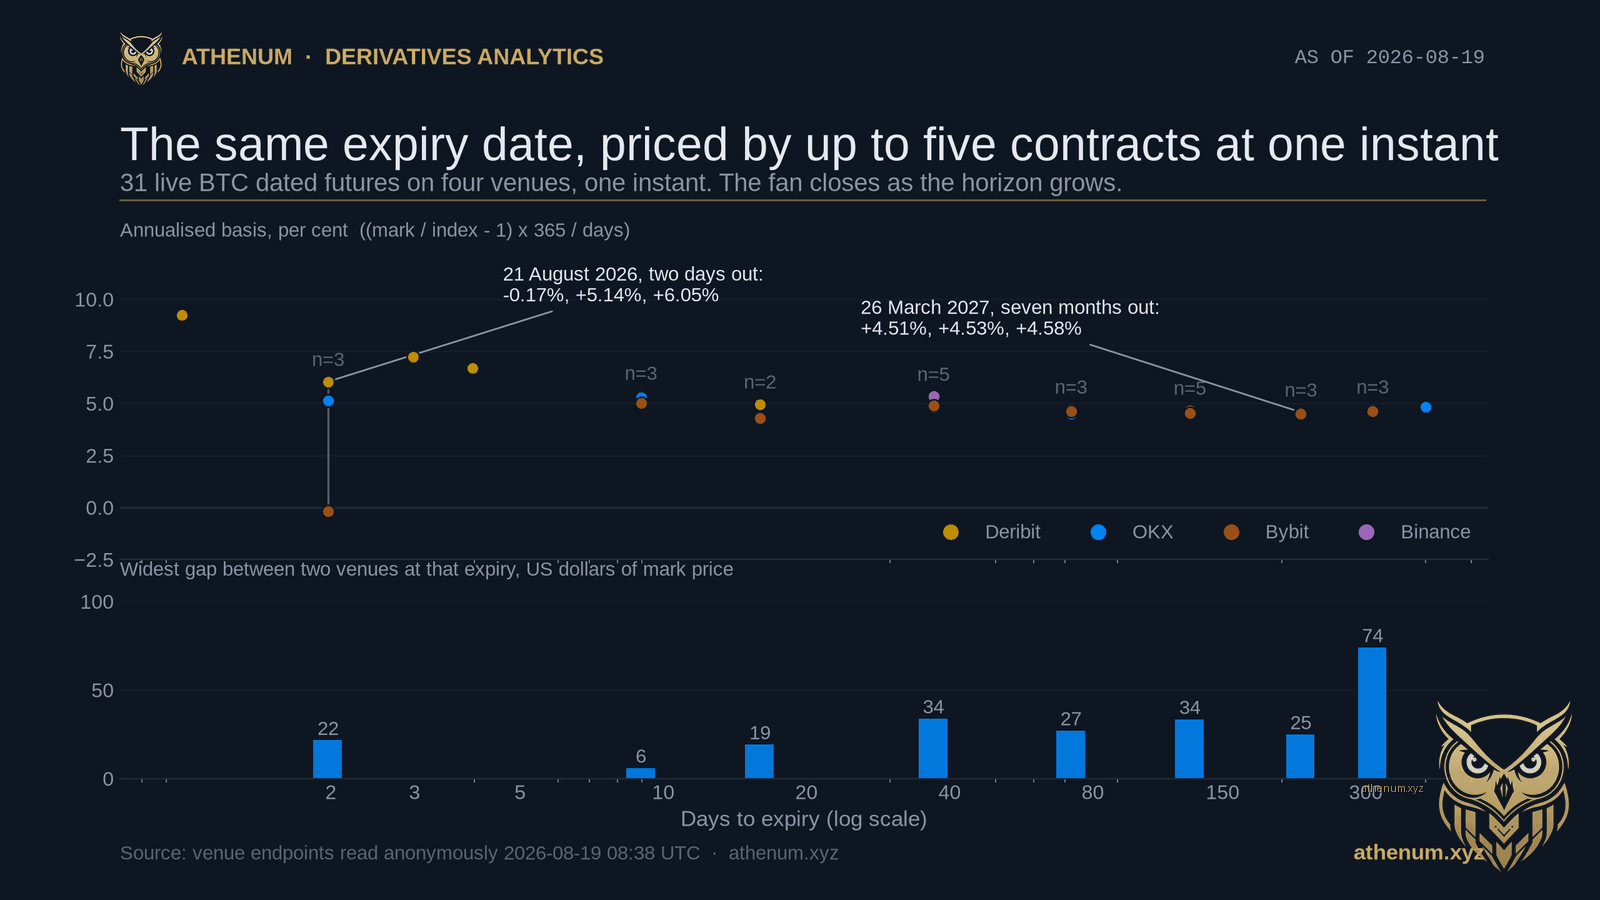
Athenum scatter chart of the annualised Bitcoin futures basis on every live dated contract at Binance, Bybit, OKX and Deribit, read 2026-08-19 08:38 UTC, plotted against days to expiry on a log scale. The 21 August 2026 expiry two days out shows three venues at -0.17, +5.14 and +6.05 per cent, while the 26 March 2027 expiry seven months out shows three venues at +4.51, +4.53 and +4.58 per cent. The lower panel shows the widest venue-to-venue gap at each expiry in US dollars of mark price, between 6 and 74 dollars across the whole curve

Bitcoin Futures Basis: 6,2 Punkte Abstand bei zwei Tagen, 0,07 bei sieben Monaten

Am 2026-08-19 um 08:38 UTC bepreisten drei Handelsplätze denselben Verfall vom 21. August 2026 mit -0,172 %, +5,141 % und +6,046 % annualisiert, eine Spanne von 6,218 Punkten. Beim Verfall 26. März 2027 lagen dieselben drei nur 0,068 Punkte auseinander. In Dollar änderte sich fast nichts, den Unterschied macht der Divisor.

Athenum AnalyticsAthenum Analytics
18 min
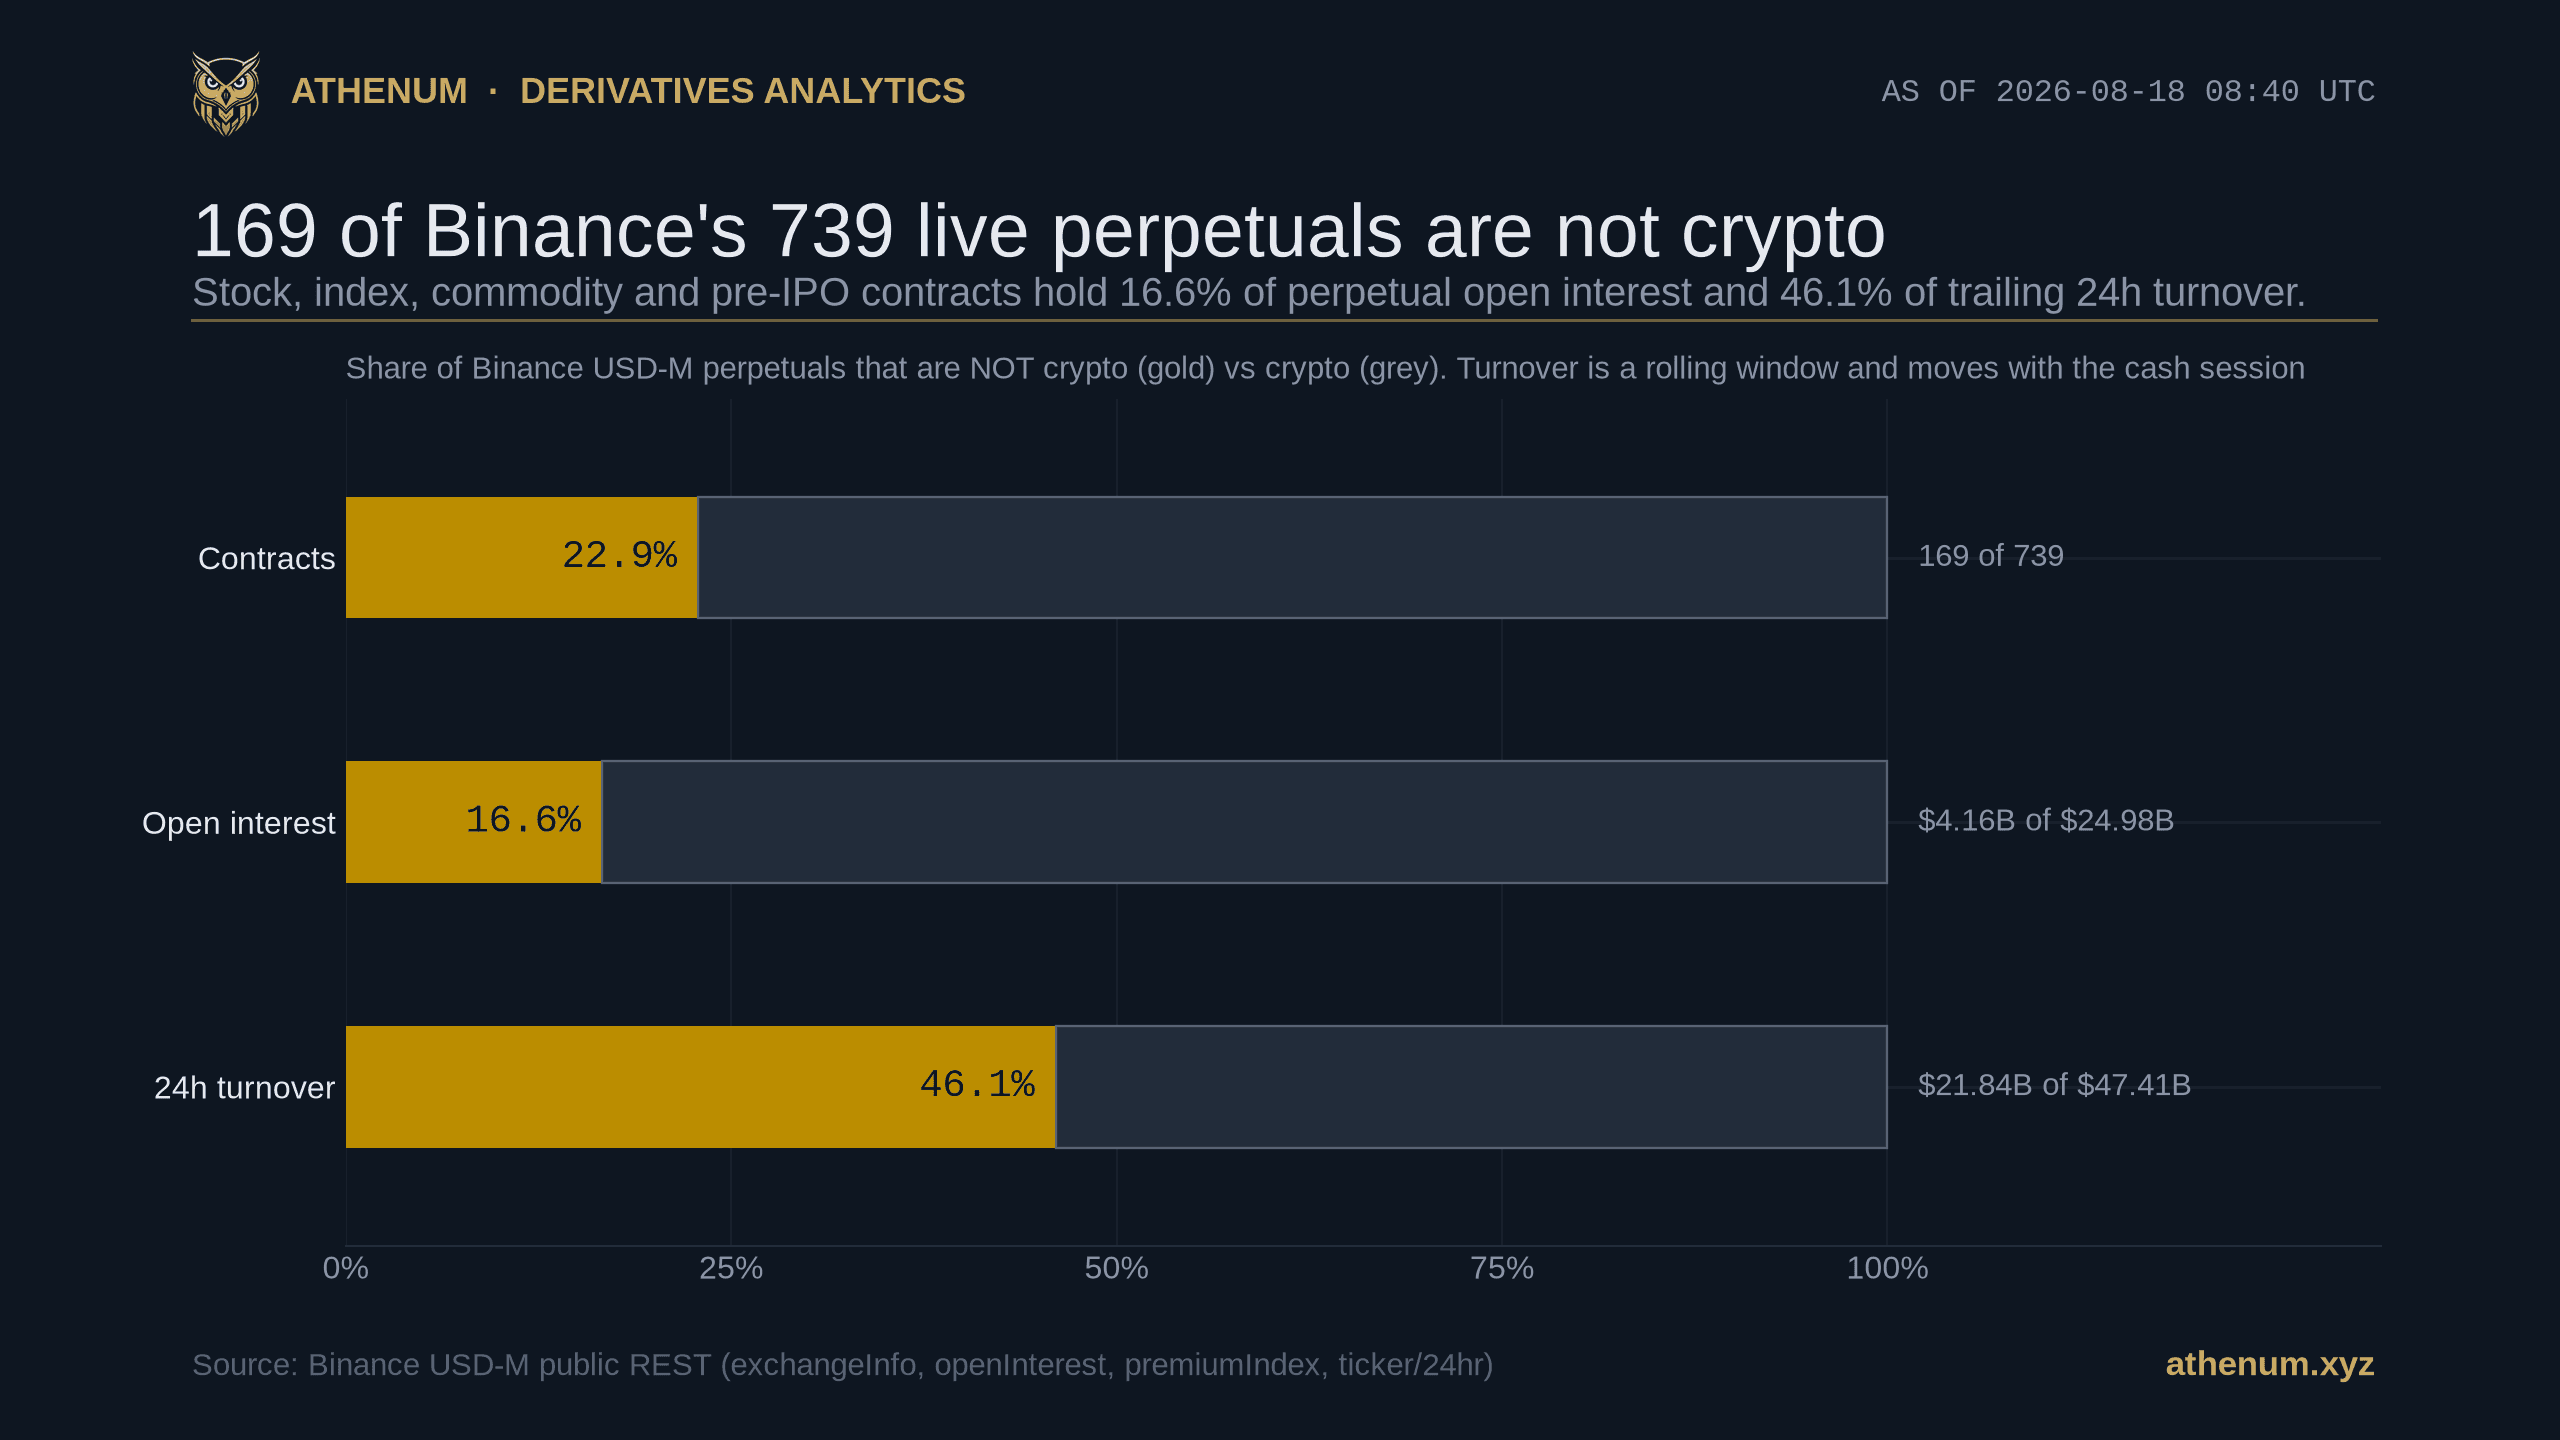
Athenum bar chart of Binance USD-M perpetuals pulled 2026-08-18, split into non-crypto and crypto contracts. Non-crypto is 22.87% by contract count at 169 of 739, and on 2026-08-18 it is 16.64% by open interest at $4.16B of $24.98B and 46.07% by trailing 24 hour turnover at $21.84B of $47.41B

Aktien-Perpetuals handelten 821 Mio. USD an einem geschlossenen Samstag. Der Median bewegte sich 0,09 %.

Das USD-M-Futures-Board von Binance ist nicht mehr nur Krypto. Gezählt am 2026-08-18 08:40 UTC bilden 169 seiner 739 aktiven Perpetual-Kontrakte etwas anderes ab: 138 US-Aktien, 12 Hongkong-Werte, 8 koreanische, 8 Rohstoffe, 1 festlandchinesischer Wert und 2 Pre-IPO-Unternehmen.

Athenum AnalyticsAthenum Analytics
27 min
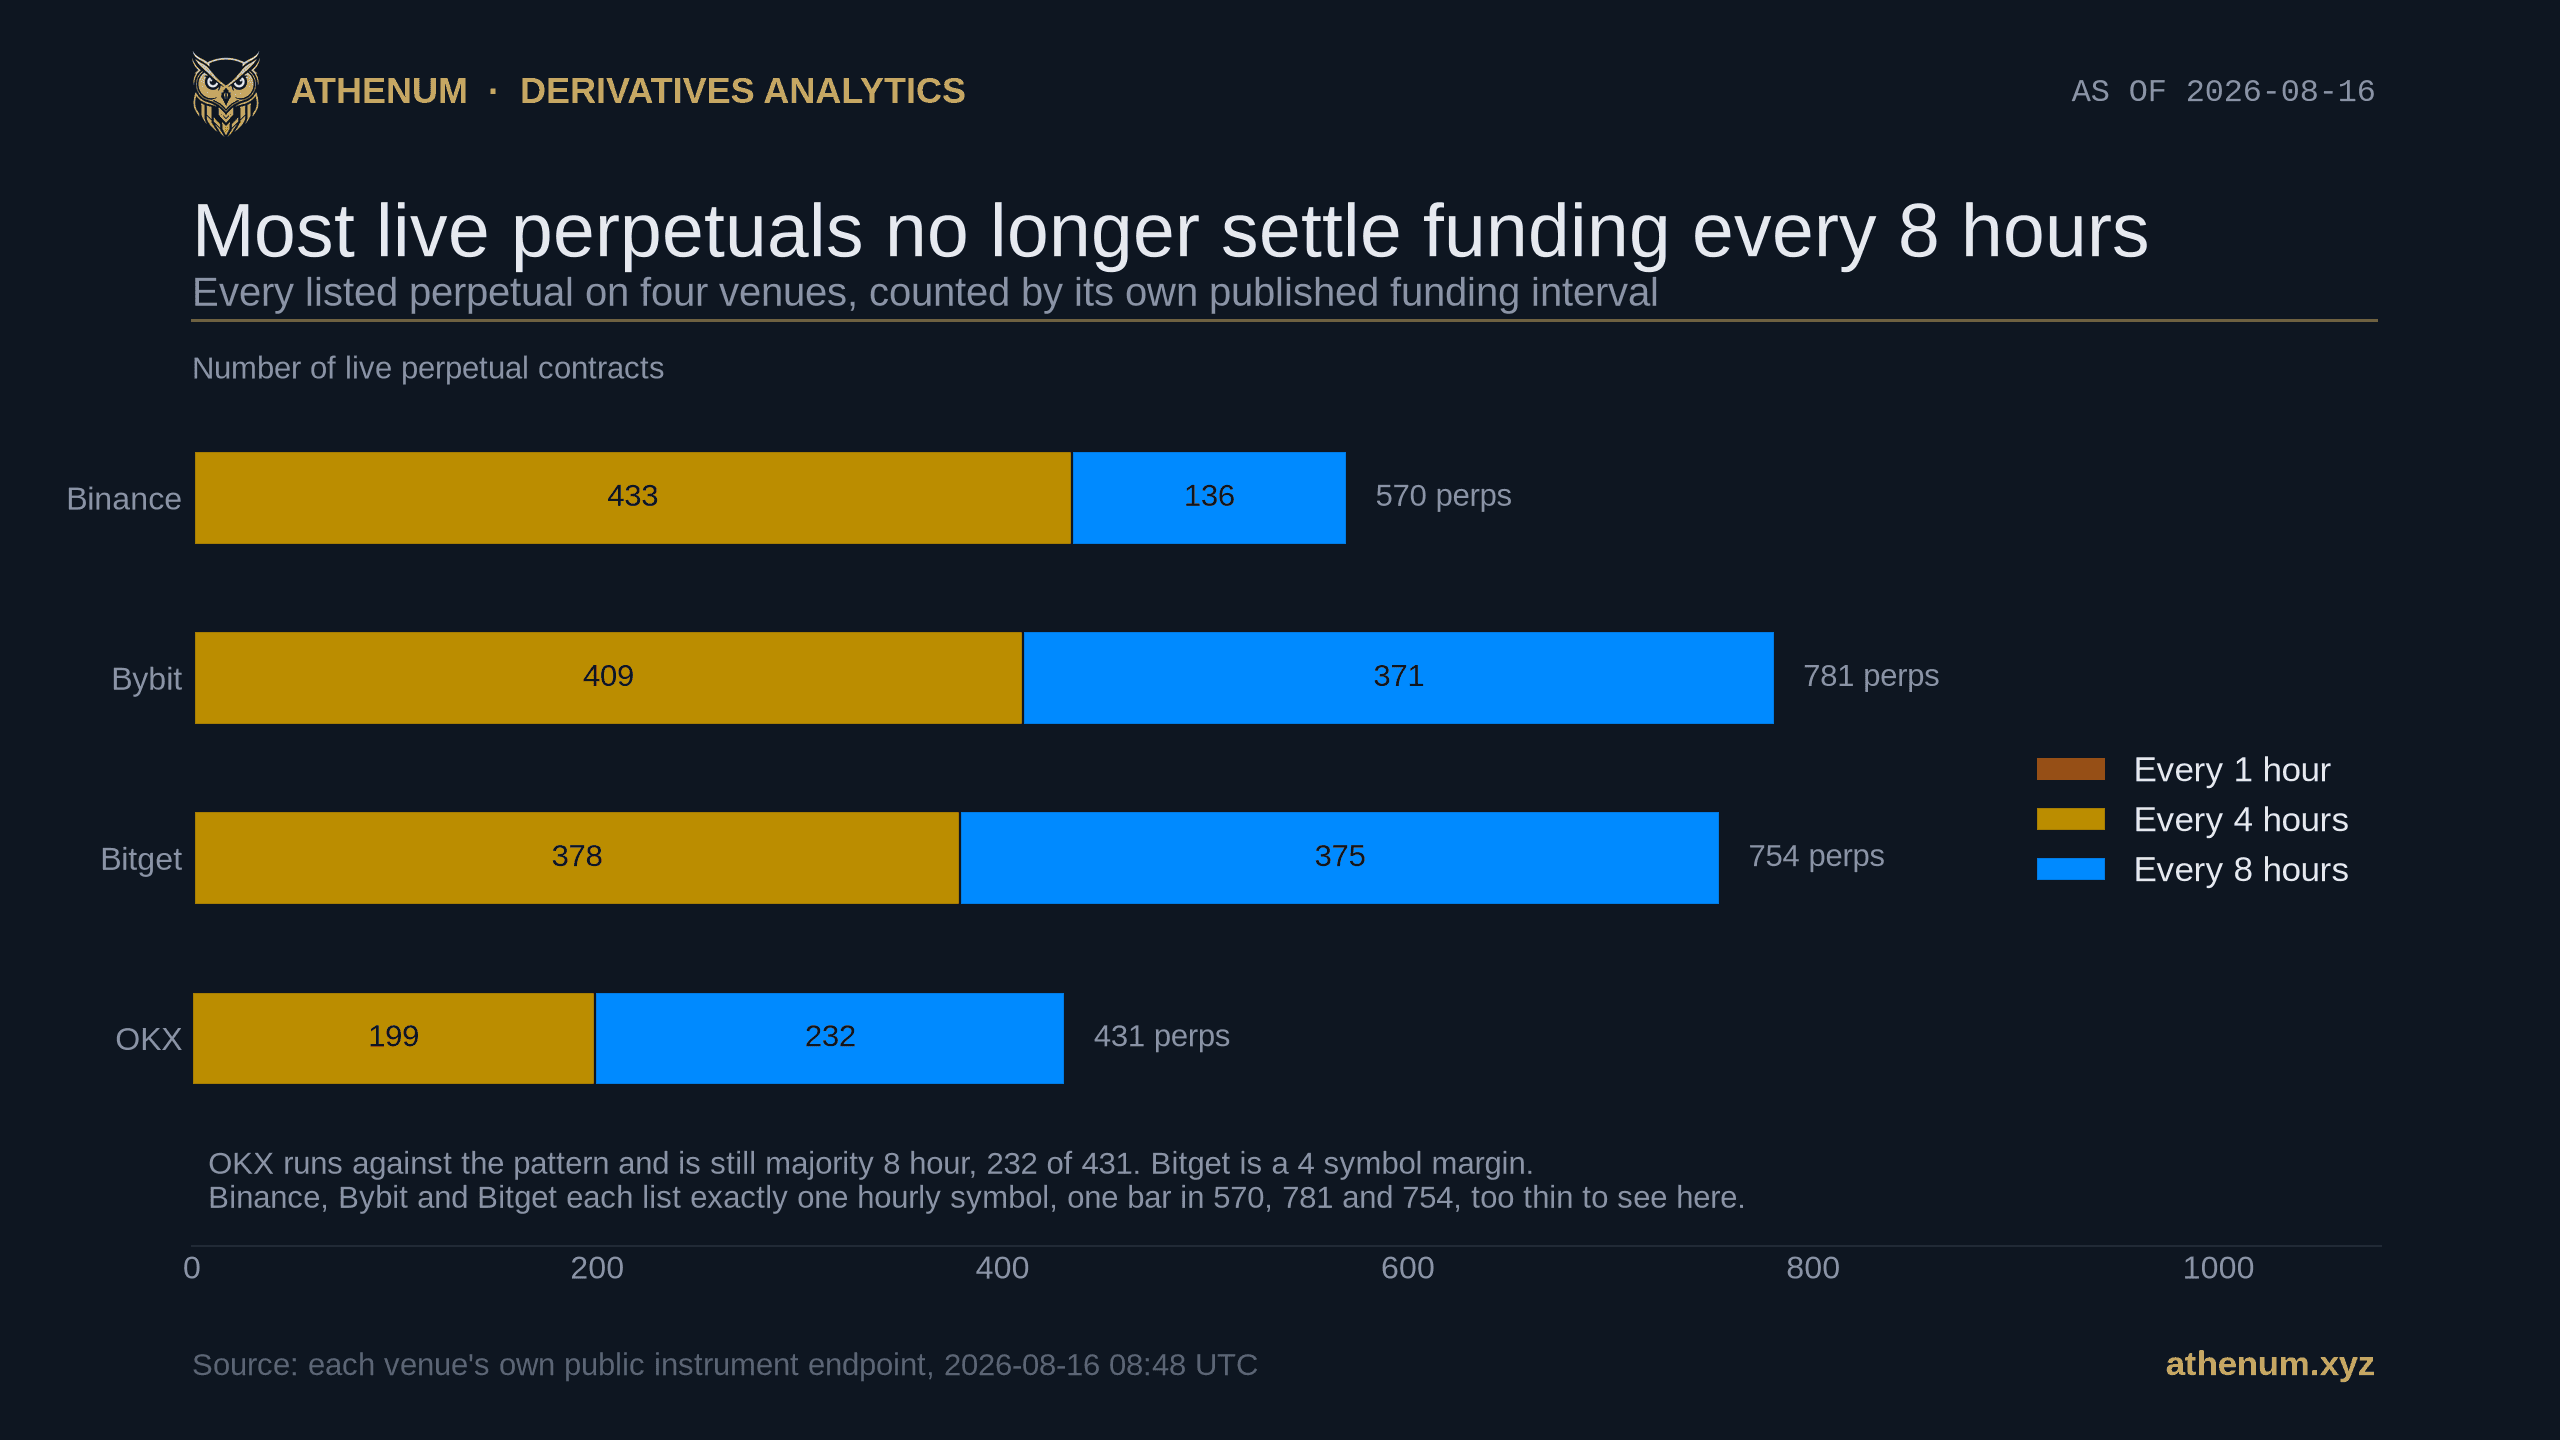
Athenum stacked bar chart of every live crypto perpetual on four venues on 2026-08-16, split by funding interval. Binance shows 433 symbols on a 4 hour interval, 136 on 8 hours and 1 on 1 hour, 570 in total. Bybit shows 409 on 4 hours, 371 on 8 hours and 1 on 1 hour, 781 in total. Bitget shows 378 on 4 hours, 375 on 8 hours and 1 on 1 hour, 754 in total. OKX shows 199 on 4 hours and 232 on 8 hours, 431 in total

Funding-Intervalle gelten pro Symbol: 1.422 von 2.536 Krypto-Perps außerhalb des 8-Stunden-Takts

Das Funding-Intervall ist der Takt, in dem ein Perpetual Funding berechnet, und die meisten Anleitungen behandeln es als Eigenschaft der Börse. Am 2026-08-16 08:48 UTC rechnen 1.422 von 2.536 live gelisteten Krypto-Perpetuals auf vier Handelsplätzen nicht im 8-Stunden-Takt ab, und 342 von Binances 570 wiesen dieselben Tageskosten in zwei verschiedenen Zahlen aus.

Athenum AnalyticsAthenum Analytics
17 min
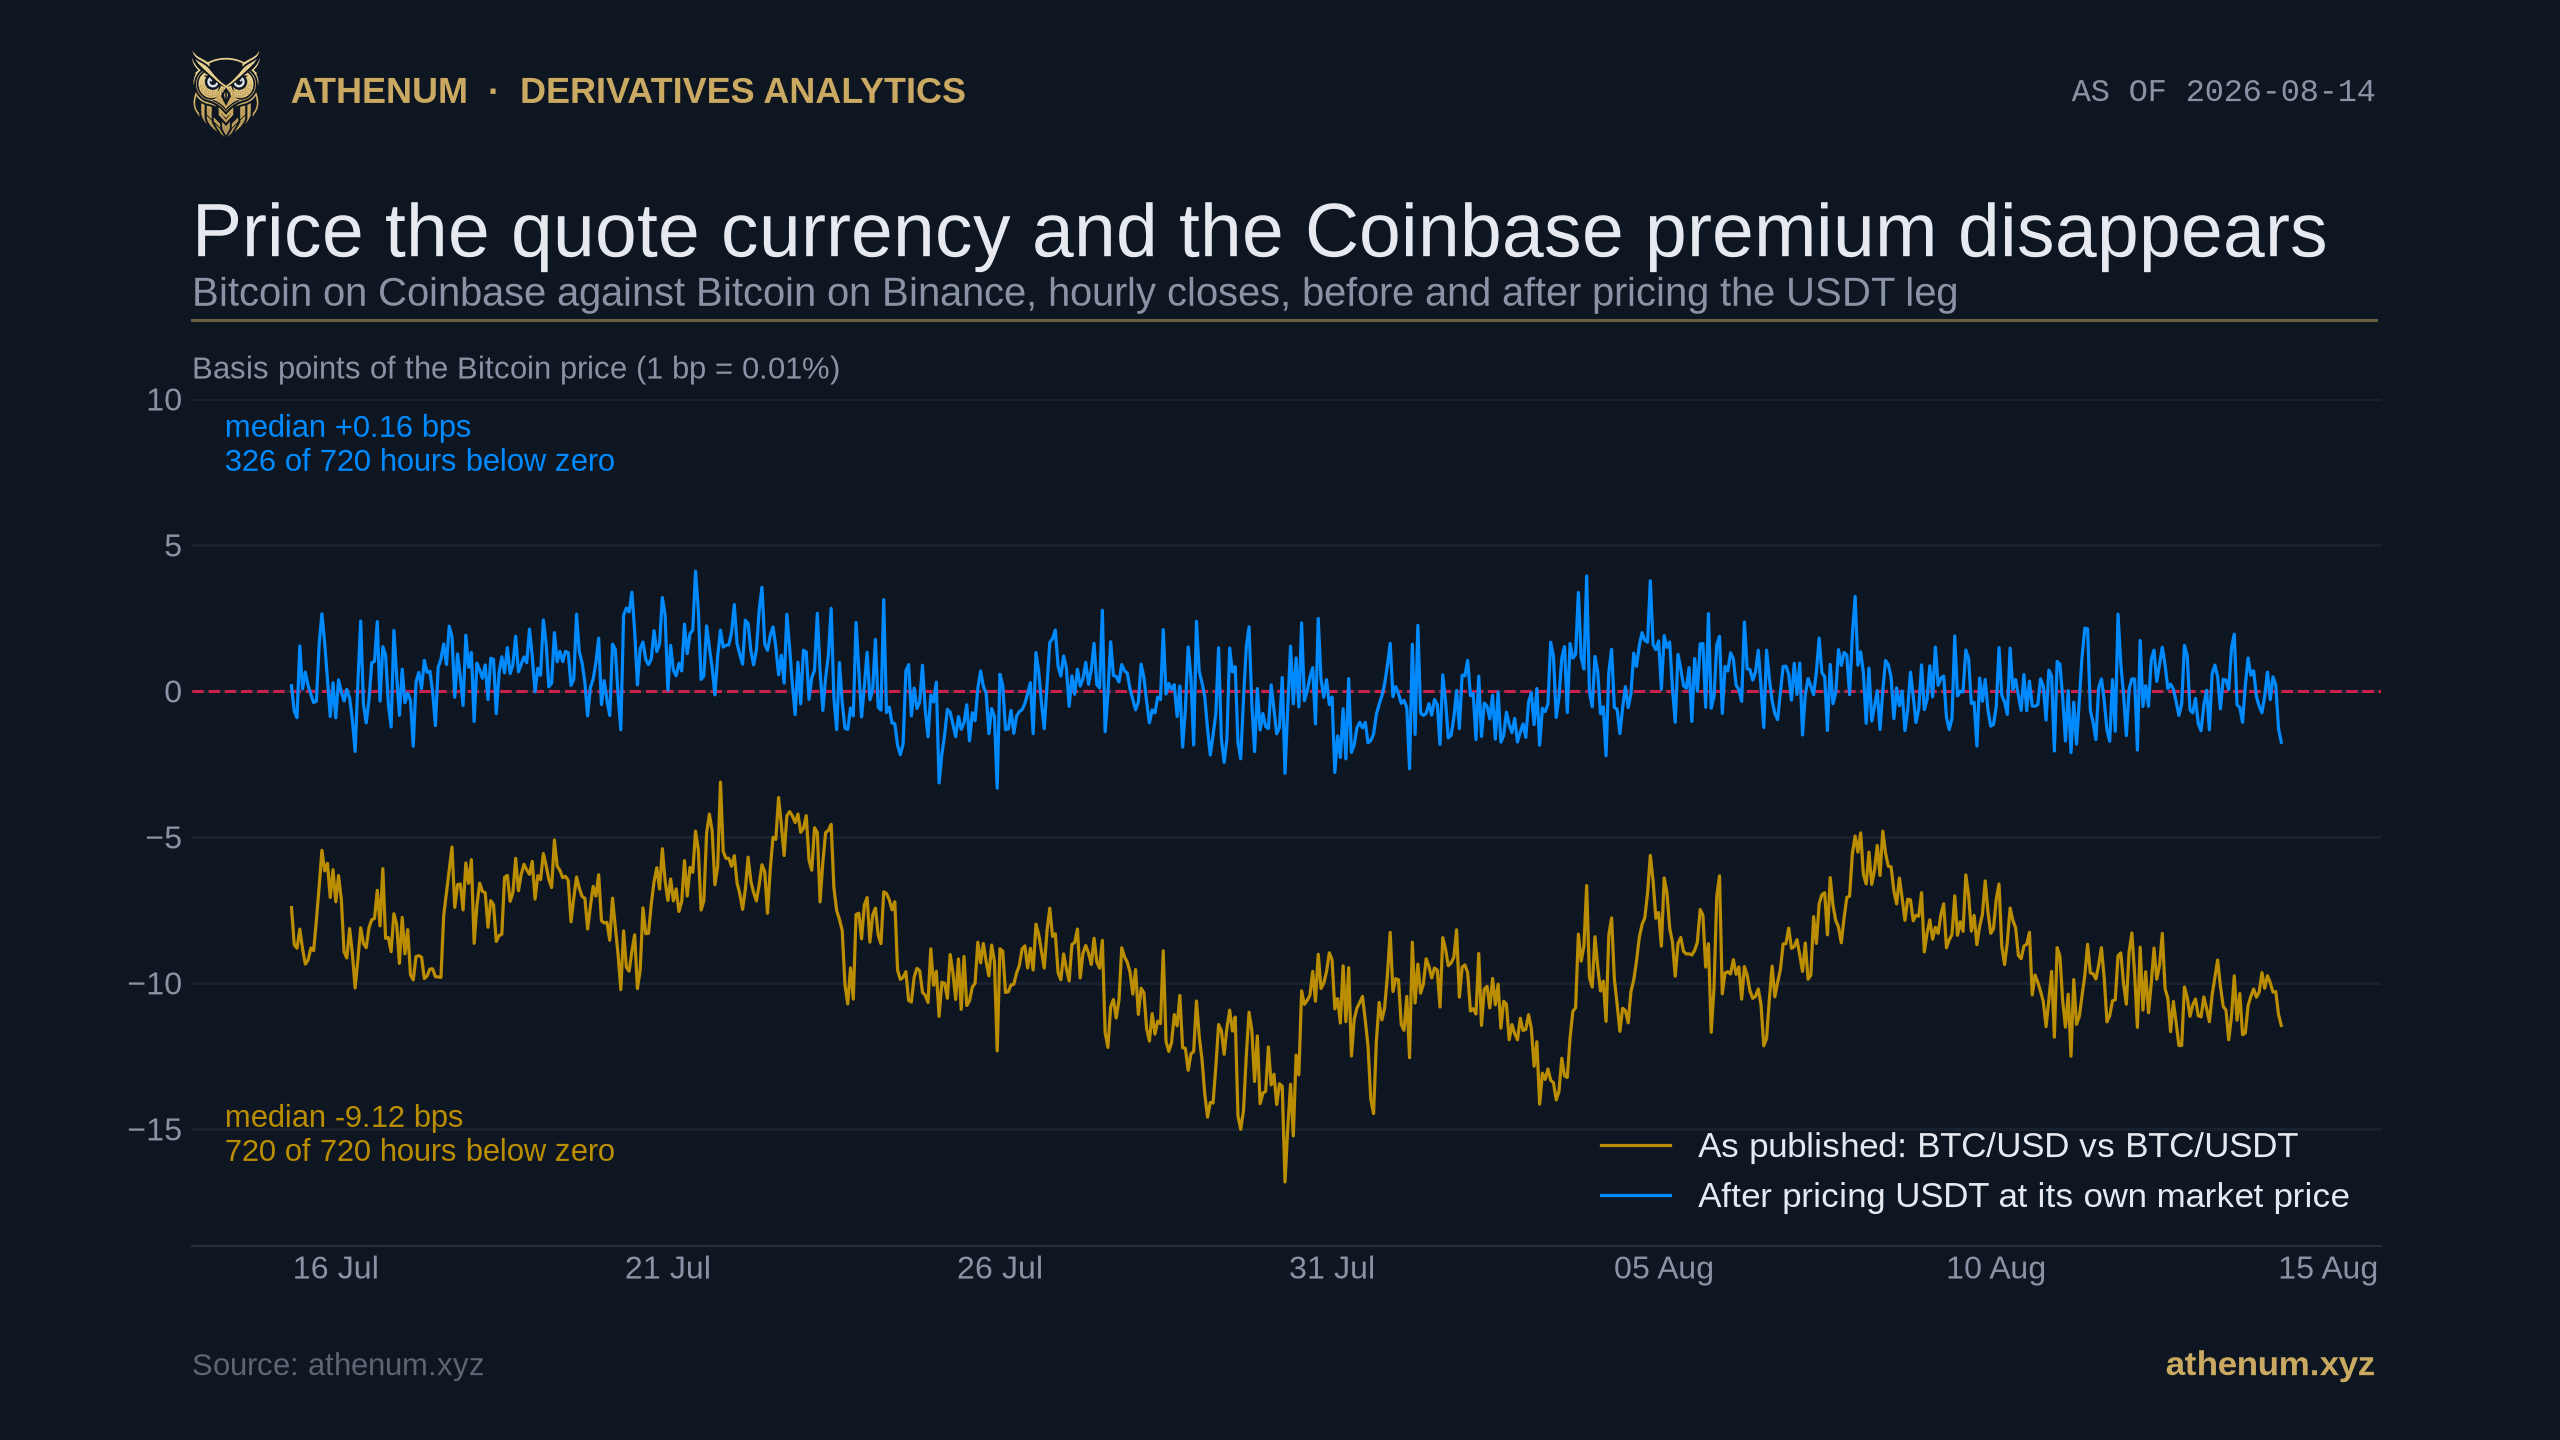
Athenum line chart of the Coinbase premium over 720 hourly closes from 15 July to 14 August 2026, with a dashed red line at zero. The gold line, labelled as published, runs entirely below zero in a band between about minus 3 and minus 17 basis points with a median of minus 9.12. The blue line, labelled after pricing USDT at its own market price, oscillates tightly around zero between about minus 3.3 and plus 4.1 with a median of plus 0.16

Coinbase-Premium oder Tether-Abschlag? 720 Stunden

Das Coinbase-Premium war in allen 720 Stunden bis 2026-08-14 07:00 UTC negativ, im Median minus 9,12 Basispunkte. In denselben Stunden schloss USDT nie auf oder über einem Dollar: Median 0,99908 auf Coinbase, 0,99903 auf Kraken. Bepreist man die Notierungswährung, wandert der Median auf plus 0,16 Basispunkte, und 394 der 720 Stunden wechseln das Vorzeichen. Was als US-Verkaufsdruck gelesen wird, war überwiegend der Preis von Tether.

Athenum AnalyticsAthenum Analytics
16 min
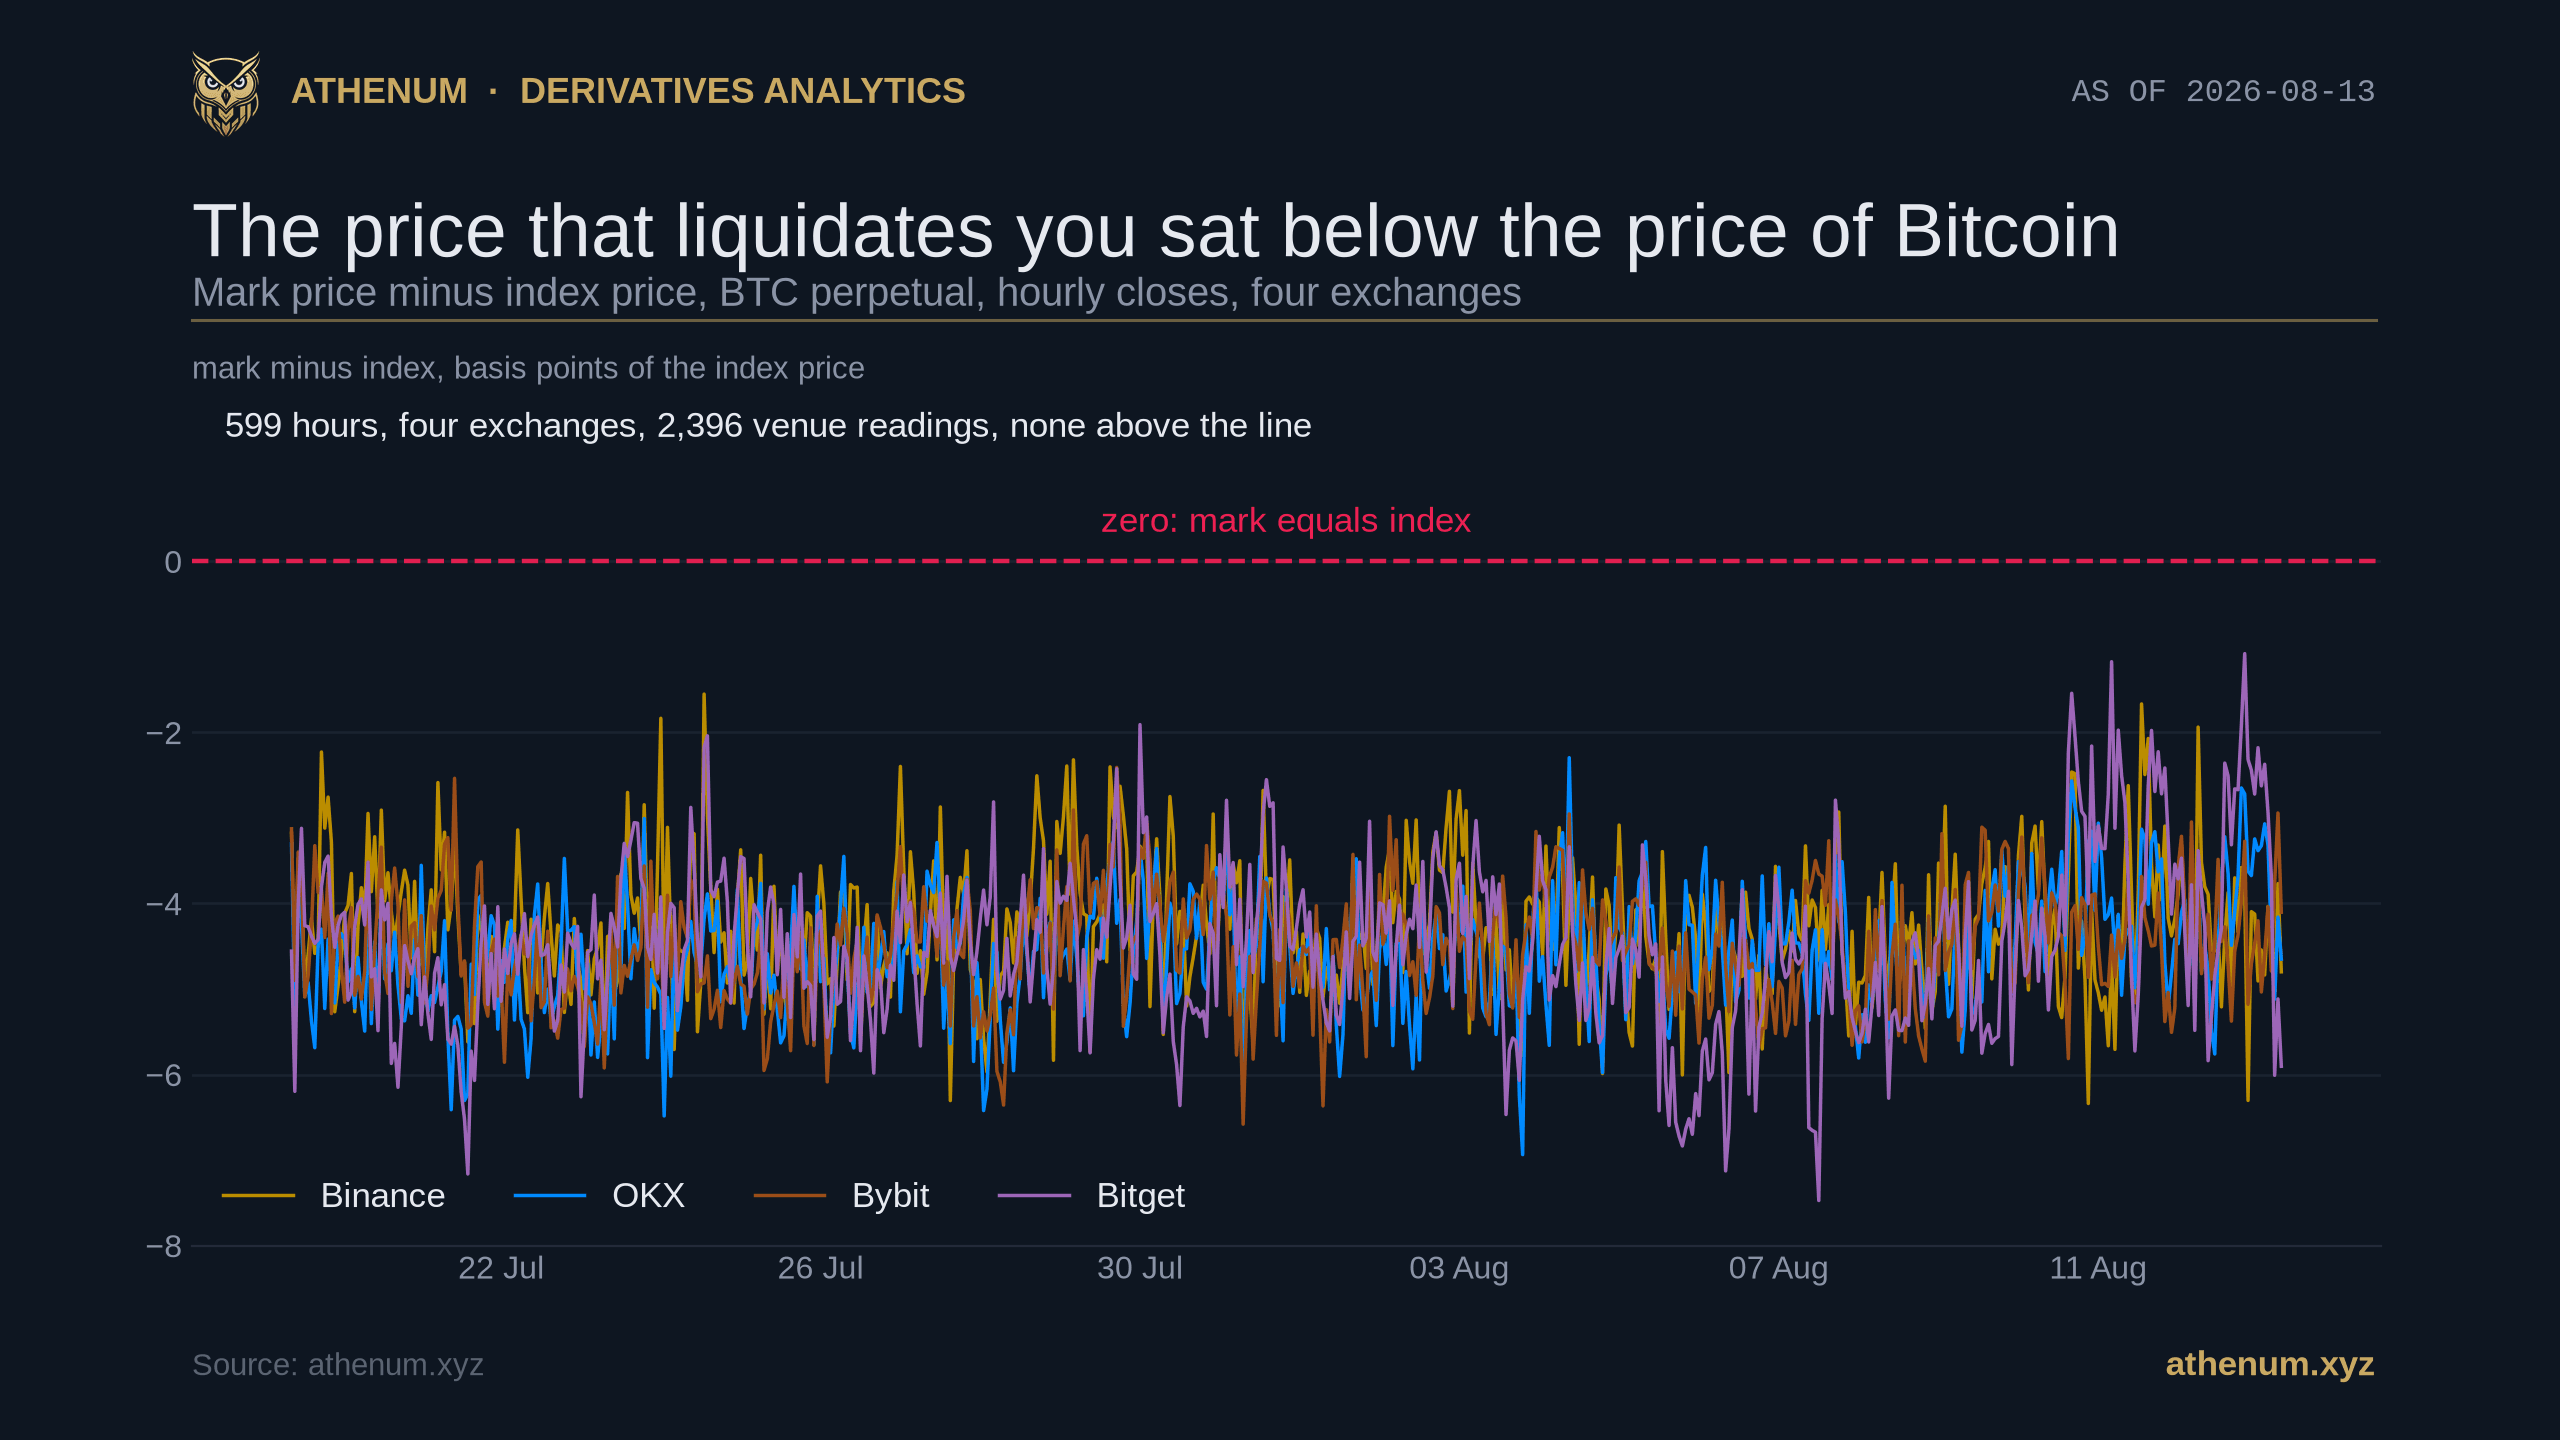
Athenum chart plotting mark price minus index price in basis points for the Bitcoin perpetual on Binance, OKX, Bybit and Bitget across 599 hourly closes from 19 July to 13 August 2026, with a dashed red line at zero: all four lines run in a band between about minus 1 and minus 7.5 basis points for the entire window and none of them touches the zero line at any point

Bitcoin-Perpetual unter Spot: 599 Stunden, und Longs zahlten trotzdem

Eine gehebelte Position wird nicht zu dem Preis geschlossen, der auf dem Spot-Chart steht, und bei Bitcoin-Perpetuals hatte dieser Unterschied fünfundzwanzig Tage lang dasselbe Vorzeichen. Über die 599 Stundenschlusskurse bis 2026-08-13 07:00 UTC lag der Mark-Preis bei Binance, OKX, Bybit und Bitget in jeder Stunde unter dem eigenen Spot-Index der Börse, 2.396 Ablesungen ohne eine Ausnahme, und das Funding blieb trotzdem positiv. Hier sind die Messung, der veröffentlichte Mechanismus dahinter und was sich dadurch am Liquidationspreis ändert.

Athenum AnalyticsAthenum Analytics
22 min
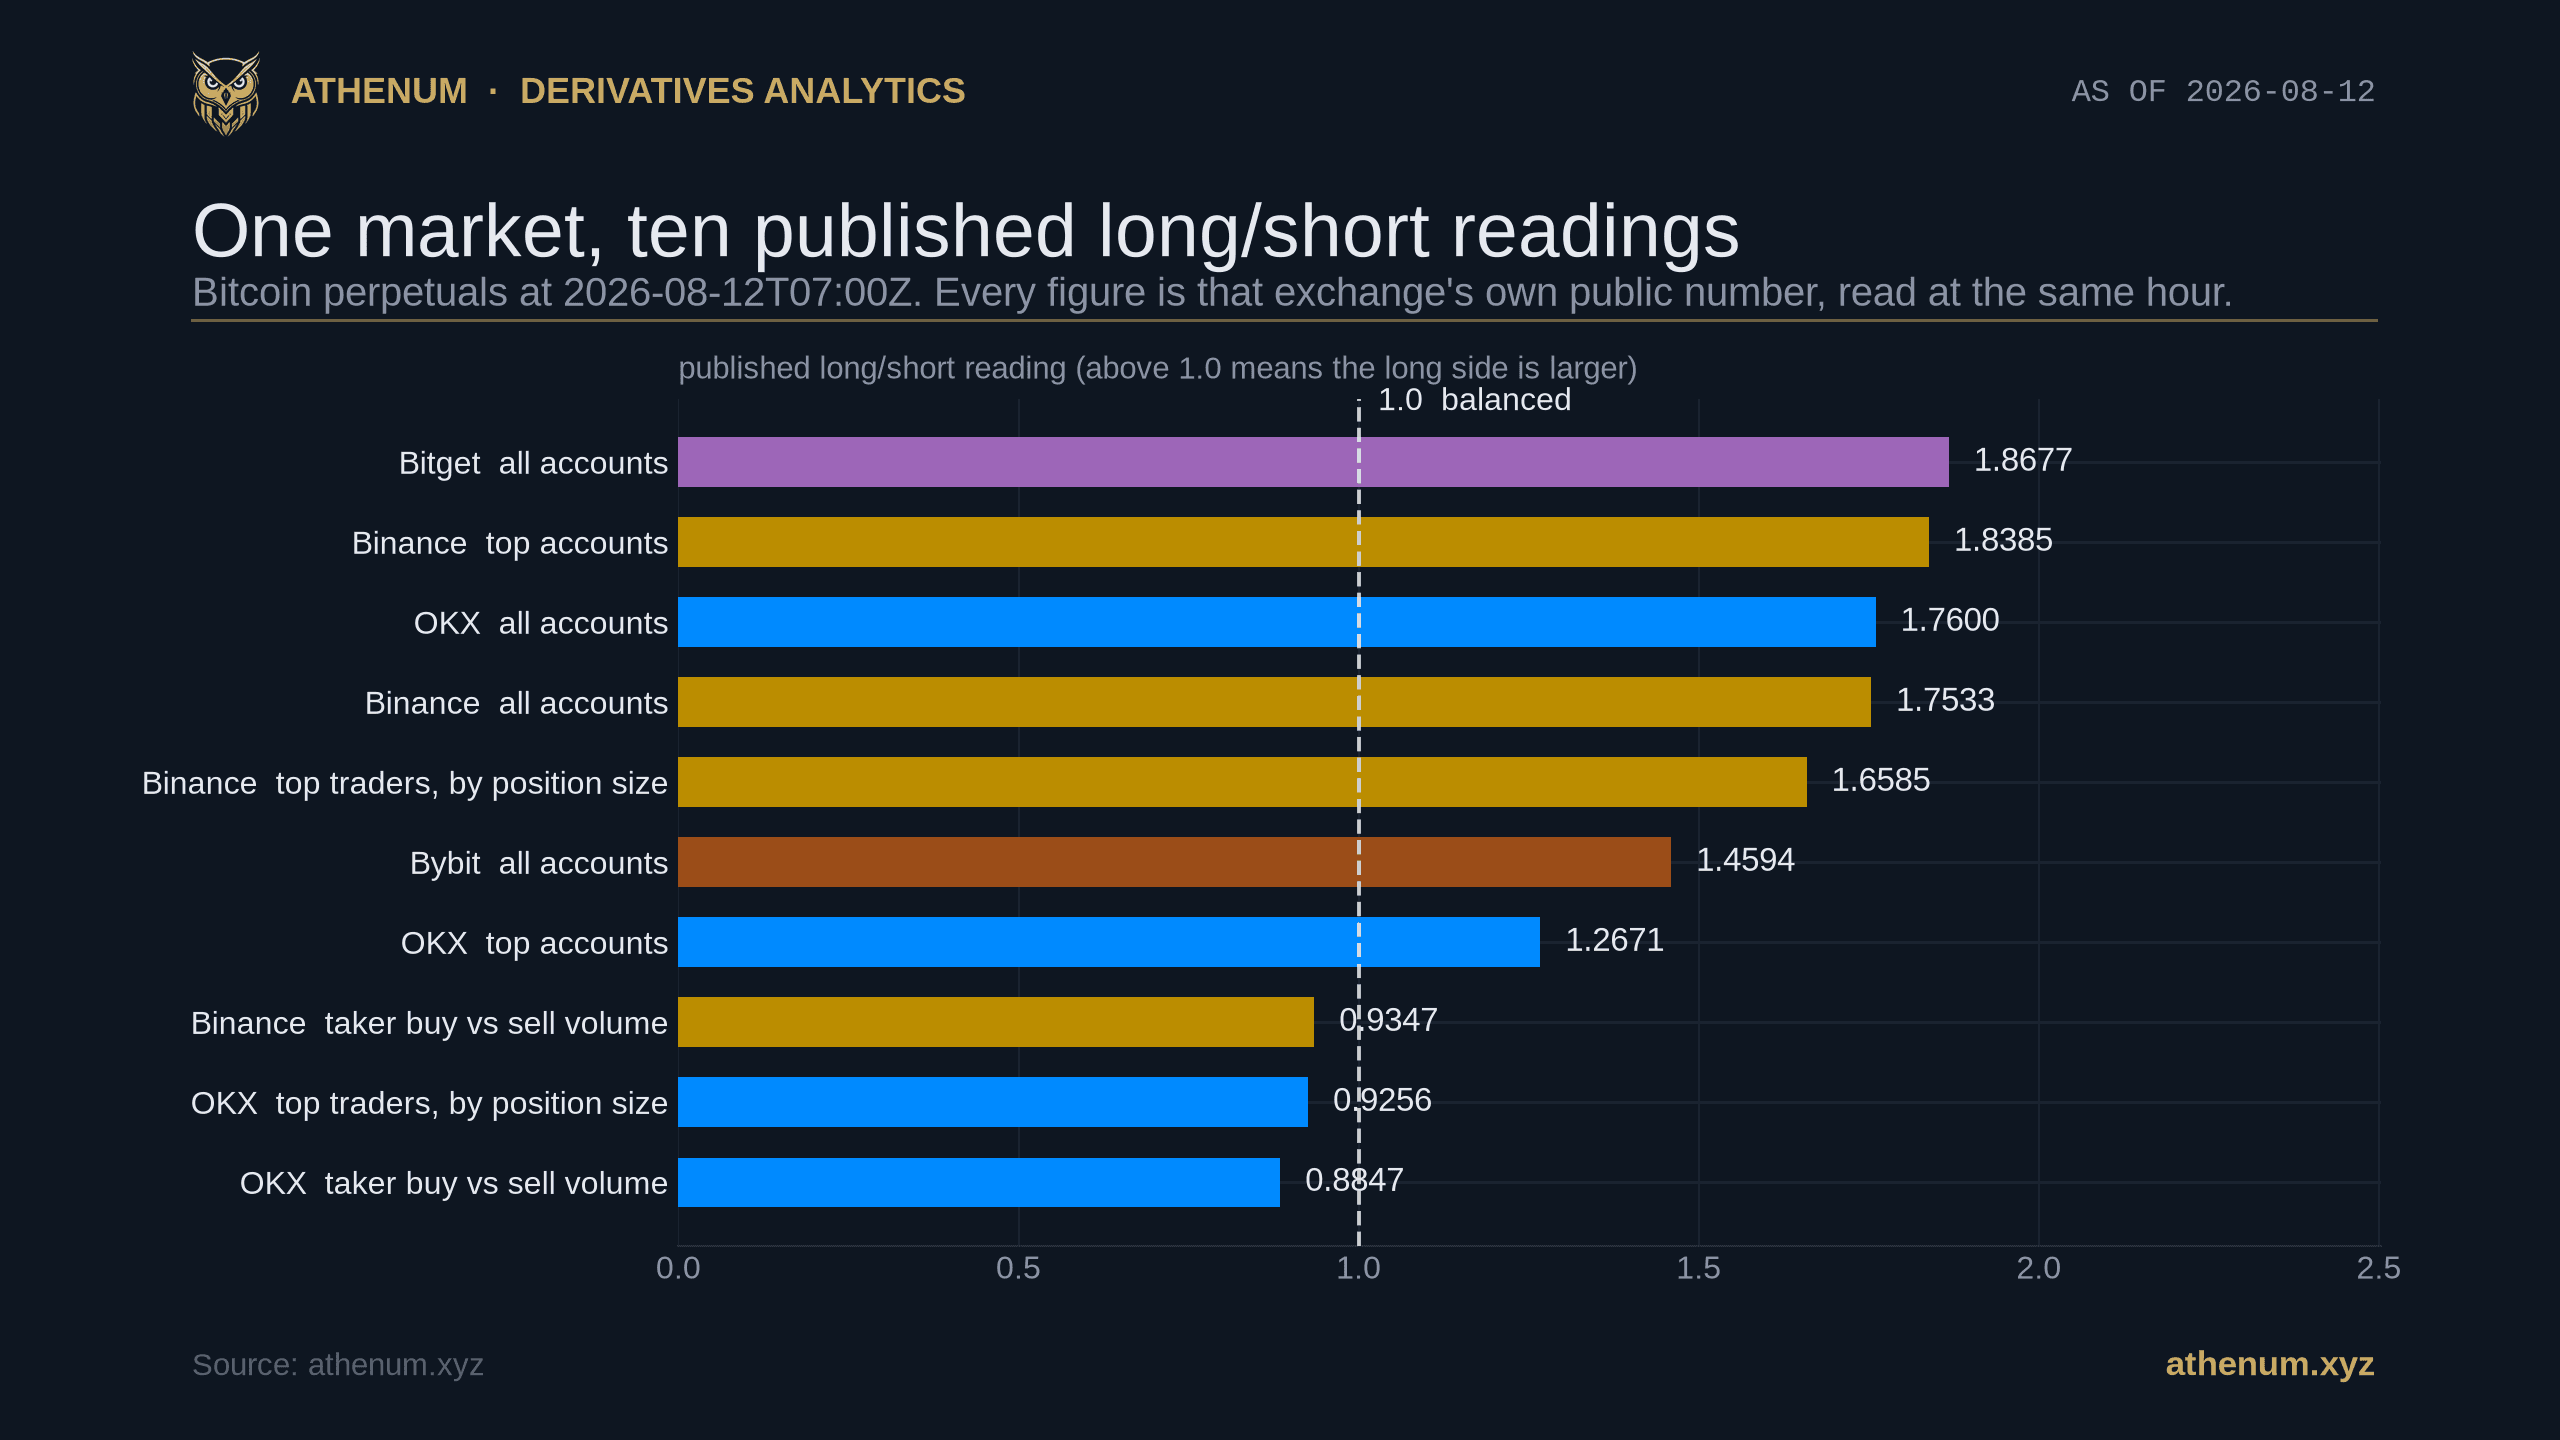
Athenum chart comparing the ten long/short readings published for Bitcoin perpetuals at 2026-08-12 07:00 UTC as horizontal bars against a dashed line at 1.0: Bitget all accounts 1.8677, Binance top accounts 1.8385, OKX all accounts 1.7600, Binance all accounts 1.7533, Binance top traders by position size 1.6585, Bybit all accounts 1.4594, OKX top accounts 1.2671, Binance taker buy versus sell volume 0.9347, OKX top traders by position size 0.9256, and OKX taker buy versus sell volume 0.8847, with the bottom three bars ending left of the 1.0 line

Bitcoin Long/Short-Verhältnis: Zehn veröffentlichte Zahlen, ein Markt

Das Bitcoin Long/Short-Verhältnis ist keine einzelne Zahl. Für die Stunde bis 2026-08-12 07:00 UTC haben Binance, OKX, Bybit und Bitget zehn Werte für denselben Perpetual-Markt veröffentlicht, von 0,8847 bis 1,8677, und drei davon lagen unter der 1,0, die einen long-lastigen Markt von einem short-lastigen trennen soll. Hier steht, was diese Zahlen wirklich trennt und was der eine Wert, der ein Preis und keine Kopfzahl ist, klärt und was nicht.

Athenum AnalyticsAthenum Analytics
15 min
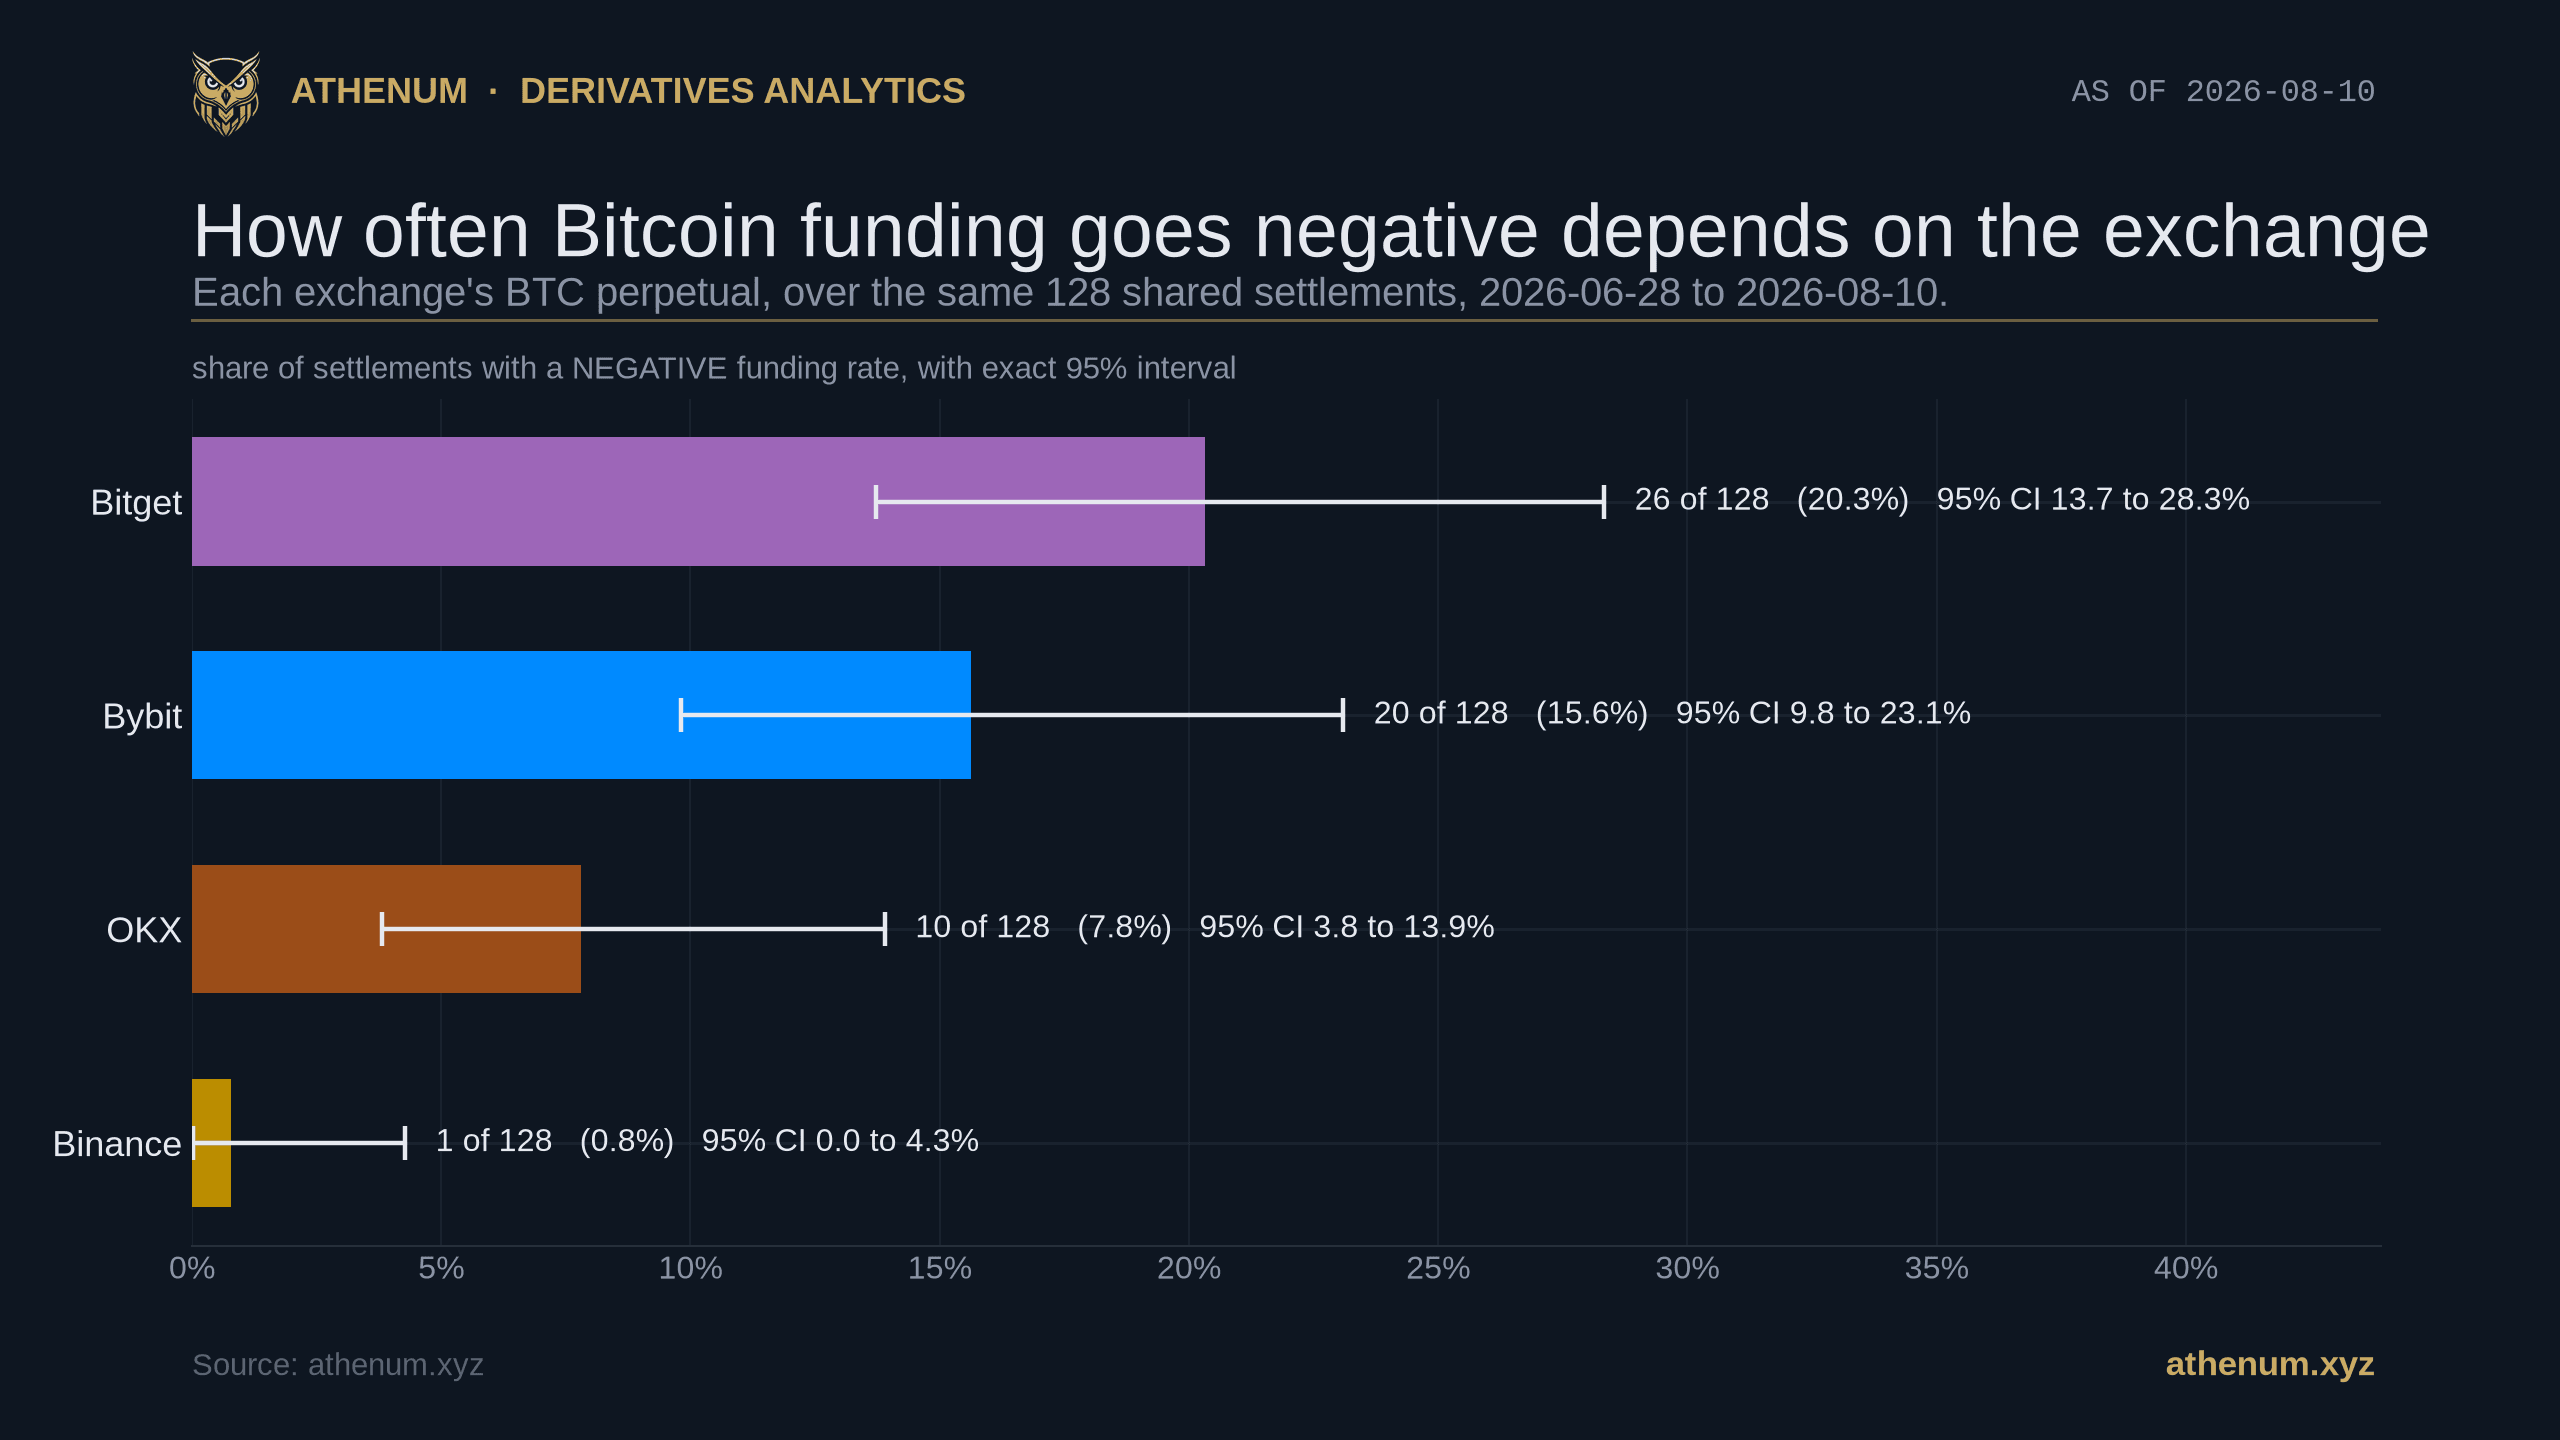
Athenum chart ranking the share of settlements at which each exchange paid a negative funding rate on its Bitcoin perpetual, across the same 128 shared eight hour settlements from 2026-06-28 to 2026-08-10: Binance 1 of 128 or 0.8 percent, OKX 10 of 128 or 7.8 percent, Bybit 20 of 128 or 15.6 percent, and Bitget 26 of 128 or 20.3 percent, each bar carrying an exact 95 percent binomial interval drawn as a whisker, 0.0 to 4.3 percent for Binance, 3.8 to 13.9 for OKX, 9.8 to 23.1 for Bybit and 13.7 to 28.3 for Bitget, so the overlap between the middle two is visible

Negative Finanzierungsrate bei Bitcoin: Eine Börse wies sie einmal aus, eine andere 26 Mal

Eine negative Finanzierungsrate ist das meistzitierte Sentiment-Signal im Krypto-Derivatemarkt, und sie wird fast immer von einer einzigen Börse zitiert, als beschriebe sie den gesamten Markt. Wie oft man eine zu sehen bekommt, hängt enorm davon ab, welche Börse man gerade liest.

Athenum AnalyticsAthenum Analytics
18 min
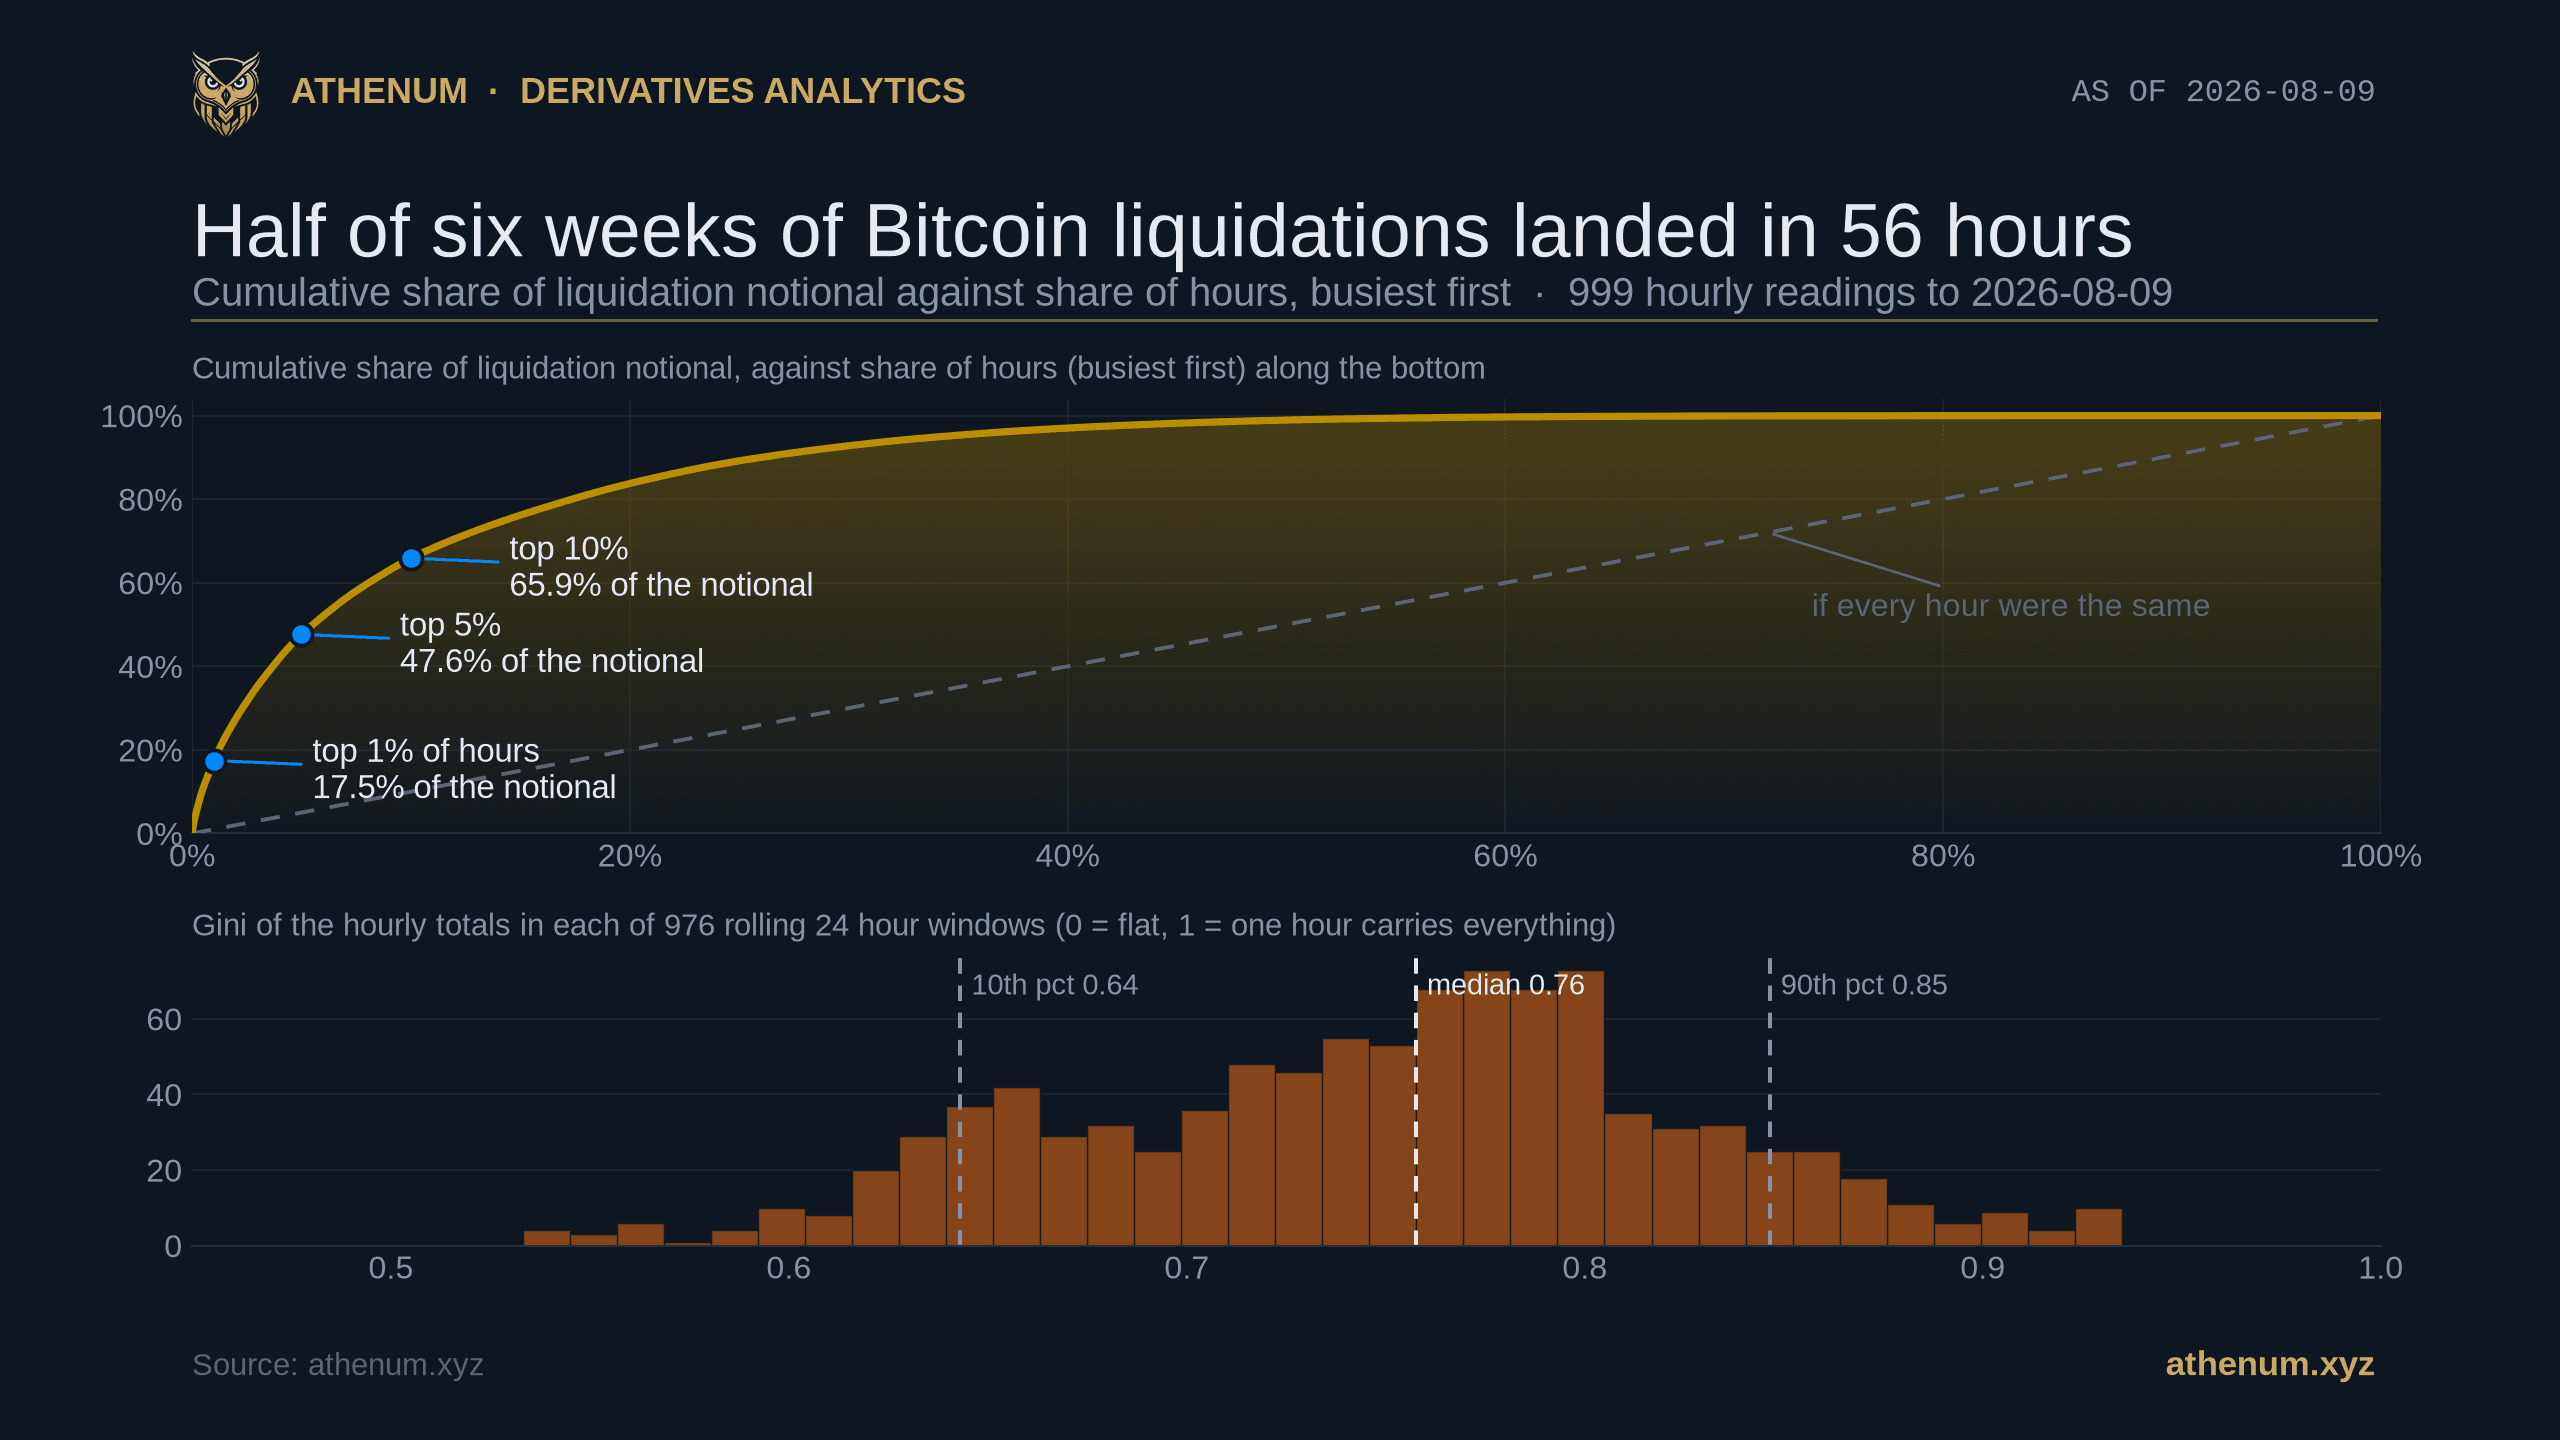
Athenum chart showing the cumulative share of Bitcoin perpetual liquidation notional against the share of hours, ranked busiest first, over 999 completed hourly readings to 2026-08-09: the busiest 1% of hours carry 17.5% of the notional, the busiest 5% carry 47.6% and the busiest 10% carry 65.9%, far above the straight diagonal an even distribution would trace, with a lower panel histogram of the Gini coefficient measured inside each of 976 rolling 24 hour windows showing a 10th percentile of 0.64, a median of 0.76 and a 90th percentile of 0.85

Bitcoin Liquidationen nach Stunde: die Haelfte von sechs Wochen fiel in 56 Stunden

Ueber 999 abgeschlossene Stundenwerte aus Athenums aggregiertem Feed fuer Bitcoin Perpetual Liquidationen entfiel die Haelfte des Nominalvolumens auf 56 Stunden und ein Viertel davon auf 18 Stunden. Auf das aktivste 1 % der Stunden entfielen 17,5 %, auf die aktivsten 10 % 65,9 %, und die Medianstunde lag bei 113.170 $ gegenueber einem Mittelwert von 925.105 $. Fast jede Stunde laeuft nur in eine Richtung: die Medianstunde legte 96,9 % ihres Nominalvolumens auf eine einzige Seite, waehrend das gesamte Panel mit 47,1 % Long gegen 52,9 % Short nahezu ausgeglichen wirkt.

Athenum AnalyticsAthenum Analytics
17 min
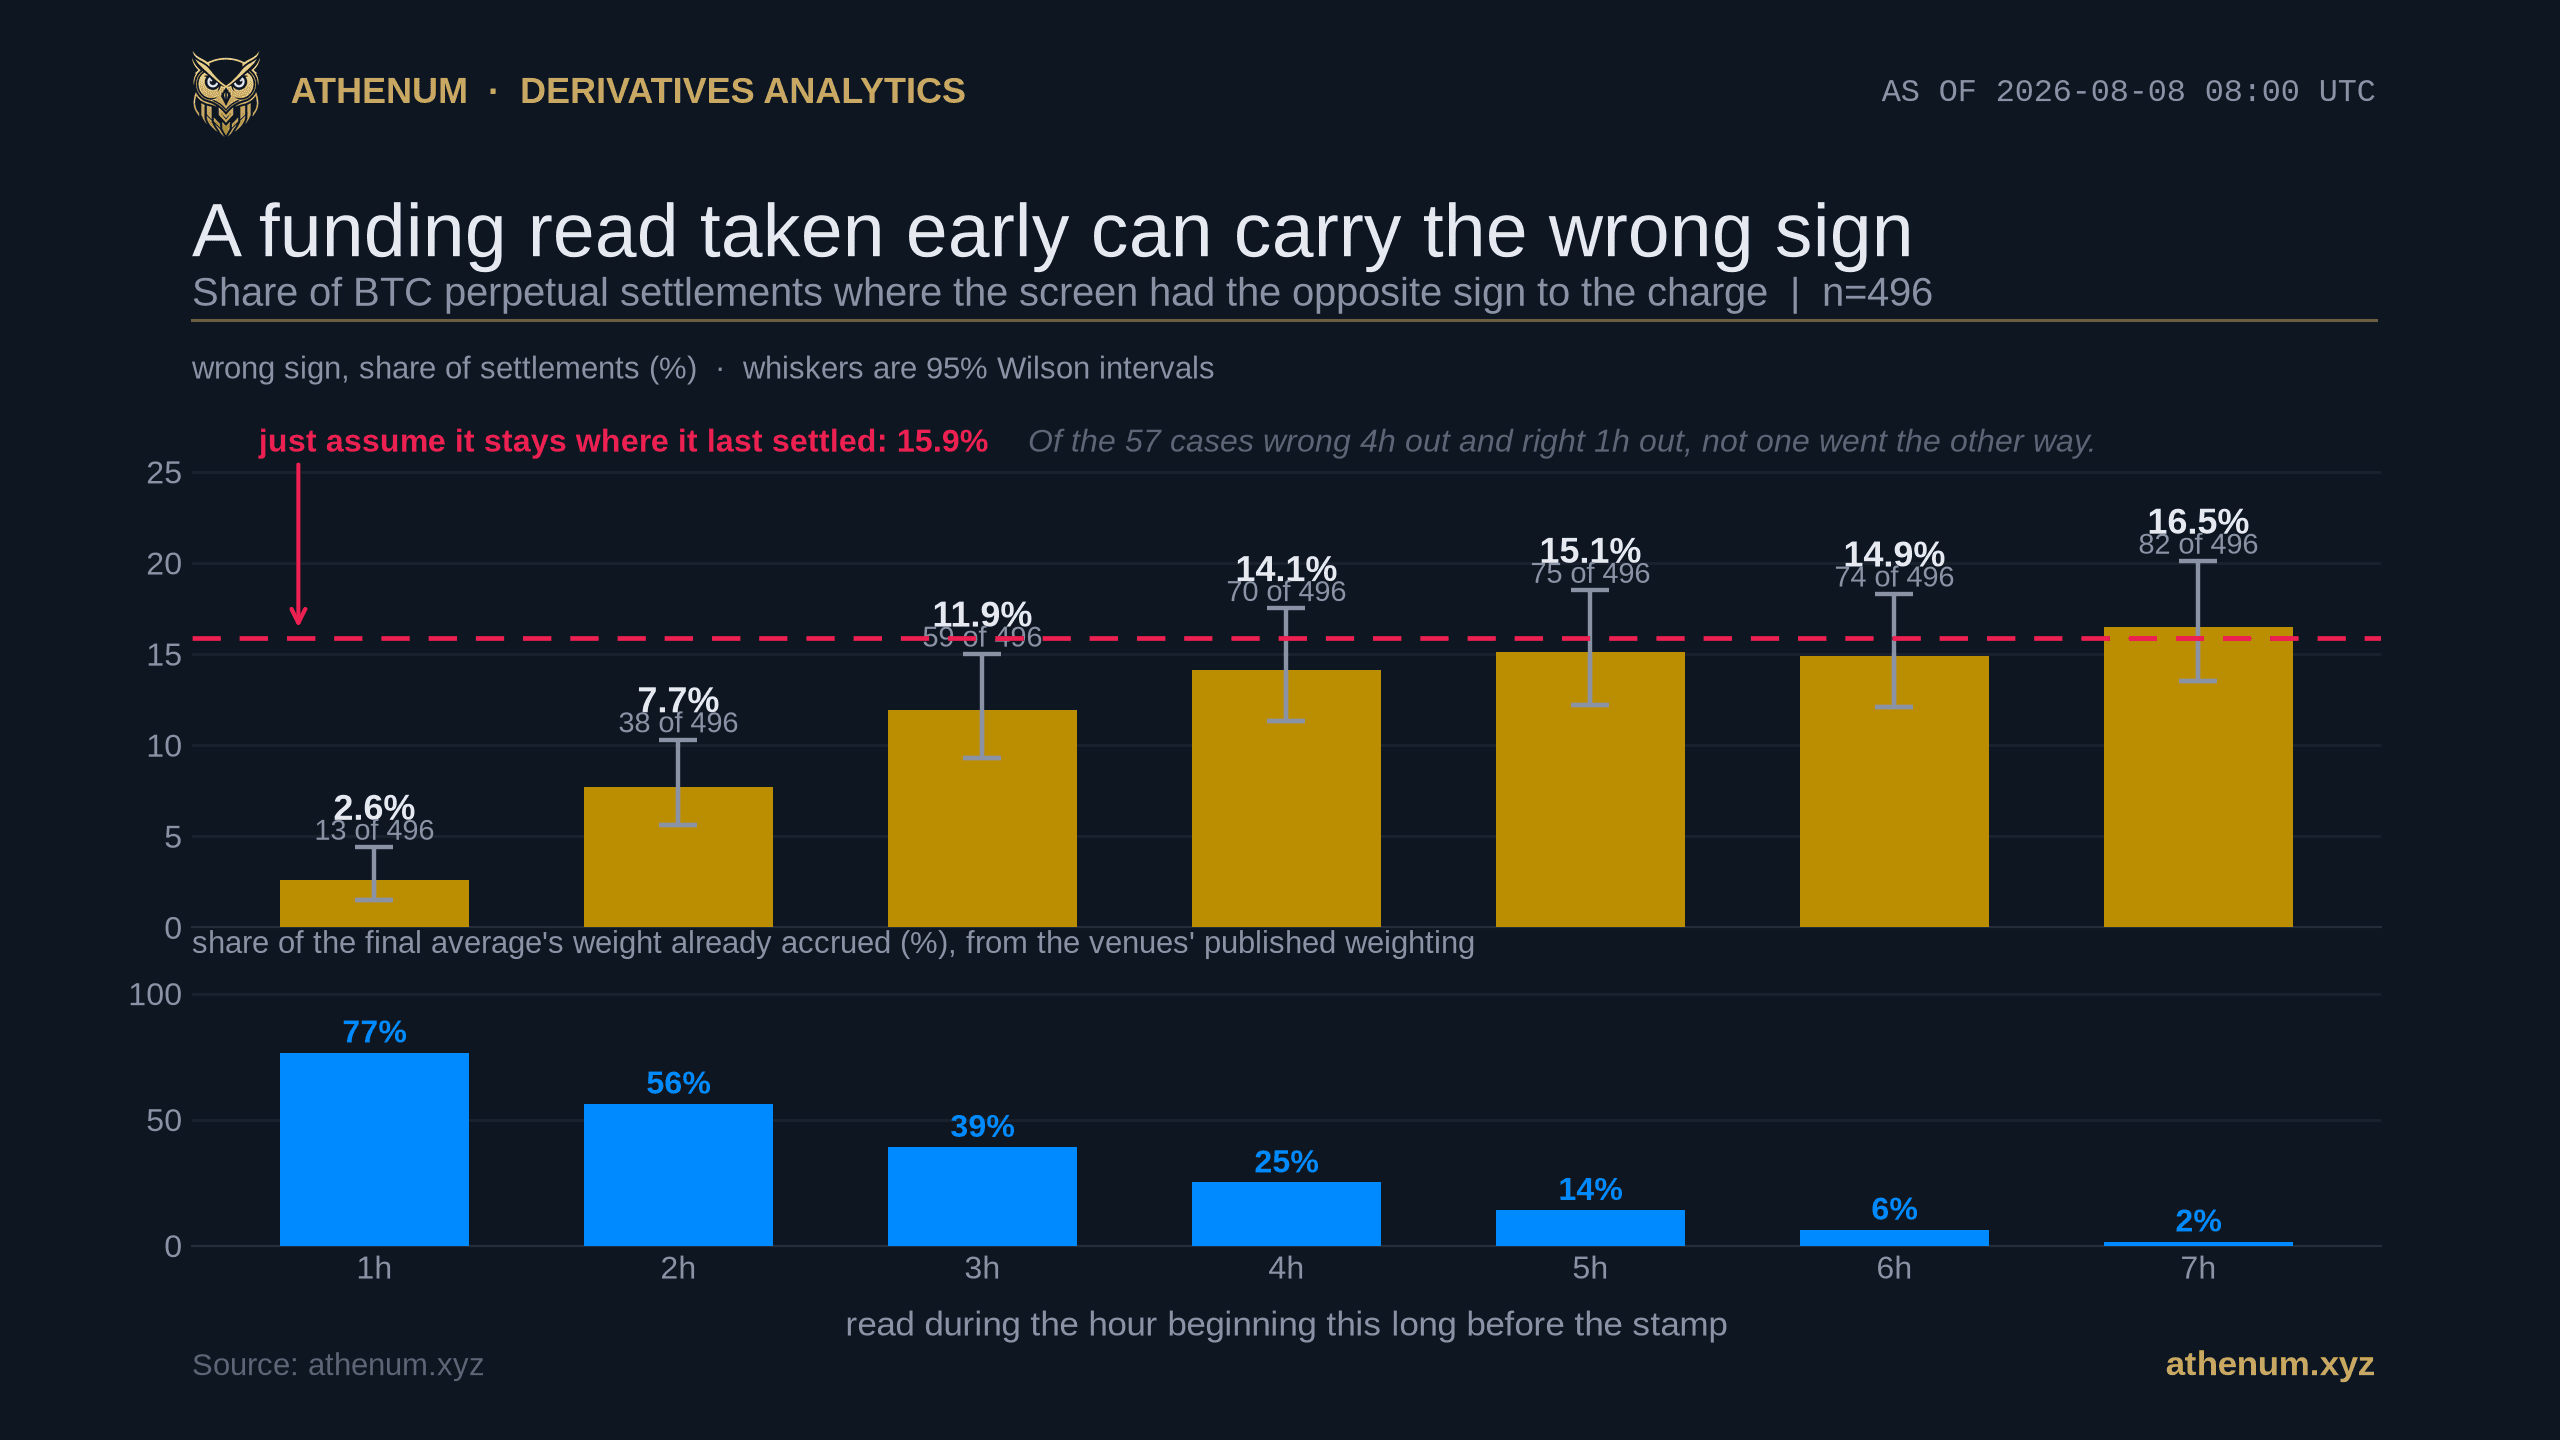
Athenum chart of how often a Bitcoin perpetual funding read taken early had the opposite sign to the rate that settled, over 496 venue-settlements to 2026-08-08: 13 of 496 wrong for a read in the final hour, 38 of 496 at two hours, 59 at three, 70 at four, 75 at five, 74 at six and 82 at seven, against a dashed baseline of 79 of 496 for simply assuming the rate stays where it last settled, with a lower panel showing that only 25 percent of the final average's weight has accrued at the start of the four hour window

Bitcoin-Finanzierungsraten schlagen die letzte Abrechnung erst in den letzten drei Stunden

Die Finanzierungsrate, die eine Boerse vor einer Abrechnung anzeigt, ist ein laufender Durchschnitt und nicht die Rate, die sie berechnen wird. Ueber 496 Bitcoin-Perpetual-Abrechnungen bis zum 2026-08-08 war eine vier Stunden vorher genommene Ablesung nicht besser als die Annahme, die Rate bleibe dort, wo sie zuletzt abgerechnet wurde. Erst innerhalb von drei Stunden loest sich die Anzeige davon.

Athenum AnalyticsAthenum Analytics
22 min
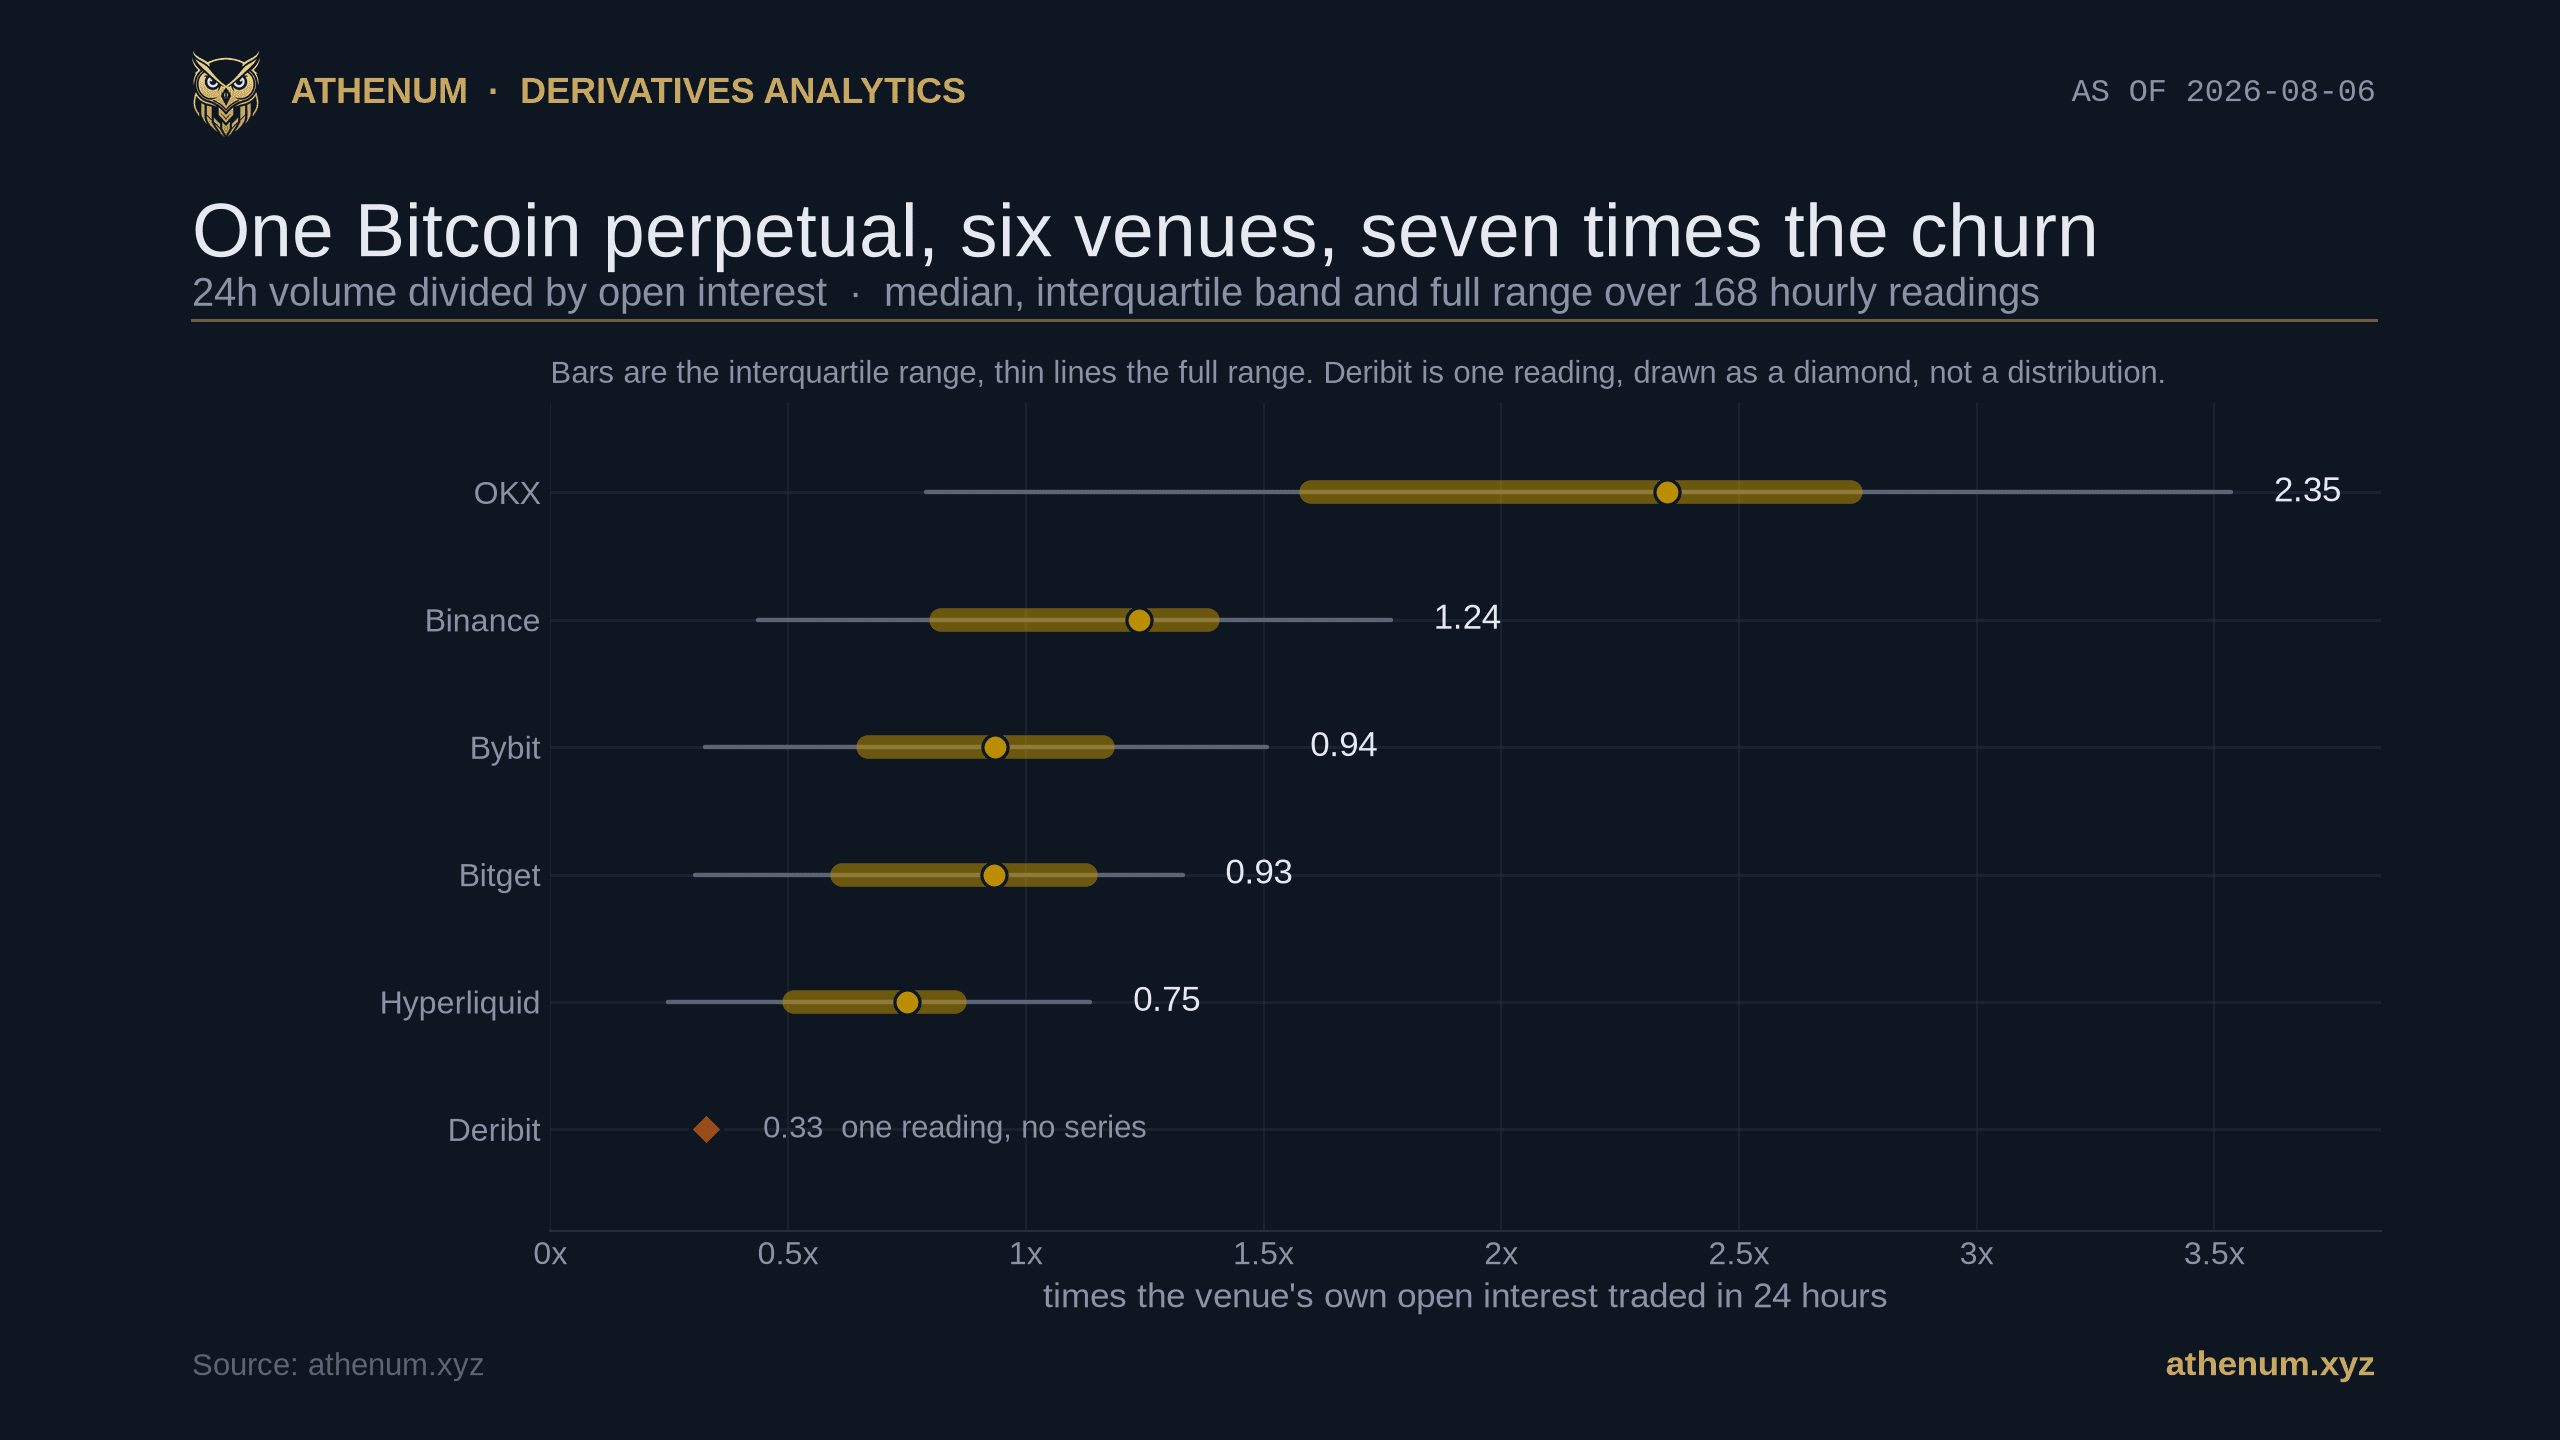
Athenum chart of Bitcoin perpetual turnover by venue over 168 hourly readings to 2026-08-06: median 2.35 times per day for OKX, 1.24 for Binance, 0.94 for Bybit, 0.93 for Bitget and 0.75 for Hyperliquid, each drawn with its interquartile band and full range, with Deribit shown as a single reading at 0.33

Bitcoin-Perp-Umschlag laeuft bei OKX dreimal schneller als bei Hyperliquid

Umschlag ist das an einem Tag gehandelte Nominalvolumen geteilt durch das Open Interest, das noch im Buch steht. Auf denselben sechs Bitcoin-Perpetuals spannen die Antworten den Faktor sieben, die beiden Boersen in der Mitte lassen sich gar nicht trennen, und das eigene Open-Interest-Feld einer Boerse verdoppelt ihr eigenes Ergebnis.

Athenum AnalyticsAthenum Analytics
14 min