Orderflow measurement: resets, units and information timing · 2 / 5
Volume delta: compare candle estimates with taker-side trades
Tools called volume delta may measure different things. One can use exchange taker-side flags; another can assign all lower-timeframe candle volume according to price direction. A disagreement need not be a broken chart or a hidden trading signal.
Athenum7 minUpdated:
Name the classification rule
An exchange trade feed may identify which side took liquidity for each execution. Under the convention used here, buyer-initiated quantity is positive and seller-initiated quantity is negative. Each execution still has both a buyer and a seller; the sign describes aggressor classification, not an excess number of buyers over sellers.
A candle-direction estimate instead classifies an intrabar’s entire volume from its open and close, with an explicit tie rule. TradingView documents this approach for its Volume Delta indicator. It can be useful as an estimate, but it does not become an execution-by-execution taker census merely because it is plotted as CVD.
Hold the population constant for a fair comparison
Use the same symbol, venue, time boundary and base unit in both calculations. Otherwise a difference could be caused by coverage rather than classification. Keep trade count, total quantity and excluded records so both populations can be reconciled.
The example simplifies the candle method to one rising intrabar with no open-close tie. A full implementation must also specify equal-price cases and lower-timeframe availability. Neither classification alone reveals whether the aggressor opened or closed a position, whether it was a liquidation, or the participant’s motive.
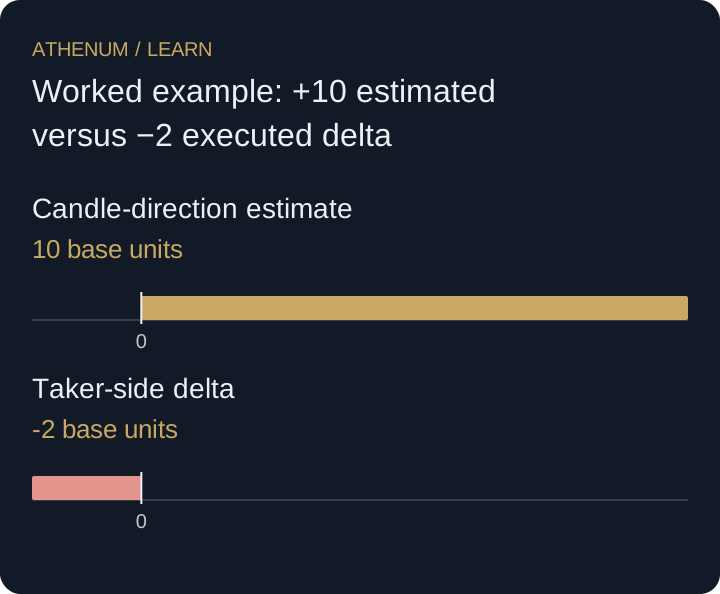
Worked example: +10 estimated versus −2 executed delta
In a hypothetical intrabar, price opens at 100 and closes at 101. Four executions have signed base quantities +2, −4, −2 and +2. Total quantity is 10, buy-aggressor quantity is 4 and sell-aggressor quantity is 6, giving executed delta of −2.
The simplified rising-candle rule labels all 10 units positive, producing +10. Price can close higher despite net seller aggression because quote changes, replenishment and execution sequence also matter. The twelve-unit difference between the two delta values is a measurement difference on the same tape; it is not twelve unreported trades.
| Execution | Taker side | Base quantity | Signed quantity |
|---|---|---|---|
| 1 | Buy | 2 | +2 |
| 2 | Sell | 4 | −4 |
| 3 | Sell | 2 | −2 |
| 4 | Buy | 2 | +2 |
 Open full-size diagram
- Candle-direction estimate: 10 base units
- Taker-side delta: -2 base units
Do not call every disagreement divergence
A price/delta divergence is a relationship between specified series. Comparing price with an inconsistently classified or changing-coverage delta series introduces a separate data problem. Freeze the calculation method before testing a trading rule and retain examples where the proposed interpretation fails.
Before acting
- Identify taker flags or the exact candle estimate.
- Match the instrument, venue, interval and quantity unit.
- Reconcile total quantity before comparing the signed result.
- Avoid inferring opening positions or participant identities from delta.
Check your understanding
A falling intrabar contains 9 buyer-initiated units and 3 seller-initiated units. What do the simple candle-direction rule and taker-side rule return?
Show the explained answer
Total quantity is 12. The falling-candle estimate is −12, while taker-side delta is 9 − 3 = +6. Both results follow their declared rules. The difference alone does not show which traders opened positions or establish a reversal setup.