Order flow and CVD: absorption, footprints and data quality · 5 / 5
Audit order-flow data before trusting a signal
An indicator can be calculated perfectly from incomplete data and still tell the wrong story. Before interpreting an unusual flow event, determine whether the feed could have observed the activity you are trying to explain.
Athenum8 minUpdated:
Event time, arrival time, trade IDs and reconnect gaps
Exchange timestamps describe when an event occurred under the venue's clock; local arrival timestamps describe when your system received it. Network delay and batching can make simultaneous market events arrive in a different order. Use the documented event-time convention for analysis, while retaining arrival latency as a quality signal.
For a decision-time replay, a trade becomes usable only after your system actually received it. Sorting delayed events by exchange time afterwards does not make them available earlier. Preserve both clocks and apply the original availability constraint when testing entries.
Record product, venue, subscription depth, trade IDs or documented sequence fields, and reconnect boundaries. Do not assume every numeric ID is consecutive unless the protocol promises that property. For order books, apply the specified snapshot/delta rules and reset state on a fresh snapshot when required. A chart continuing to animate is not proof that its underlying state is complete.
Show missing intervals and venues instead of filling zeros
A missing interval should remain missing until it is repaired from a compatible source. Filling it with zeros says that no activity occurred, which is a market claim. If a constituent exchange disappears, either pause the aggregate or clearly expose the reduced coverage. Otherwise a change in data availability can look like a change in demand.
For comparisons across providers, align venue coverage, units, reset times, classification and filtering. Some feeds exclude certain order categories or publish different subsets of events. A disagreement may be explainable without either arithmetic engine being wrong. Document the explanation rather than adjusting the data until the plots look alike.
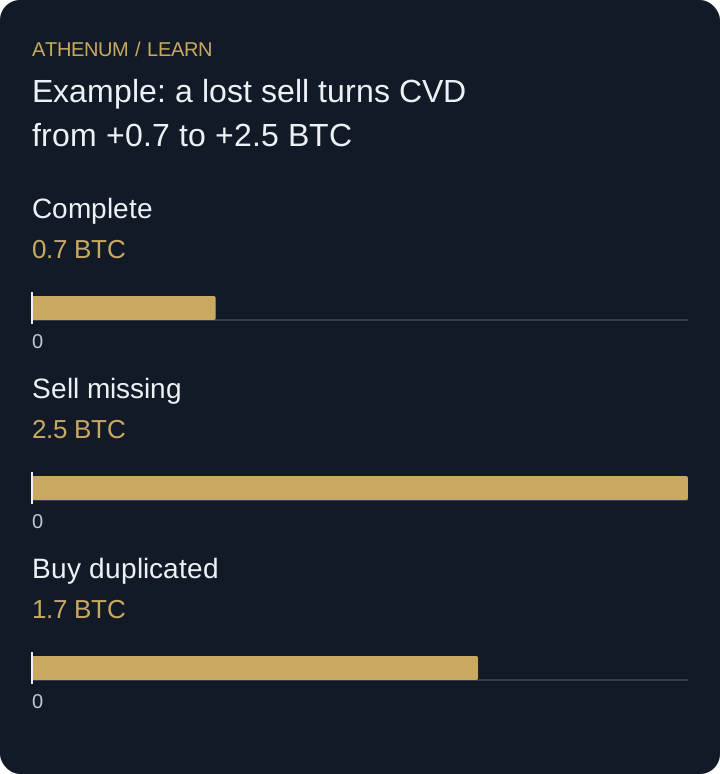
Example: a lost sell turns CVD from +0.7 to +2.5 BTC
Use the four-trade sequence +2, −0.5, +1 and −1.8 BTC. Complete CVD is +0.7 BTC. If the final sell is lost during a reconnect, the displayed result becomes +2.5 BTC. If the +1 BTC trade is processed twice while the rest remain intact, it becomes +1.7 BTC.
Both defective series look more bullish despite originating from the same real sequence. A useful audit compares unique event counts and total unsigned volume as well as the net delta. Where backfill cannot prove completeness, annotate the interval and exclude it from signal evaluation under a rule written before seeing whether that exclusion improves results.
| Dataset | Processed volume BTC | Final CVD BTC |
|---|---|---|
| Complete sequence | 5.3 | 0.7 |
| Final 1.8 BTC sell missing | 3.5 | 2.5 |
| 1 BTC buy duplicated | 6.3 | 1.7 |
 Open full-size diagram
- Complete: 0.7 BTC
- Sell missing: 2.5 BTC
- Buy duplicated: 1.7 BTC
Mistake: backtesting on corrected data instead of live observations
Historical values may change after delayed events, backfills or revised aggregation. Save the observations available at decision time when evaluating a strategy. Testing only a cleaned final history can give the strategy information that was not available live. This is especially important when very short-lived divergences supply the entry trigger.
Before acting
- Record event time, arrival latency and reconnect boundaries.
- Deduplicate with the venue's documented event identity.
- Rebuild books according to snapshot/delta rules.
- Treat missing intervals and unavailable venues explicitly.
- Compare units, classifications and final-versus-live data revisions.
Check your understanding
One of five aggregated venues stops updating, while the other four continue. Can the combined indicator remain comparable with the preceding interval?
Show the explained answer
Not without accounting for the coverage change. A smaller venue set is a different measurement. Mark the affected interval, show which constituent is unavailable and use a consistently defined comparison set or pause interpretation until compatible data is restored.
Sources and further reading
Continue with Athenum
From the Athenum blog
Taker vs Maker Flow: Reading Aggressive Order Flow and CVD in Crypto
Related lessons
- Orderflow lead and lag: align event time with arrival time
A 100 ms lead in exchange time can become a 180 ms lag on arrival. Replay trade messages as received and keep event, publication and receipt times apart.
- Bound liquidation-feed coverage without inventing a market total
Separate provider selection, collector gaps and result truncation. Test when an observed sum is a lower bound and why a multiplier cannot fix coverage.