Table of Contents8 sections
- What is the annualised basis, and why does one expiry get three answers?
- What happens if you read the same contracts again two minutes later?
- Does the spread shrink because venues agree more at long horizons?
- Is this an artefact of one instant, or does one contract do it over its whole life?
- How much of a front-month basis number is just the quoted spread?
- What does the front of the curve look like on the perpetual side?
- How should a basis number be quoted so it survives a check?
- What does this post not say?
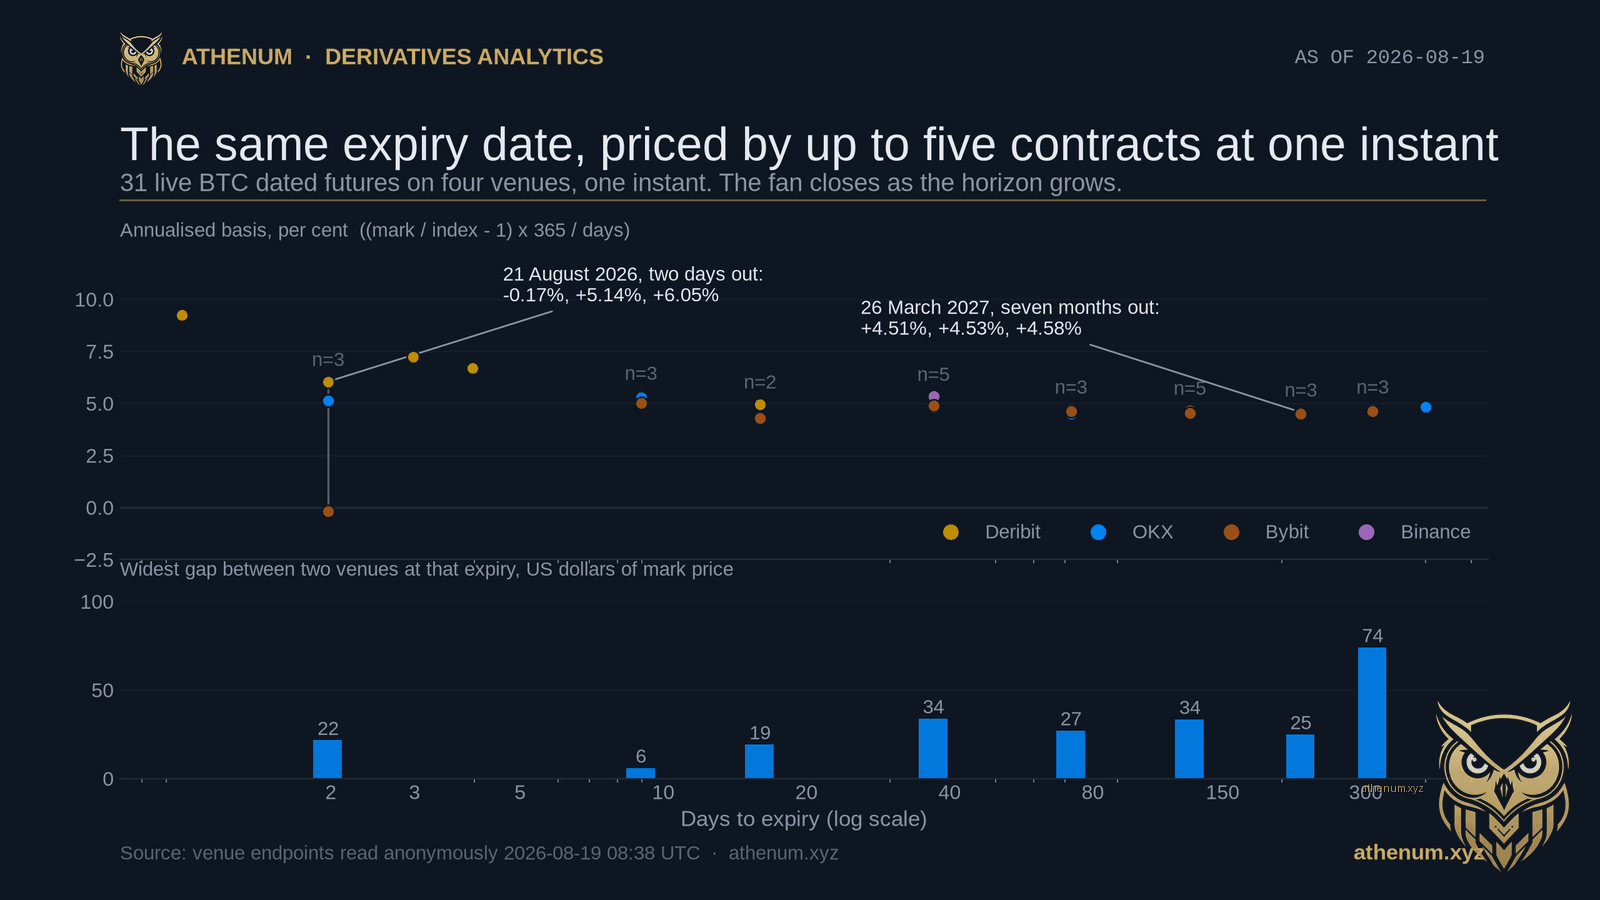
TLDR. An annualised basis number is a price gap divided by the time left on the contract, and near expiry that divisor is small enough to turn ordinary quoting noise into a headline. Read anonymously at one instant on 2026-08-19 08:38 UTC across 31 live Bitcoin dated futures on Binance (both margin boards), Bybit's USDT board, OKX's BTC-USD board and Deribit, the three venues listing the 21 August 2026 expiry priced it at -0.172%, +5.141% and +6.046% annualised, a spread of 6.218 points. The same three venues on the 26 March 2027 expiry sat at +4.507%, +4.526% and +4.575%, a spread of 0.068 points. The disagreement collapsed by a factor of 91, and the dollars behind it did not move: 21.65 dollars of mark price separated the venues at two days and 24.90 dollars at seven months. At two days one dollar of mark price is worth 0.287 annualised points; at seven months it is worth 0.0026, so the same quoting difference reads 111 times larger at the front, which is just the ratio of the two horizons, 219 days against 1.97. Everything past a month agrees: five contracts across four venues inside 0.148 points on the December expiry at about +4.5% annualised. Re-reading the identical universe 106 seconds later makes the point twice over: the two-day contracts moved by up to 5.772 points and swapped rank, while all 12 contracts expiring in December 2026 or later moved by at most 0.062 points.
What is the annualised basis, and why does one expiry get three answers?
The basis is what a futures contract costs above the spot index it settles against, and annualising it means scaling that gap up to a yearly rate: (mark / index - 1) x 365 / days to expiry. Every number in this post uses that convention, computed from each venue's own published mark price and its own published index, so no venue is being measured against a foreign reference. Two details that matter more than they look: the convention is simple, not compounded, and it uses a 365 day year, which is the form CF Benchmarks publishes for its own Bitcoin basis methodology, while Coin Metrics annualises the same quantity over 365.25 days. And days to expiry here is measured to the second from each venue's own published delivery timestamp rather than rounded to whole days, because at 37 days out a one day rounding error moves the answer by about 13 basis points, which is twice what the choice between a 360 and a 365 day year is worth. One caveat on the word instant: it is not a frozen moment.
Two things the word price hides here, both of which cut against us. First, each read is a sweep across the venues rather than a frozen moment: it took 8.2 seconds end to end, which is far shorter than the window in which the front of the curve rewrites itself, but it is not zero. Second, a mark price is not a trade and not a quote. On all four venues it is the index plus a smoothed basis derived from the order book, and Deribit states in its own documentation that the mark can fall outside the bid and ask and should not be relied on for trading decisions. We checked that on the 25 September contract on 2026-08-19 at 09:02:07 UTC: the mark sat inside the venue's own top of book on three of the four, and 1.69 dollars below the best bid on the fourth. At that horizon the choice barely matters, because using the bid-ask midpoint instead of the mark moves the annualised basis by 0.015 to 0.027 points. At two days to expiry the same 1.69 dollars would be worth 0.485 points, which is this post's argument compressed into one number. Read every figure here as a mark-implied basis, not an executable yield. The reason one expiry gets three answers is the divisor. A contract two days from expiry divides its price gap by 1.97/365 of a year, which multiplies everything, including the part of the gap that is not information.
Scope, stated so it can be checked: this is the 31 contracts those four venues list on the boards named above. Bybit's inverse dated contracts and OKX's BTC-USD_UM board are live and are not in it, so read every count here as 31 contracts rather than as everything either venue lists.
Here is the same instant on three shared expiry dates, with the raw dollar gap next to the annualised figure.
Expiry | Days left | Venue | Mark minus index | Annualised basis |
|---|---|---|---|---|
21 Aug 2026 | 1.97 | Bybit | -0.60 USD | -0.172% |
21 Aug 2026 | 1.97 | OKX | +17.90 USD | +5.141% |
21 Aug 2026 | 1.97 | Deribit | +21.05 USD | +6.046% |
25 Dec 2026 | 127.97 | Binance | +1,020.81 USD | +4.518% |
25 Dec 2026 | 127.97 | OKX | +1,020.30 USD | +4.519% |
25 Dec 2026 | 127.97 | Deribit | +1,053.37 USD | +4.666% |
26 Mar 2027 | 218.97 | Bybit | +1,742.50 USD | +4.507% |
26 Mar 2027 | 218.97 | Deribit | +1,748.31 USD | +4.526% |
26 Mar 2027 | 218.97 | OKX | +1,767.40 USD | +4.575% |
One unit caveat before those rows are read as like for like. The Bybit contracts here and Binance's USD-M contracts are quoted in USDT, while Deribit, OKX and Binance's COIN-M contracts are quoted in USD. At this instant USDT traded at 0.99909 against the dollar on Kraken, and the two USDT-quoted indices sat 53.50 dollars above the mean of the five USD-quoted ones, which is the tether quote rather than a different view of Bitcoin. At two days to expiry a difference of one hundredth of a per cent in the tether forward is worth 1.85 annualised points, so part of any front-month cross-venue gap is a currency forward and not a Bitcoin one.
Read the first block and the last block together. At two days the three venues are 21.65 dollars apart and that reads as 6.218 annualised points. At seven months they are 24.90 dollars apart, slightly further apart in dollars, and it reads as 0.068 points. Nothing about the venues' view of Bitcoin changed between those two rows. The horizon changed.
What happens if you read the same contracts again two minutes later?
The front of the curve rewrites itself and the back of it does not move. We took the identical read a second time at 08:39:57 UTC, 106 seconds after the first, from the same endpoints. On the 21 August expiry the three venues came back at +5.599% (Bybit), +4.826% (Deribit) and +3.765% (OKX): a spread of 1.834 points rather than 6.218, and the ranking rotated, with the venue that had been lowest now highest.
Time left | Contract | First read | 106 seconds later | Change |
|---|---|---|---|---|
1.97 days | Bybit BTCUSDT-21AUG26 | -0.172% | +5.599% | +5.772 points |
1.97 days | Deribit BTC-21AUG26 | +6.046% | +4.826% | -1.220 points |
1.97 days | OKX BTC-USD-260821 | +5.141% | +3.765% | -1.376 points |
127.97 days | Deribit BTC-25DEC26 | +4.666% | +4.635% | -0.030 points |
218.97 days | Bybit BTCUSDT-26MAR27 | +4.507% | +4.501% | -0.006 points |
400.97 days | OKX BTC-USD-270924 | +4.843% | +4.844% | +0.001 points |
Across all 31 contracts present in both reads, every one of the 12 expiring in December 2026 or later changed by at most 0.062 points, and eleven of those twelve changed by less than 0.05. Every contract with four days or less left changed by at least 1.058 points. Two minutes of a quiet Wednesday morning is not enough time for the Bitcoin forward curve to reprice, so what moved was the reading, not the market.
This is also the honest caveat on the headline. The 6.218 point spread quoted above is what one instant looked like. Re-running the measurement will generally give a different front-month spread and much the same back-month agreement, and that is the finding rather than a failure to reproduce it.
Does the spread shrink because venues agree more at long horizons?
No, and this is the part worth carrying away: the venues agree about the same amount everywhere, they just get graded on a scale that gets brutal as expiry approaches. Across the whole curve on 2026-08-19, the widest venue-to-venue gap at a shared expiry ranged from 6.02 dollars (28 August, three venues) to 74.08 dollars (25 June 2027, three venues), with no trend toward the front. What has a trend is the exchange rate between dollars and points. One dollar of mark price on the Bitcoin contract is worth 0.2870 annualised points at two days, 0.0153 at 37 days, 0.0044 at 128 days and 0.0026 at 219 days.
So the honest way to read a front-month basis quote is as a statement about the denominator, and the same caution we applied to Athenum's measurement of a cross-venue price gap that turned out to be a currency quote applies here: check what the number is divided by before you compare it to anything. Our basis and contango explainer sets out the mechanism itself; this post is about the arithmetic that sits on top of it.

One contract, 456 hourly readings, two units. Box is the 25th to 75th percentile, whisker the 10th to 90th. The annualised 10-to-90 span goes 10.0, 15.1, 69.4 points as expiry approaches (n = 312, 96 and 48 hours). The dollar span over the same hours goes 250, 166, 298 dollars, which is nearly flat by comparison. Both panels are the identical measurements.
Is this an artefact of one instant, or does one contract do it over its whole life?
One contract does it across the last three weeks of its life, and the second chart is the same contract watched rather than the same instant sliced. Bybit's BTCUSDT-21AUG26 against Bybit's own BTCUSDT index, every hour from 21 days to expiry down to 2 days, is 456 readings. Bucketed by time remaining, the annualised basis 10th-to-90th percentile span was 10.0 points with 8 to 21 days left (n = 312 hours), 15.1 points at 4 to 8 days (n = 96) and 69.4 points at 2 to 4 days (n = 48). Over the identical hours the raw dollar gap spanned 250, 166 and 298 dollars, so the dollar noise barely moved, widening 19% in the last bucket. The annualised noise grew 6.9-fold. The divisor alone accounts for 4.7 of that: the average annualised value of one dollar rises from 0.0423 points to 0.1981 across the same three buckets.
The medians barely moved either: +3.68%, +2.80% and +3.96% across the three buckets. So a trader reading this contract's annualised basis between four days and two days out was reading a number whose central tendency was near 4% and whose 10-to-90 band was 69 points wide. In the last six hourly readings before we measured, it printed +39.42%, +43.44%, +65.64%, +29.63%, +13.28% and -34.00%. Those are trade-based closes, while the -0.172% quoted at the top of this post is Bybit's mark, which is a different price basis on the same contract.
One honest limitation, because it is part of the mechanism rather than a flaw in it. The hourly close on a dated contract is a last traded price, and this one is thin: 143 of 455 consecutive hours closed at exactly the same price as the hour before, meaning no trade moved it while the index kept moving underneath. That staleness is not a data defect to be cleaned away. It is what a lightly traded contract looks like, and it is precisely why its annualised basis swings 70 points in five hours while nothing about Bitcoin's forward curve changes.

Deribit's live bid and ask on each dated BTC future, one instant, expressed as annualised basis. A 25 dollar quote at one day out is worth 14.6 annualised points. The two-day contract next to it quotes 2.5 dollars wide, worth 0.7 points, and the 37-day contract quotes 2.5 dollars wide for 0.04 points, so width is not a smooth function of the horizon.
How much of a front-month basis number is just the quoted spread?
At the very front the quoted spread alone can be worth more than the whole curve, though not uniformly, and the exception is the instructive part. Converting Deribit's live width into annualised basis at 2026-08-19 08:40 UTC gives 14.556 points for the contract expiring the next day (quoted 25.00 dollars wide), 0.718 points at two days (2.50 dollars wide), 4.766 points at three days (25.00 dollars wide) and 3.566 points at four days. The same venue's 37-day contract quoted 2.50 dollars wide, worth 0.038 points, and its 310-day contract quoted 50.00 dollars wide, worth 0.091 points. Width is not a smooth function of the horizon. It is a function of which contract the market is actually working that morning, and on this morning that was the two-day contract, which turned over 2,550,460 dollars in 24 hours against the four-day contract's 30 dollars.
Put plainly: at one day to expiry you cannot measure a 4.5% basis with an instrument whose bid-ask alone is worth 14.6 points. The liquidity behind those quotes says the same thing from the other side. Deribit's 25 September contract turned over 7,987,350 dollars in 24 hours; its 23 August contract turned over 30 dollars. A number computed off the second one is not a market observation, it is a rounding error with a big multiplier on it.
The sharpest version of this sits inside a single venue, with no cross-venue comparison at all. On Deribit's 21 August contract at 08:38 UTC the three prices a reader could defensibly use give +6.046% (the mark), +9.576% (the midpoint of the live bid and ask) and -2.990% (the last trade). That is a 12.566 point range from one venue at one instant, twice the cross-venue spread this post opened with, and choosing between those three prices is a methodology decision almost nobody publishes.
What does the front of the curve look like on the perpetual side?
The same, and our own cross-venue feed is where that shows. A perpetual is the zero-days-to-expiry limit of this curve, and its carry is paid through funding rather than through a price gap, so annualising it is the only way to line it up against the dated contracts. Over the 24 complete hours to 2026-08-19 07:00 UTC, taking Bitcoin perpetual funding for each of these venues from the Athenum cross-venue feed and annualising it (eight-hourly venues at three settlements a day, Hyperliquid at its native hourly rate, checked against Hyperliquid's own endpoint), the median annualised carry was +6.04% on OKX, +5.32% on Bitget, +3.27% on Binance, +2.31% on Bybit, +0.89% on Hyperliquid and +0.45% on Deribit, a spread of 5.59 points between the highest and lowest median.
That ranking looks decisive and it is not, which is why the chart draws the bands rather than the medians alone. Every one of those six interquartile bands overlaps at least two others: Binance ran +1.71% to +6.64% across those 24 hours, OKX +2.98% to +9.19%, Bybit +1.16% to +4.56%. Each venue's own hour-to-hour range is wider than most of the gaps between venues, so "OKX pays more carry than Binance" is a statement about one hour, not about the day. This is the perpetual-side twin of the dated-contract finding: at the short end, dispersion swamps the level.

Perpetual funding annualised, 24 complete hours to 2026-08-19 07:00 UTC, from the Athenum cross-venue derivatives feed. The box is the interquartile band, the thin line the full 24-hour range, the notch the median; n = 24 hours per venue except Deribit where one hour was missing (n = 23). The dashed gold line is where the December dated contract priced carry the same morning, +4.52%, with five contracts across four venues inside 0.15 points of each other.
How should a basis number be quoted so it survives a check?
Five rules, all of which fall out of the measurements above.
1. Publish the days to expiry next to the percentage. Without the divisor the number is unreadable. "+6.05% annualised" and "21 dollars above index" are the same fact about the 21 August contract, and only one of them is honest about its own precision. 2. Read the far contract, not the near one, if you want the market's carry. Read on 2026-08-19, the December expiry had five contracts across four venues inside 0.148 points and the March expiry three venues inside 0.068. That agreement is the signal. The front-month scatter is not. 3. Convert the quoted spread before quoting the basis. If the bid-ask alone is worth more annualised points than the level you are reporting, report the level with an error bar or do not report it. 4. Use one index per venue, its own, and check its quote unit. The USD-quoted index readings in this sweep, from three venues, sat inside 3.41 dollars of each other, worth about one annualised point at two days. The USDT-quoted readings sat 53.50 dollars above their mean, and that is the tether quote, not a different view of Bitcoin. 5. Check the turnover, including on your own headline. A contract that traded 30 dollars in a day has a mark price, not a market price. That cuts at this post too: the Bybit contract behind the -0.172% turned over 209,591 dollars in 24 hours, its last trade did not move at all across our two reads, and that last trade sat 104.70 dollars below its own index, which annualises to -30.09%.
You can do the annualising arithmetic on the free APY calculator, size a cash-and-carry leg on the arbitrage calculator, and convert a funding rate to an annual figure on the funding rate calculator. All three are free and none of them asks who you are. If your carry trade is leveraged, the liquidation calculator is the one that matters, and the reason a basis carries risk at all is covered in our post on how a perpetual can sit below spot while longs still pay.
What does this post not say?
It does not say the front of the curve is broken, or that anyone is quoting in bad faith. Every venue in this post published a mark price, an index and a bid-ask that a reader can call and reproduce, and the arithmetic that turns them into an annualised percentage is the standard one.
It also does not say that a mark price is a trade. On each venue the mark is a model. OKX publishes it as the index plus a moving average of the basis, Deribit as the index plus a smoothed premium, enriched for dated futures with forwards implied by its own options market, and Bybit publishes a moving-average basis rate for its inverse and USDC expiry contracts while publishing none for the USDT-quoted contract measured here. The data show what that means. Between our two reads, 106 seconds apart, Bybit's mark moved 21.60 dollars while its last trade did not move at all and its index moved 1.50 dollars. Reading three differently smoothed models at the same wall-clock instant is itself worth annualised points at two days to expiry, and that is a large part of why the second read moved so far.
Nor does it say the December contract's +4.5% is a forecast of anything. It is what carry cost that morning, nothing more.
One correction against our own back catalogue, because it would be dishonest to leave it standing. We published the qualitative version of this in July, and that post said the front-of-curve numbers are arithmetic rather than signals, which the measurements here confirm. It also called the cross-venue spread a small real edge of the kind a cash-and-carry desk arbitrages. That reading survives only at the back of the curve, where the disagreement is 0.068 to 0.148 points and stable enough to trade against. At the front it does not: 6.218 points that become 1.834 points in 106 seconds, on three differently smoothed models, is not an edge anyone can capture.
What this post does say is narrower and more useful: a basis quote inherits the precision of its horizon. At seven months, three venues describing the same forward agree to within seven hundredths of a point. At two days, those same three venues disagree by six points on twenty two dollars, and most of that disagreement is the divisor talking, not the market.
If you want to run these numbers yourself, the live cross-venue derivatives feed behind them is on Athenum, and its 34 calculators are free to use: no account, no email, no usage limits. The terminal that sits beside them opens on a free 7 day Pro+ trial with no card.
One terminal. All the data.
Liquidations, orderbook depth, whale walls & open interest from 4 exchanges, all real-time, in one place.
No credit card required

Athenum Analytics
Athenum Analytics is our three-person editorial team covering crypto derivatives, market data and macroeconomic context.