Table of Contents7 sections
- How large is early funding relative to each contract's later rates?
- What does moving the comparison anchor test?
- What does traded volume tell us about liquidity?
- Which contracts have nearly constant early rates?
- Does the sign of funding change?
- How can the revised result be reproduced?
- Can contract age be separated from asset age?
The decision before the data
A historical requery of 514 Binance perpetuals compares early funding with each contract's later rates, correcting pagination and distinguishing evidence from causes.
| Your question | What to compare | What this cannot establish |
|---|---|---|
| Budget funding for a new listing? | Check its current interval, cap and signed settlement rates; model several holding scenarios. | The historical 3.07 median is not a forecast or a funding bill. |
| Compare a launch with its later history? | Paginate the whole period and inspect changes in observed settlement spacing. | A per-settlement ratio does not normalize different interval lengths. |
| Infer liquidity or a cause? | Separate traded quote volume, order-book depth and asset age. | This cohort is descriptive; its placebo does not isolate those mechanisms. |
Review 2026-10-23: complete historical pagination adds 5,755 baseline records for 12 contracts and 250 for two placebo windows. These are later exchange queries of the original 514-contract cohort, not recovered original API captures. Missing volume is excluded, the SENT interval explanation is corrected, and causal claims are narrowed. Public inputs and independent calculations are linked below. Data JSON Reproducible audit Binance API Binance funding formula
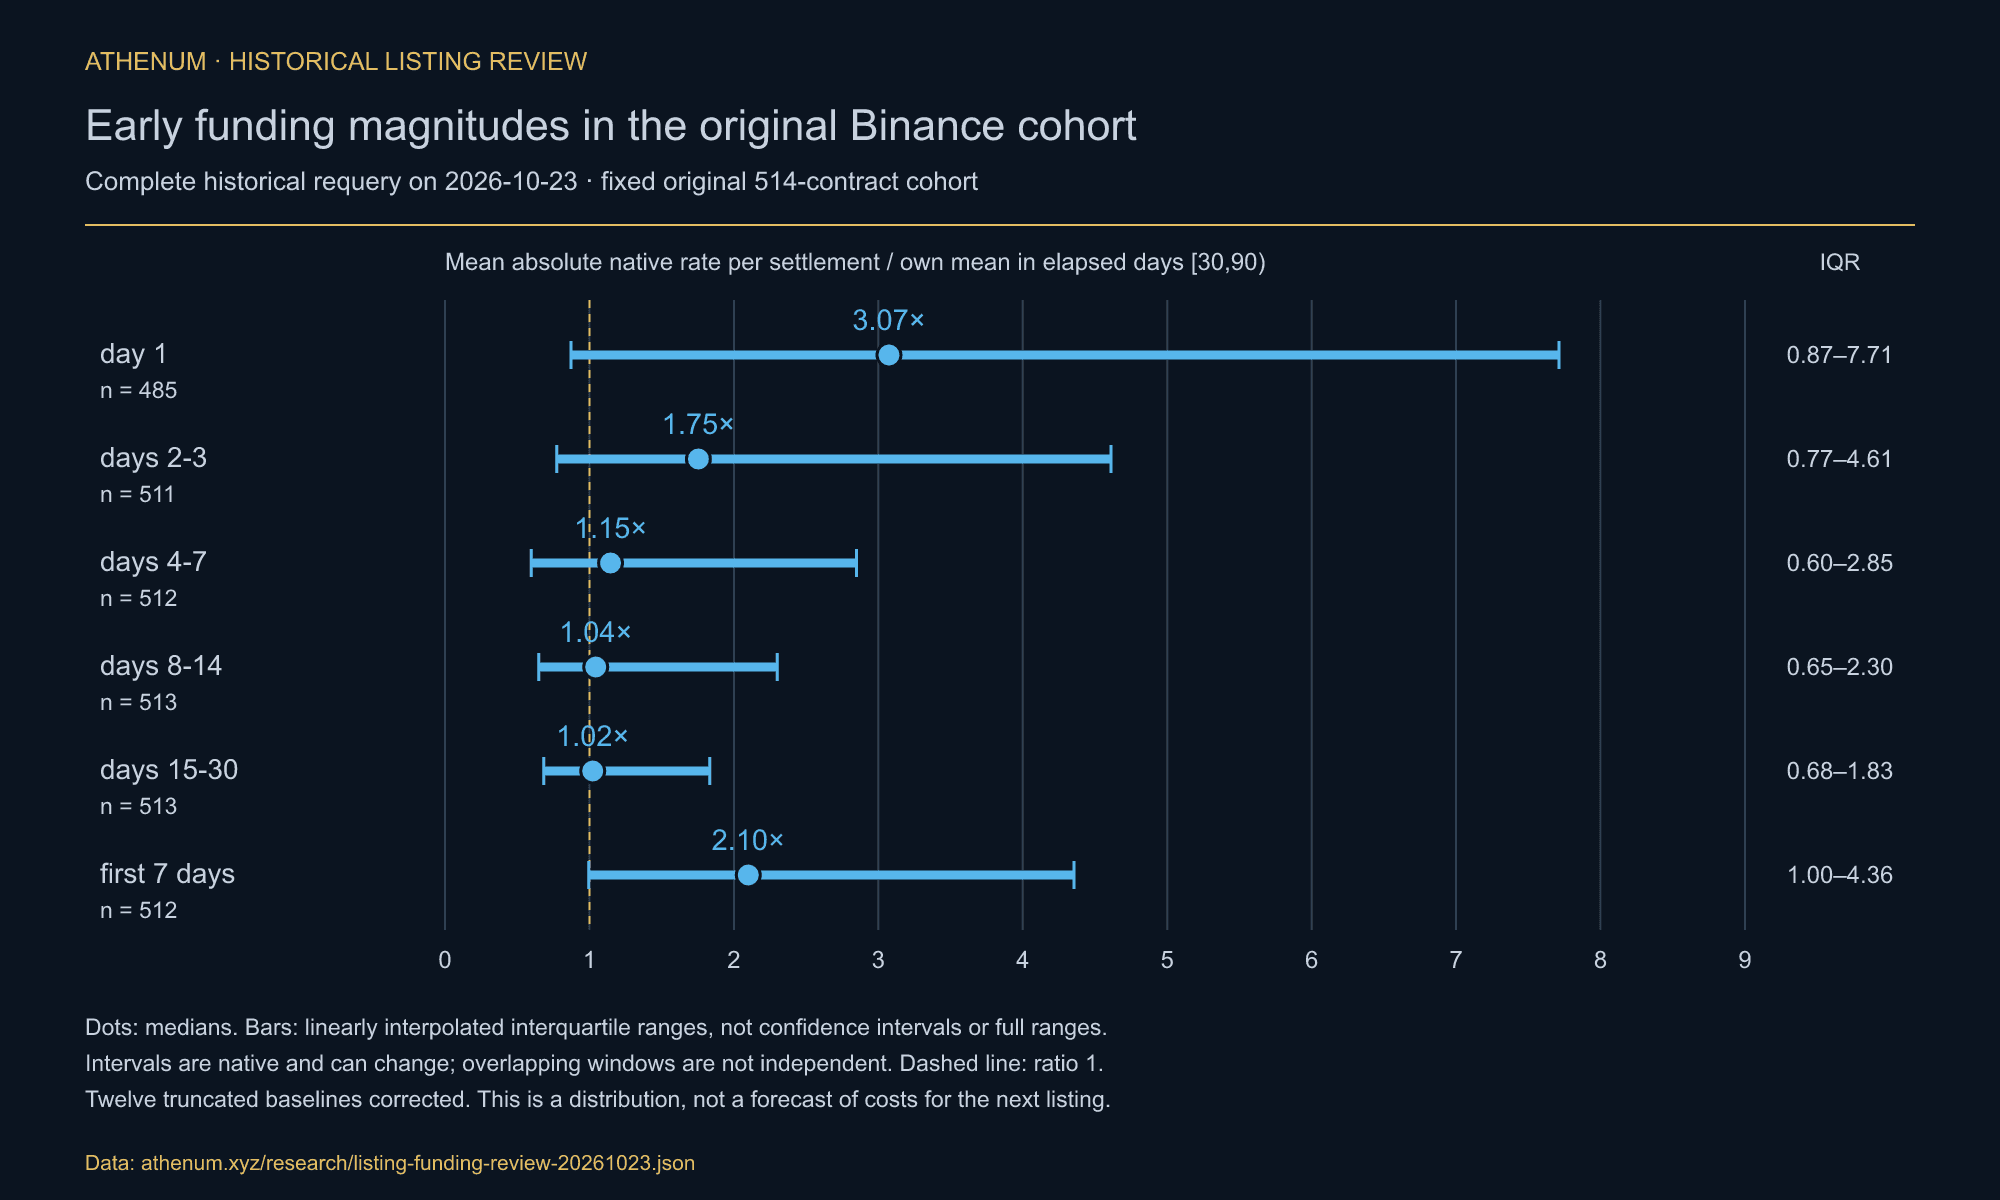
TLDR. A complete historical requery of the original 514 Binance USDT perpetuals gives a day-one median ratio of 3.07 across 485 usable contracts and a first-week median of 2.10 across 512. Each ratio divides early mean absolute funding per settlement by the same contract's mean in elapsed days [30,90). The original request stopped at 1,000 records, truncating twelve baselines. These descriptive ratios are neither cumulative holding costs nor predictions. Interval changes, surviving-contract selection, calendar conditions and asset age remain important limits. Twenty-nine contracts have no returned first-day settlement and two have no first-week settlement; these are missing windows, not zero rates.
How large is early funding relative to each contract's later rates?
For each archived onboard timestamp, calculate the mean absolute fractional funding rate in an early half-open elapsed window and divide by its mean in [30,90) days. The same symbol and venue are compared, but tick sizes, liquidity, funding intervals and market conditions need not stay constant. The table uses native per-settlement rates; it does not measure volatility or equal-time cash flows.
Elapsed window | Contracts | Median ratio | Interquartile range | Above own baseline |
|---|---|---|---|---|
Day 1 | 485 | 3.07× | 0.87–7.71 | 339/485 |
Days 2–3 | 511 | 1.75× | 0.77–4.61 | 332/511 |
Days 4–7 | 512 | 1.15× | 0.60–2.85 | 291/512 |
Days 8–14 | 513 | 1.04× | 0.65–2.30 | 274/513 |
Days 15–30 | 513 | 1.02× | 0.68–1.83 | 267/513 |
First 7 days | 512 | 2.10× | 1.00–4.36 | 381/512 |
The day-one interquartile range is 0.87–7.71; 146 of 485 ratios are below one. NOTUSDT reaches 154.14, while SENTUSDT is 0.0327. SENT's first observed hourly gap ends on 2026-01-29 at 13:00:00.003 UTC, about elapsed day 76, not day 31. Its late four-hour records also have larger mean magnitudes than its initial 0.005% rate, so a clock change alone does not explain the ratio. Restricting to consistent observed spacing throughout 90 days gives day-one median 3.07 on 427 contracts and week median 2.05 on 454. This sensitivity does not establish a permanent exchange rule.
The onboard field supplies a reproducible anchor, not a verified first executed trade or the asset's birth date. Read the funding-interval study before treating rates from different clocks as directly comparable.
What does moving the comparison anchor test?
Short samples and skewed rates can affect ratios. A later anchor checks whether this selected sample gives the same descriptive result at another point in each contract's life. It does not eliminate every arithmetic bias or provide a causal control.
For contracts older than 300 days at the original capture, move the anchor forward exactly 200 days. Compare [200,201) or [200,207) with [230,290) elapsed days. Require usable observations in both the real and later-anchor windows; the matched day and week subsets differ.
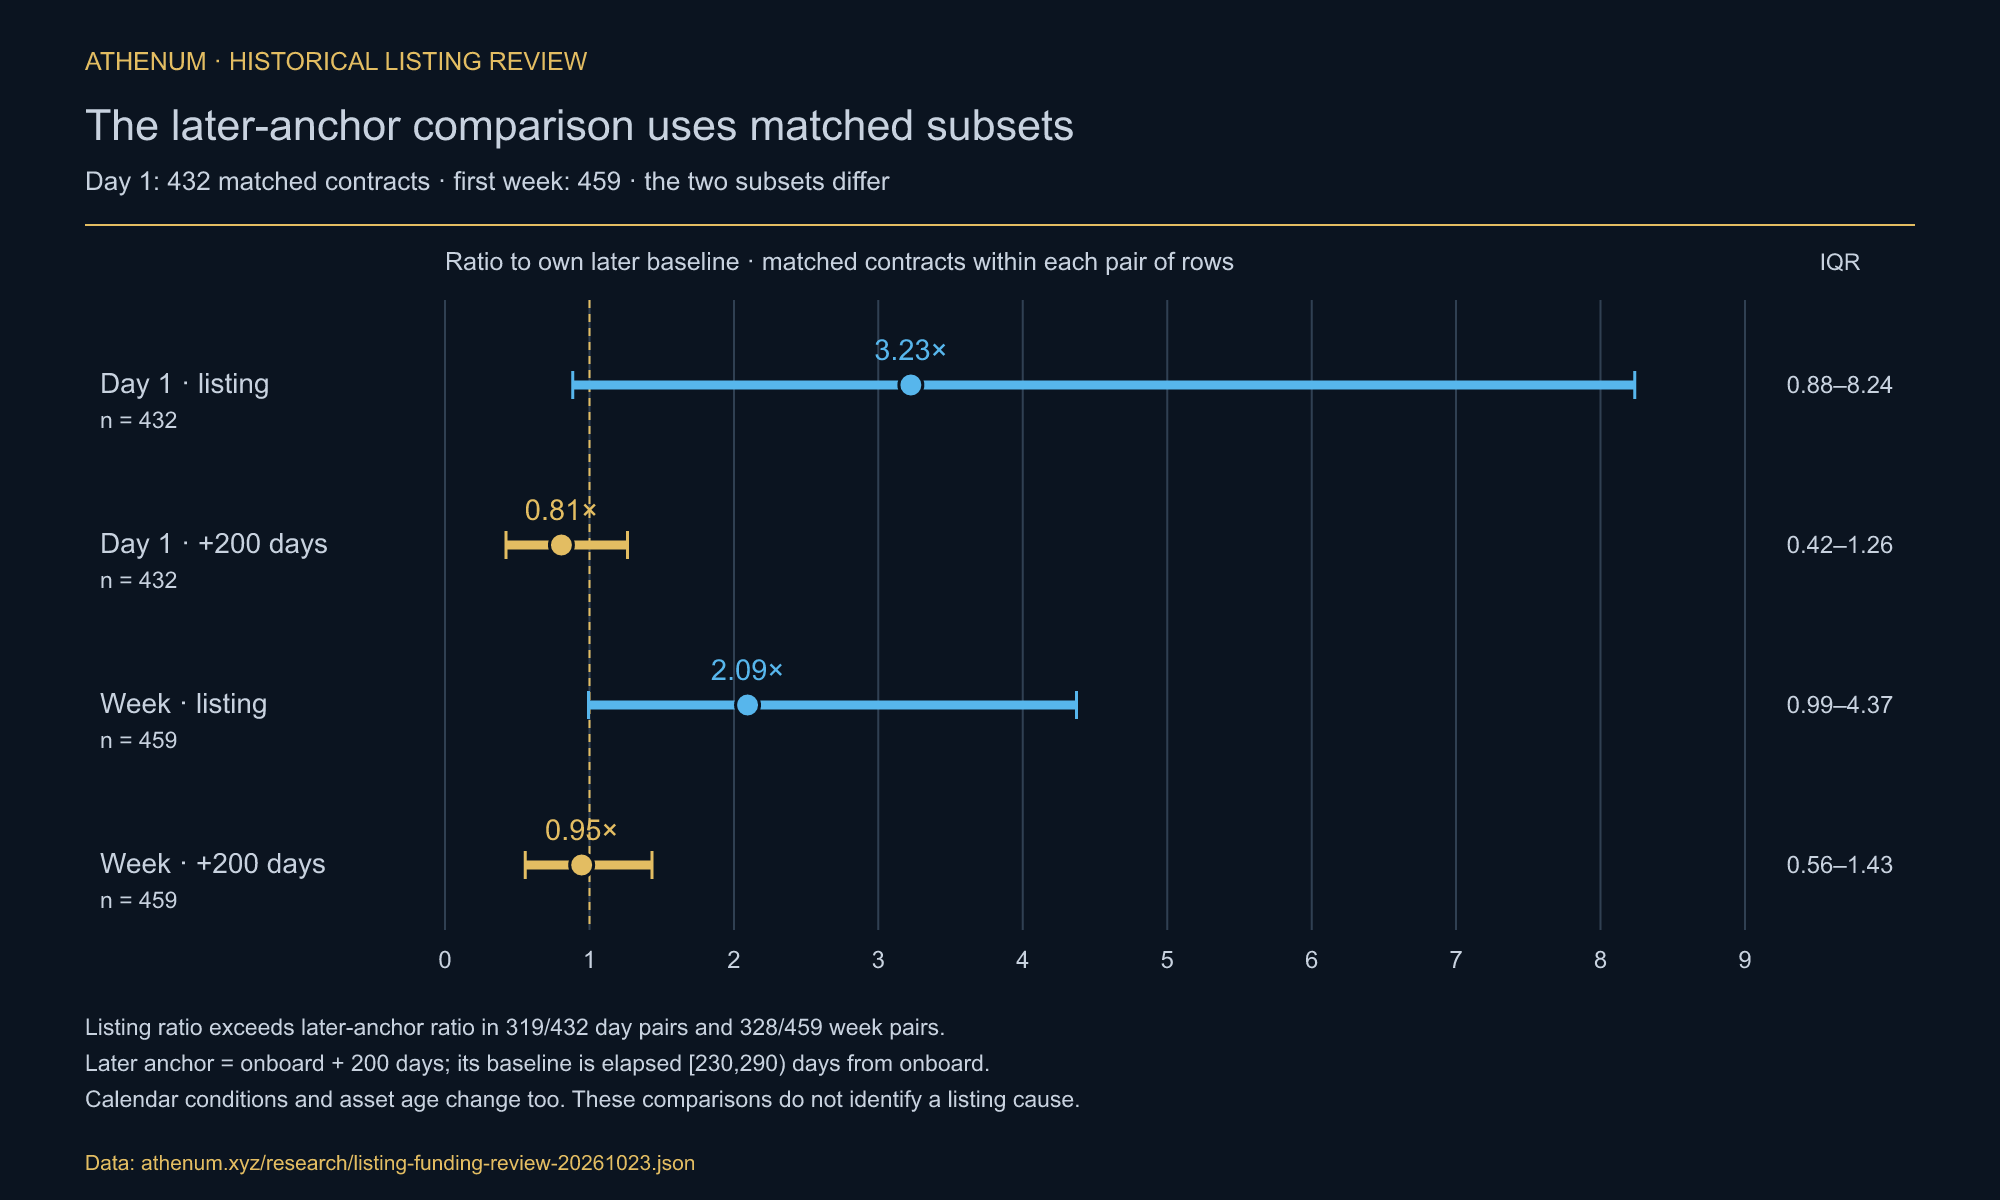
On the same 432 contracts, day-one medians are 3.23 at the listing anchor and 0.81 at the later anchor. The listing ratio is larger in 319 pairs.
For the matched 459-contract week subset, the medians are 2.09 and 0.95; the listing ratio is larger in 328 pairs. Neither 0.81 nor 0.95 is a universal bias correction or a reference for every other window. The chart identifies each matched subset separately.
The later anchor changes calendar conditions and underlying asset age as well as contract age. Overlapping market periods also make the observations dependent. These results do not remove regime confounding or prove that listing itself causes the difference. The requirement to be older than 300 days at the original capture further restricts the comparison to older surviving contracts.
What does traded volume tell us about liquidity?
Traded quote volume measures activity. It is not quoted depth, spread or executable size, and it cannot by itself confirm or refute a thin-order-book explanation. The following split is a descriptive association only.
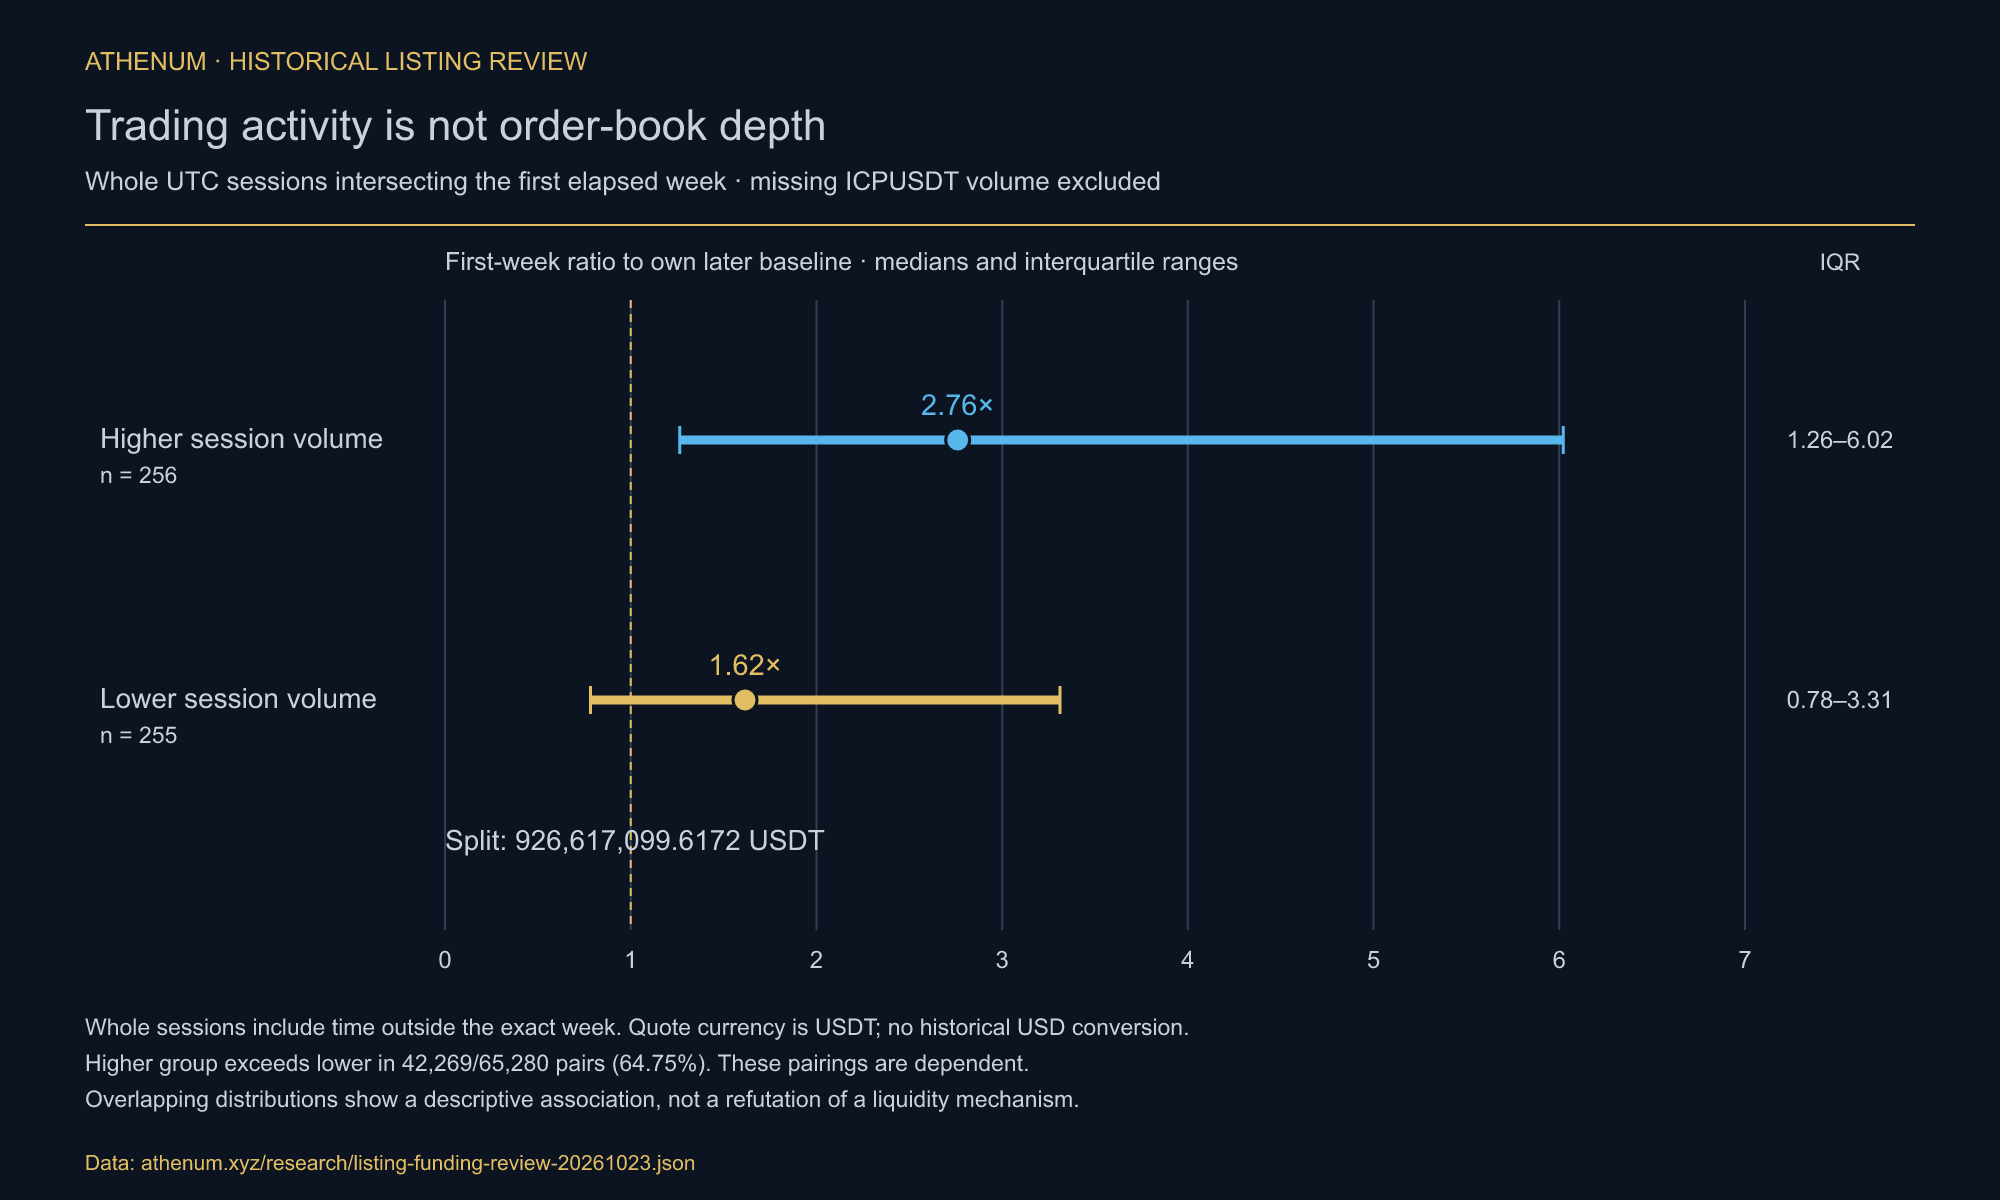
Using whole UTC sessions touched by the first elapsed week, the high-volume group has median ratio 2.76 on 256 contracts and the low-volume group 1.62 on 255. ICPUSDT has no returned bars for this period and is excluded rather than assigned zero volume.
The split point is 926,617,099.6172 USDT of quote volume, without a historical USD conversion. Whole sessions include time outside the exact elapsed week. The interquartile ranges overlap: 1.26–6.02 versus 0.78–3.31. The high-group ratio exceeds the low-group ratio in 42,269 of 65,280 pairings, or 64.75%; those pairings are not independent trials. The earlier capture-day turnover comparison is omitted because it answers a different timing question and its original ticker response was not recovered. Calendar boundaries imply seven full daily sessions for a midnight onboard timestamp and eight otherwise; returned bars can be fewer.
Of 512 week comparisons, 485 have early and late median gaps differing by less than half an hour; their week median is 1.99. This does not mean every gap stayed constant. The stricter sensitivity requires every observed interior 90-day gap to be within three seconds of one nominal 1-, 4- or 8-hour spacing. It retains 454 usable week ratios with median 2.05. Exclusions change the population and do not identify a cause.
Which contracts have nearly constant early rates?
Forty-two contracts have at most two distinct first-week rates, with median ratio 0.697; four still exceed one. Their dominant rates are 0.005% for 25 contracts and 0.01% for 17. This is compatible with an interest baseline, but does not prove the premium stayed inside a band or exclude exchange intervention. Binance changed its formula on 2025-09-18 at 08:01 UTC: the older interval-interest formula differs from the newer bracket divided by 8/N. In the newer default case I=0.01%, cancellation occurs for premium P between −0.04% and +0.06%, subject to symbol rules; BNBUSDT and ETHBTC have an interest exception. A current formula cannot establish the mechanism for every earlier listing. For example, under the older default four-hour interest of 0.005%, the cancellation band is −0.045% to +0.055%; the newer band must not be assigned retrospectively to that case.
BTCUSDT is one counterexample to a universal rule: its 17 returned first-week settlements all equal 0.01%, and its week ratio is 0.778. The daily sessions touched by that week contain about 1.170 billion USDT of quote volume. These observations establish neither historical order-book depth nor the cause of the constant rate.
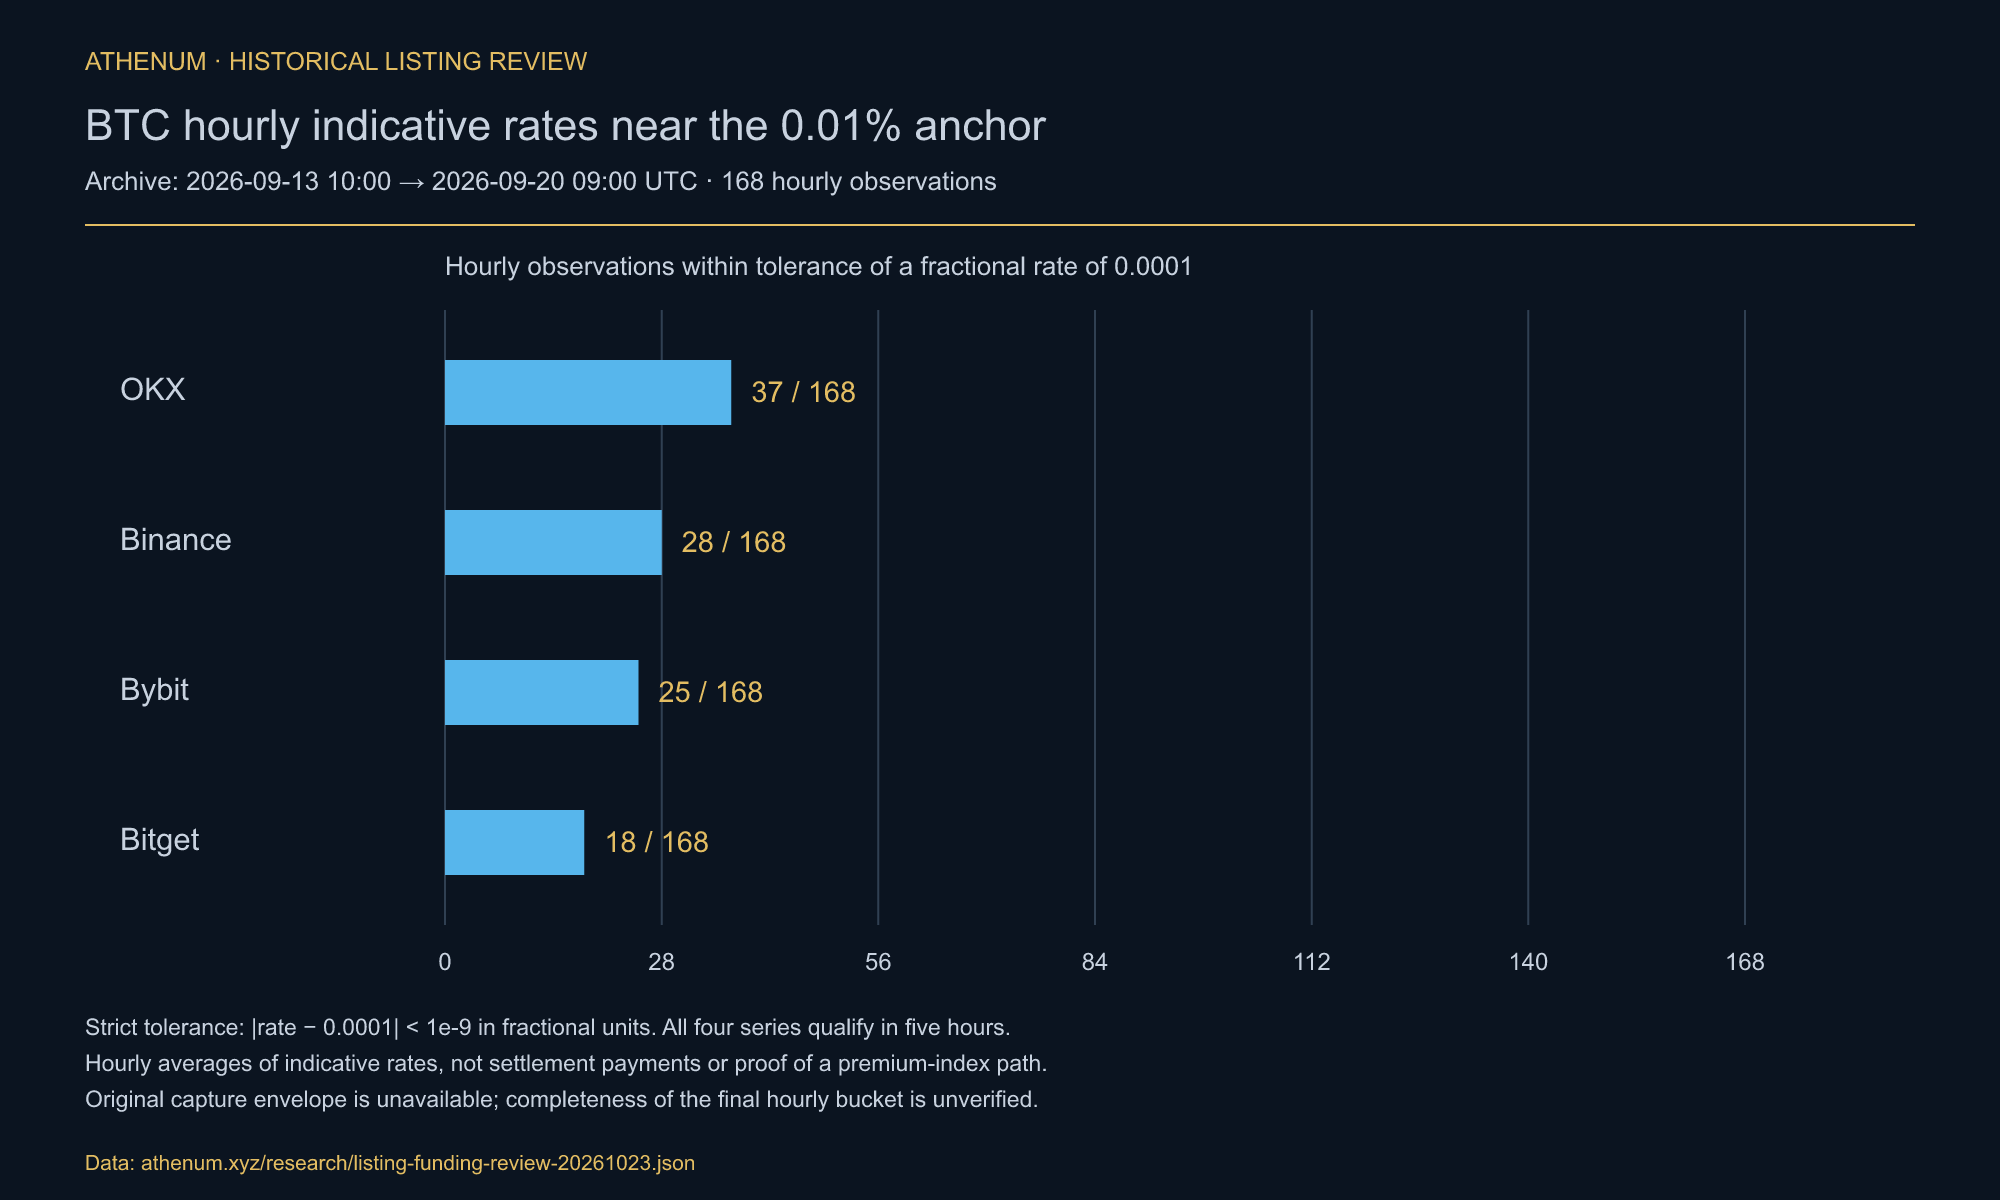
The separate archive contains 168 hourly indicative BTC observations from 2026-09-13 10:00 through 2026-09-20 09:00 UTC. Within a fractional-rate tolerance strictly below 1e-9 around 0.0001, counts are OKX 37, Binance 28, Bybit 25 and Bitget 18. They are not counts of actual funding settlements.
All four series meet that tolerance in five hours. At the last timestamp, Binance, OKX and Bitget are approximately 0.01%, and Bybit is 0.003137%. The stored values are hourly averages; their original capture envelope and final-bucket completeness are unavailable. A repeated indicative value does not establish a premium path. The funding rate calculator illustrates explicitly assumed rates and intervals; actual payments depend on signed settlement rates and position notional.
Does the sign of funding change?
Across 512 paired contracts, the share of negative settlements is higher in the first week for 239, lower for 249 and equal for 24. These counts do not prove equivalence, absence of a directional effect or a profitable side to hold.
Pooling settlements gives a different weighting: 5,280 of 19,816 early observations are negative, or 26.65%, compared with 30,742 of 169,082 later observations, or 18.18%. The pooled and per-contract results answer different questions. Unequal clocks, window lengths and numbers of observations prevent interpreting either as a forecast of account receipts. Pooling weights contracts by their number of returned settlements, including the effect of settlement frequency; it is not the average of contract-level negative shares.
How can the revised result be reproduced?
The linked archive preserves the original aggregate cohort and later public exchange responses with URLs, retrieval times and hashes. Decimal calculations and a separate exact-fraction audit reproduce the revised tables. The original per-settlement responses, exchange-board response and hourly capture envelope were not recovered; later queries are labeled separately.
1. Preserve the original 514 symbol/onboard pairs. The original summary reports 528 live USDT-quoted and USDT-margined perpetuals, 516 older than 100 days, and 514 with usable baseline data. Those census stages are internally archived, not independently reconstructed from the missing historical exchangeInfo response.
2. Use UTC elapsed windows with inclusive starts and exclusive ends. Require at least 30 baseline settlements and a positive mean absolute baseline rate. An old listing timestamp alone does not guarantee complete history; a missing early window has no ratio.
3. Query /fapi/v1/fundingRate in ascending pages, with limit=1000 and the requested end one millisecond before the exclusive boundary. Continue from the final returned timestamp plus one millisecond until the range is exhausted. Validate response errors, symbol, order and duplicates. The first-page counts and means reproduce the original aggregates; completing the requests adds 5,755 baseline observations in twelve real windows and 250 in two later-anchor windows.
4. Compute each early mean of absolute rates divided by its own baseline mean. Report the sample size, median and quartiles interpolated at (n−1)×p. Missing observations remain missing; per-settlement ratios are not annualized returns or cumulative cash flows.
5. Repeat on the eligible 200-day-offset cohort and retain matching contracts for each window. Reconstruct whole-session volume from daily quote-volume fields, excluding unavailable bars. Inspect observed funding spacing separately and publish the sensitivity definition with its changed sample size.
Coverage is one venue and the contracts surviving into the original board snapshot. The first returned five-minute bar is within five minutes of onboard for 446 of 514 contracts, within a day for 488, and more than six hours away for 64. These are bar-return offsets, not proven first trades; the largest is about 424 days. Neither this anchor nor a within-contract ratio repairs survivorship or unobserved history. Order-book mechanisms were not measured.
Can contract age be separated from asset age?
No asset-age series was collected. Moving 200 days forward makes both the contract and its underlying asset older and changes the calendar period. It cannot hold asset age fixed or fully isolate a listing effect.
The listing-era split remains descriptive. Contracts listed in 2019–2021 have a week median of 1.44 across 85 usable cases; those listed from 2024 have 2.25 across 344. Day-one medians are 0.86 across 72 and 3.96 across 344. A listing year is not an observation of prior spot-market history, and a median near one is not a statistical proof of no effect.
Separating these mechanisms would require dated asset histories, relevant market conditions and a justified comparison design. This study has not made that identification, and the BTC example does not settle it.
The useful result is a scoped historical distribution: early funding magnitudes often exceed later native per-settlement rates in this surviving Binance cohort, with wide variation. The table does not establish that the effect disappears within a week, that high volume causes wider funding, or that funding direction is unchanged. Use it to stress-test assumptions, not to assign the next listing a fixed multiplier.
Use the funding rate calculator for explicit funding scenarios and the position size calculator for position sizing. Keep trading fees, signed funding payments, changing notional and liquidation assumptions separate when evaluating a trade.
One terminal. All the data.
Liquidations, orderbook depth, whale walls & open interest, all real-time, in one place. 29 supported exchanges; coverage differs by tool.
No credit card required

Athenum Analytics
Athenum Analytics is our three-person editorial team covering crypto derivatives, market data and macroeconomic context.