Table of Contents9 sections
- Does the quote currency change a Bitcoin perpetual's funding rate?
- How often did the two contracts charge in opposite directions?
- Is the quote currency worth as much as the exchange?
- Do the two contracts track the same dollar?
- How is the index gap associated with the funding gap?
- What does the turnover comparison show?
- What do the 270 settled rates sum to?
- How can you reproduce this?
- What this does not show
The decision before the data
Binance USDC and USDT Bitcoin funding differed at 252 of 270 matched settlements through 2026-09-21; 12 pairs had opposite signs at the same settlement.
| Your question | What to compare | What this cannot establish |
|---|---|---|
| Compare contracts? | Match quote and settlement currencies, funding timestamps and intervals before comparing rates. | A rate difference does not isolate quote currency as its cause. |
| Estimate a holding cost? | Use signed rate × actual notional at each settlement; a sum of rates assumes constant notional. | A rate sum is not a fixed-coin position’s realized payment or a forecast. |
| Choose the more liquid market? | Inspect spread, displayed depth and executable size; turnover share alone cannot answer this. | Reported turnover cannot establish available depth or execution cost. |
Practise with worked lessons
- Compare hourly and eight-hour funding on equal terms
A 0.005% hourly rate costs twice as much as 0.02% every eight hours. Normalise funding to one horizon and keep snapshot APR apart from account returns.
Correction 2026-10-23: the last index candle was unfinished; timestamp-join loss, signed quartiles, turnover/depth interpretation and constant-notional funding assumptions have been clarified. Original snapshots, historical re-fetches and independent calculations are distinguished below. Snapshot JSON Binance funding Bybit funding history Bybit kline units
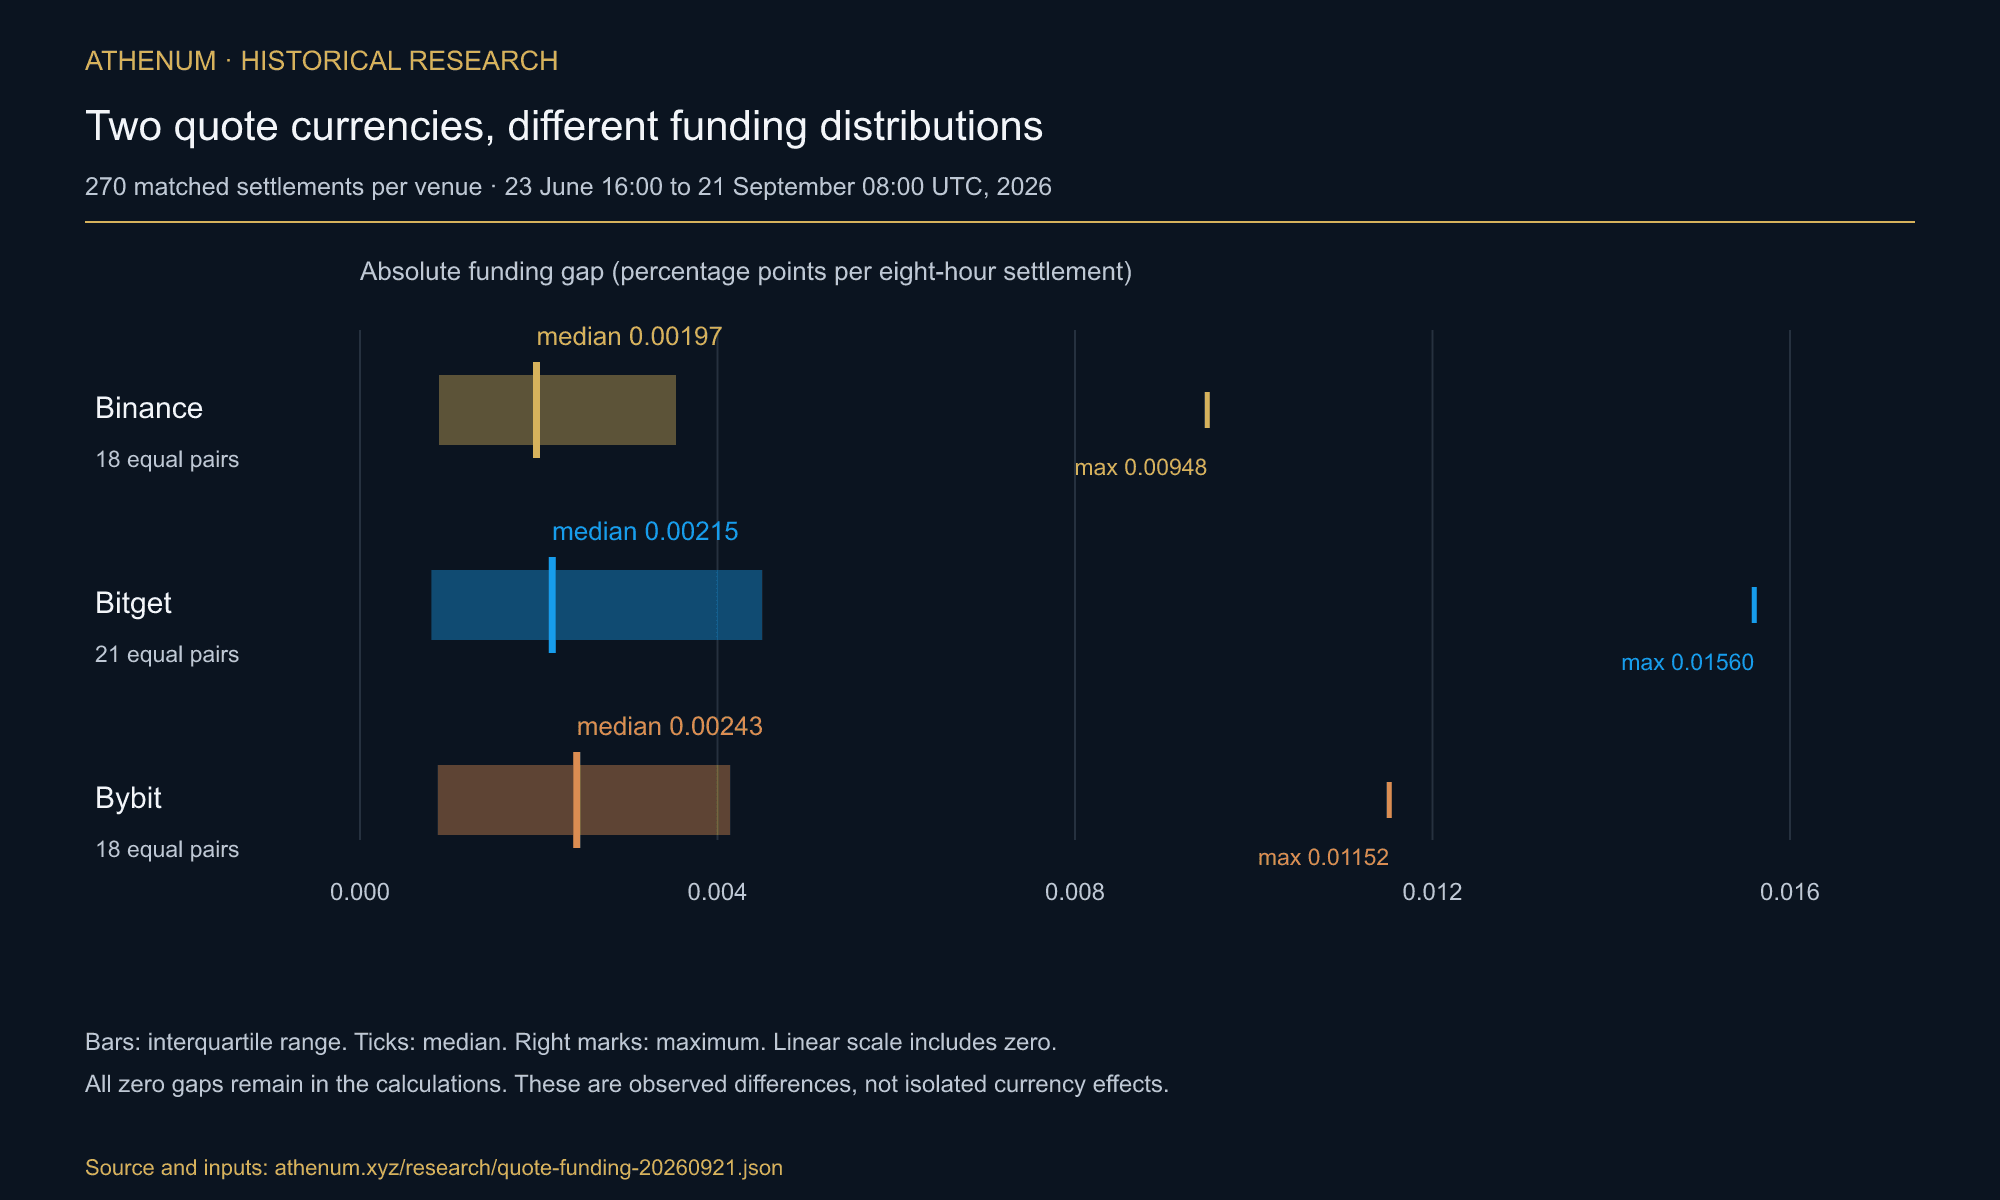
TLDR. In the archived window from 2026-06-23 16:00 UTC through 2026-09-21 08:00 UTC, Binance's USDT- and USDC-quoted Bitcoin perpetuals had different funding rates at 252 of 270 matched settlements. Their median absolute gap was 0.00197 percentage points per eight hours; 12 settlements had strictly opposite signs. The corresponding sign counts were 45 on Bybit and 38 on Bitget. Across the three venue pairs, USDT funding gaps had medians of 0.00244, 0.00284 and 0.00370 percentage points. Quote-pair gaps were therefore of a comparable order in this sample. A Binance index-gap association is descriptive, not causal; traded turnover does not measure order-book depth.
Does the quote currency change a Bitcoin perpetual's funding rate?
Funding combines a contract-specific premium with an interest adjustment, subject to caps and symbol rules. Separate quote-currency contracts have their own books and indices; their settlement and collateral rules can also differ. Binance's 2026-09-21 capture shows eight-hour intervals and a 0.01% interest component for both BTCUSDT and BTCUSDC. That component is not the settled rate or a permanent cap.
Venue | USDT contract | USDC contract | Settlements matched | Identical rate | Median gap, points per 8h | Middle half of settlements | Largest gap | Opposite directions |
|---|---|---|---|---|---|---|---|---|
Binance | BTCUSDT | BTCUSDC | 270 | 18 | 0.00197 | 0.00088 to 0.00354 | 0.00948 | 12 of 270 |
Bitget | BTCUSDT | BTCPERP | 270 | 21 | 0.00215 | 0.00080 to 0.00450 | 0.01560 | 38 of 270 |
Bybit | BTCUSDT | BTCPERP | 270 | 18 | 0.00243 | 0.00087 to 0.00414 | 0.01152 | 45 of 270 |
The middle half of Binance's absolute gaps spans 0.00088–0.00354 percentage points. Multiplying the median by 1,095 eight-hour intervals gives a hypothetical simple annualization of 2.16 percentage points; Bitget and Bybit give 2.35 and 2.66. These are not realized annual costs. A separate archived Athenum projection at 2026-09-21 08:50:20 UTC reported annualized BTCUSDT funding of 8.97% on Binance, 9.00% on Bybit, 10.95% on OKX and Hyperliquid, and 0% on dYdX. That provider projection was not an independent simultaneous capture of every exchange and is not the historical settlement series used below.
All six archived funding series have a sample maximum of 0.01%; the lowest observation is −0.0127% on Bitget USDT. Every equal-rate pair is at 0.01%: 18 on Binance, 18 on Bybit and 21 on Bitget. That sample pattern does not establish a funding cap or an unconstrained downside. Binance's captured cap/floor was ±0.30%, and its interest component was 0.01% per eight hours. Equal settlement rates alone do not identify each contract's underlying premium.
We did not discover that a venue can carry two funding rates. Our own Athenum measurement of funding against price asserted it in passing on 2026-08-28, using Bybit's linear and inverse boards at one settlement, and concluded that a venue is not a board. This post is the size of that claim over 270 settlements, three venues and the pair that assertion named but never measured.
How often did the two contracts charge in opposite directions?
At 12 of 270 settlements on Binance, 38 on Bitget and 45 on Bybit, which means the sign of the payment, not merely its size, depended on which quote currency you traded. The clearest single case is Bybit at 2026-08-28 00:00 UTC, where the USDT-quoted contract charged longs 0.002538 per cent and the USDC-quoted contract PAID longs 0.008977 per cent, the same exchange, the same asset, the same minute, opposite directions. Bybit runs a third Bitcoin board, the coin-settled inverse BTCUSD, and at that same stamp it settled at minus 0.004754 per cent, which is the figure our August post published from the same second: three boards, three different rates, one clock. Bitget produced a wider one at 2026-08-19 16:00 UTC: the USDT contract paid longs 0.0118 per cent while the USDC contract charged them 0.0038 per cent.
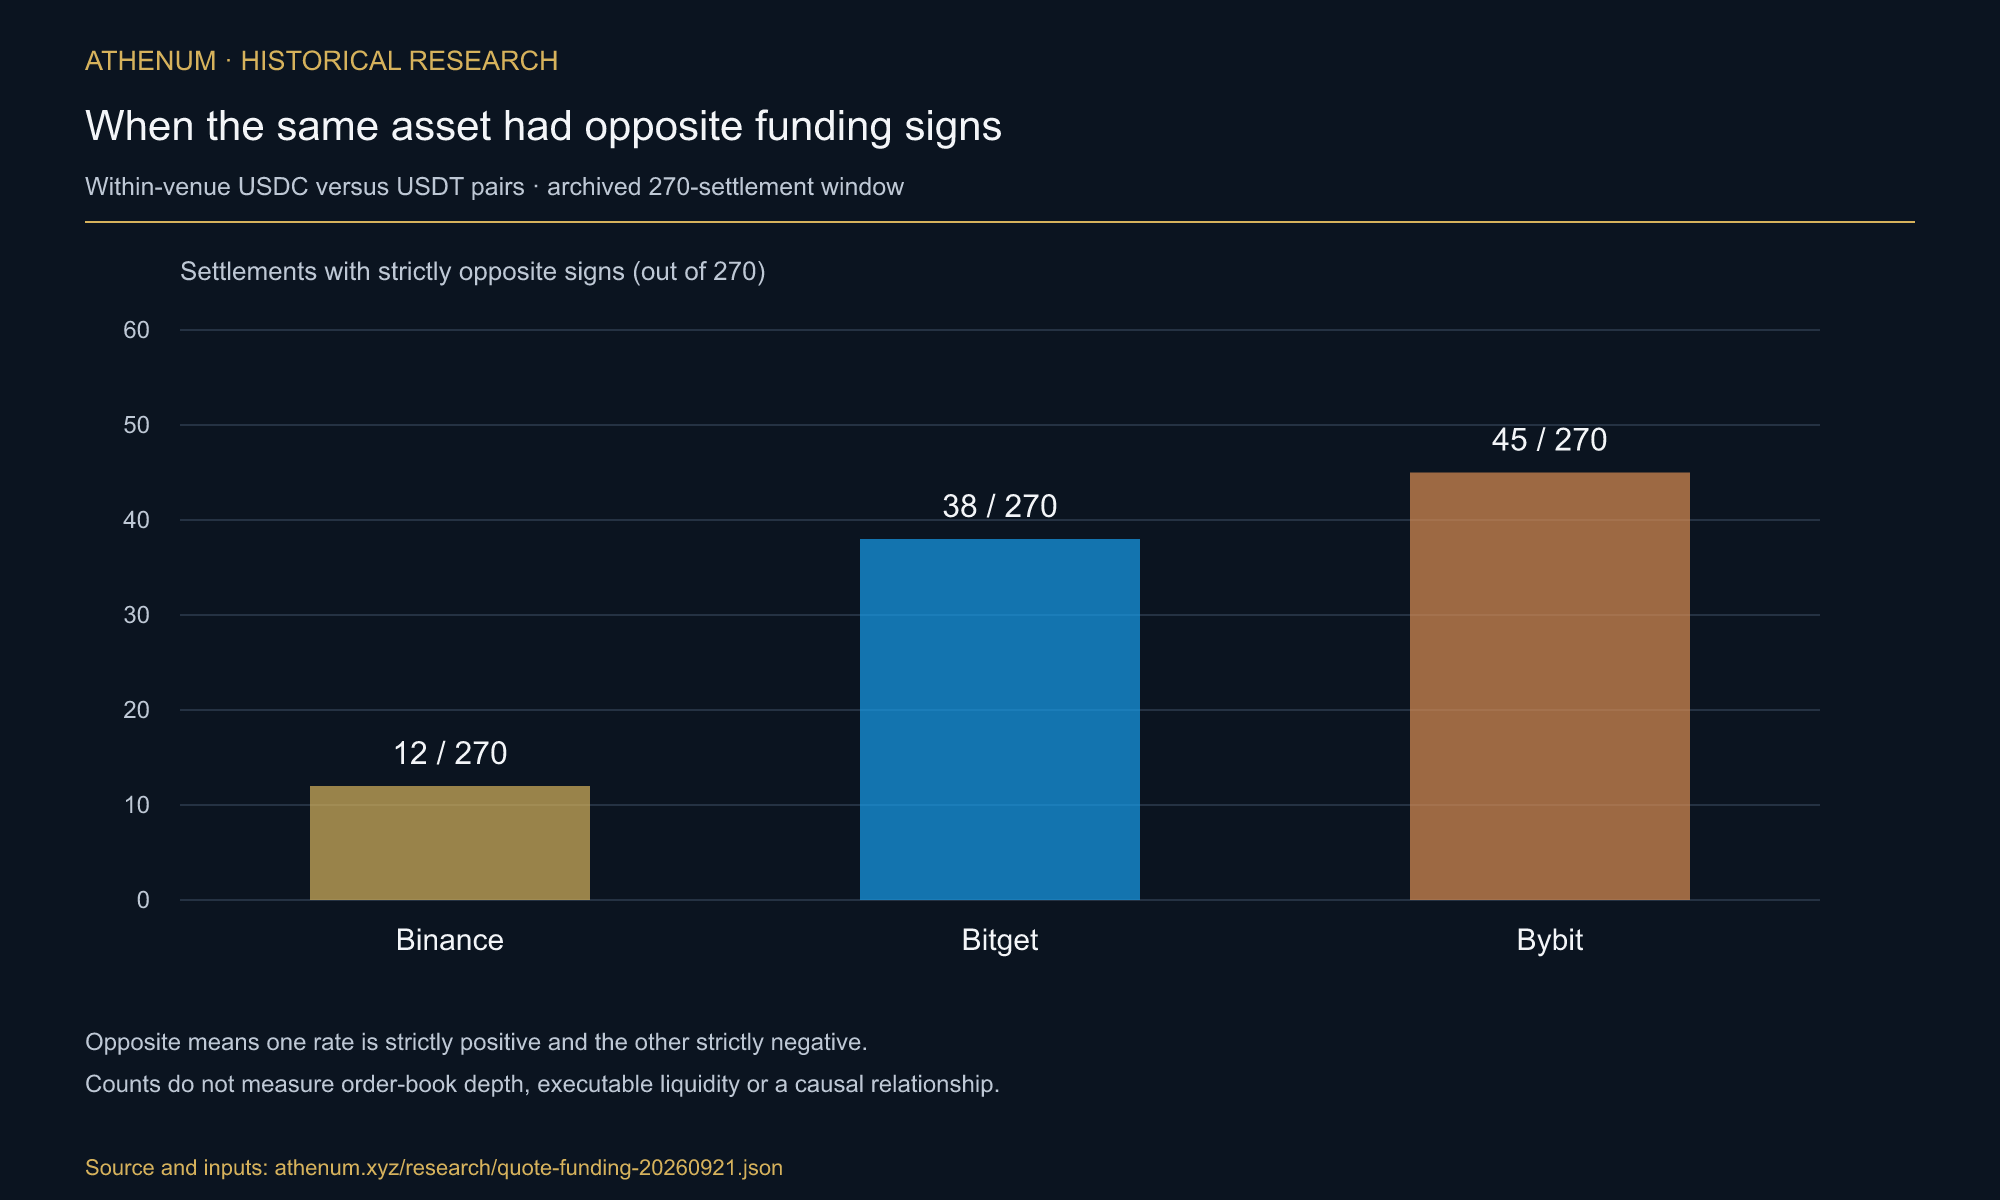
Strictly opposite signs occurred at 12/270 settlements on Binance, 38/270 on Bitget and 45/270 on Bybit. The chart counts settlements; it does not measure depth or executable liquidity.
The archived 24-hour USDT/USDC turnover ratios were 3.7 on Binance, 42.3 on Bitget and 102.5 on Bybit. These are turnover-field ratios from different capture times, not order-book size ratios. Binance and Bybit use their respective quote-currency amounts without historical FX normalization; Bitget used its reported usdtVolume field. Three venue snapshots do not establish a relationship with depth.
Is the quote currency worth as much as the exchange?
Almost, and this is the comparison that decides whether any of the above matters. Run the identical arithmetic on the identical 270 stamps, but change what varies: hold the quote currency fixed at USDT and compare one VENUE against another. That holds the estimator, the window and the settlement clock constant, so the two gaps are directly comparable.
Comparison | What varies | Median gap, points per 8h | Middle half | Opposite directions |
|---|---|---|---|---|
Binance BTCUSDT vs Bybit BTCUSDT | the venue | 0.00244 | 0.00093 to 0.00424 | 29 of 270 |
Binance BTCUSDT vs Bitget BTCUSDT | the venue | 0.00284 | 0.00134 to 0.00526 | 40 of 270 |
Bybit BTCUSDT vs Bitget BTCUSDT | the venue | 0.00370 | 0.00169 to 0.00672 | 55 of 270 |
Binance BTCUSDT vs BTCUSDC | the quote currency | 0.00197 | 0.00088 to 0.00354 | 12 of 270 |
Bitget BTCUSDT vs BTCPERP | the quote currency | 0.00215 | 0.00080 to 0.00450 | 38 of 270 |
Bybit BTCUSDT vs BTCPERP | the quote currency | 0.00243 | 0.00087 to 0.00414 | 45 of 270 |
The quote-pair median absolute gaps (0.00197–0.00243 percentage points per eight hours) are smaller than, but comparable in order to, the venue-pair gaps (0.00244–0.00370). These are comparisons of distributions, not the effect of changing currency while holding every other contract feature fixed. Settlement currency, collateral rules and participant composition also differ. No equivalence or causal effect has been tested.
Do the two contracts track the same dollar?
The 2026-09-21 capture contains 95 Binance daily-candle observations from 2026-06-19 onward: 94 completed UTC days and the still-open 21 September candle, captured around 08:51 UTC. Across those 95 archived observations, the signed index gap had median −5.89 basis points, range −13.55 to +3.54, and nine positive values. Excluding the open candle gives 94 observations, median −5.91 basis points and eight positive values. Index construction as well as quote currency can contribute to the difference; this is not a direct USDT/USD exchange-rate measurement. The Athenum 720 hour study of the Coinbase premium and the Tether discount uses a separate spot-market sample.
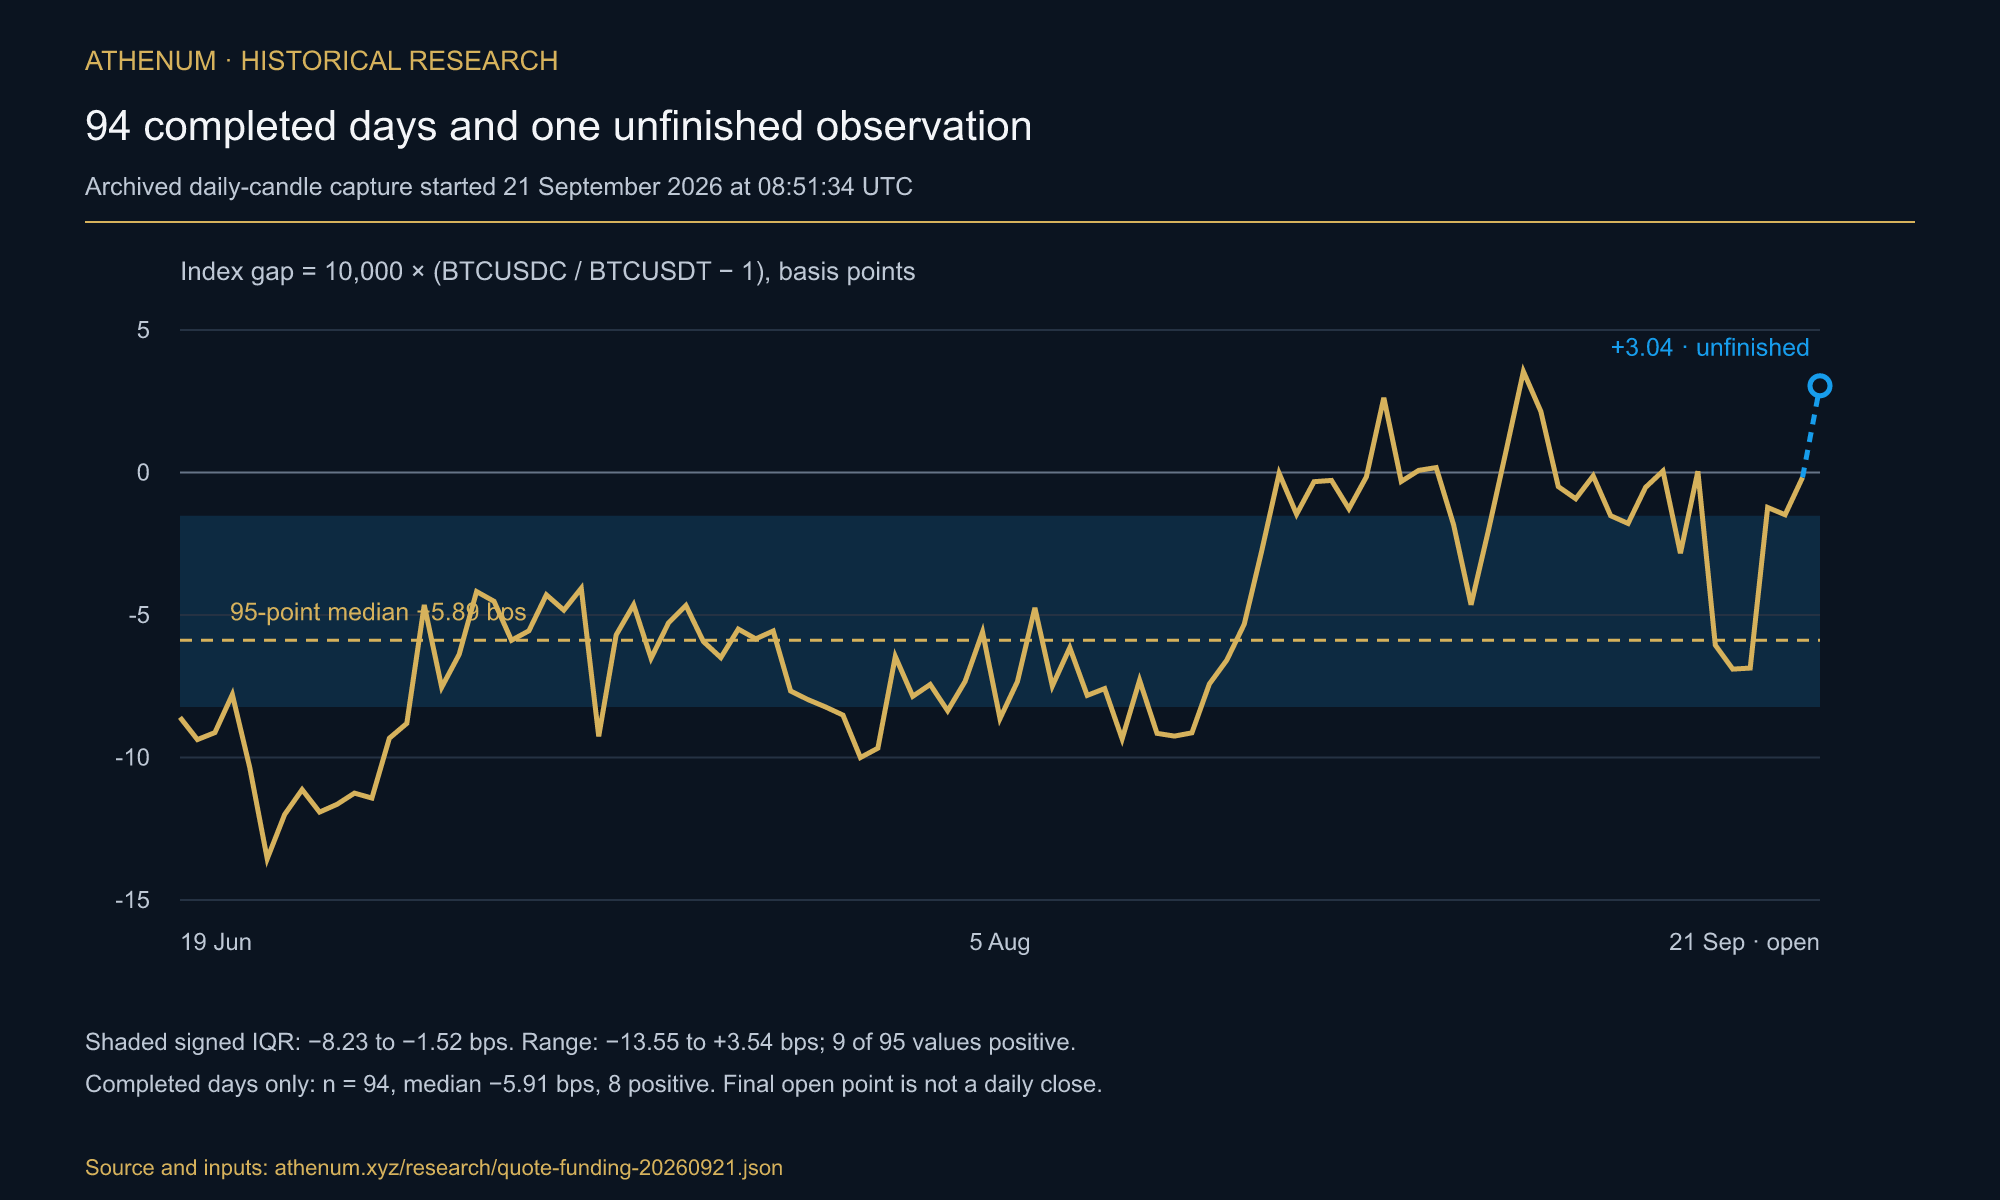
The dashed line shows the archived 95-observation median, −5.89 basis points. The shaded band is the signed interquartile range, −8.23 to −1.52 basis points. The final +3.04 point is explicitly marked as an unfinished 2026-09-21 candle; it is not that day's close. A later historical re-fetch confirms the preceding 94 completed observations and reports a different final close for 21 September.
A basis of that size does not mechanically produce a funding gap, which is what makes the next section necessary rather than decorative. Funding's premium component is a RATIO of two quantities denominated in the same currency, so re-pricing both the perpetual and its index in a slightly cheaper unit divides out. Only the part of the stablecoin gap that fails to pass through to both legs equally can reach the funding rate.
How is the index gap associated with the funding gap?
For 270 Binance settlements, the signed funding gap correlates at r = −0.344 with the index-gap level at the close of the preceding eight-hour candle. The sample r² is 0.118. Correlation with the eight-hour change is −0.0042, close to zero. These descriptive associations do not establish a causal stablecoin contribution or rule out a nonlinear relationship. Consecutive observations can be dependent; no independent-sample significance test is claimed.
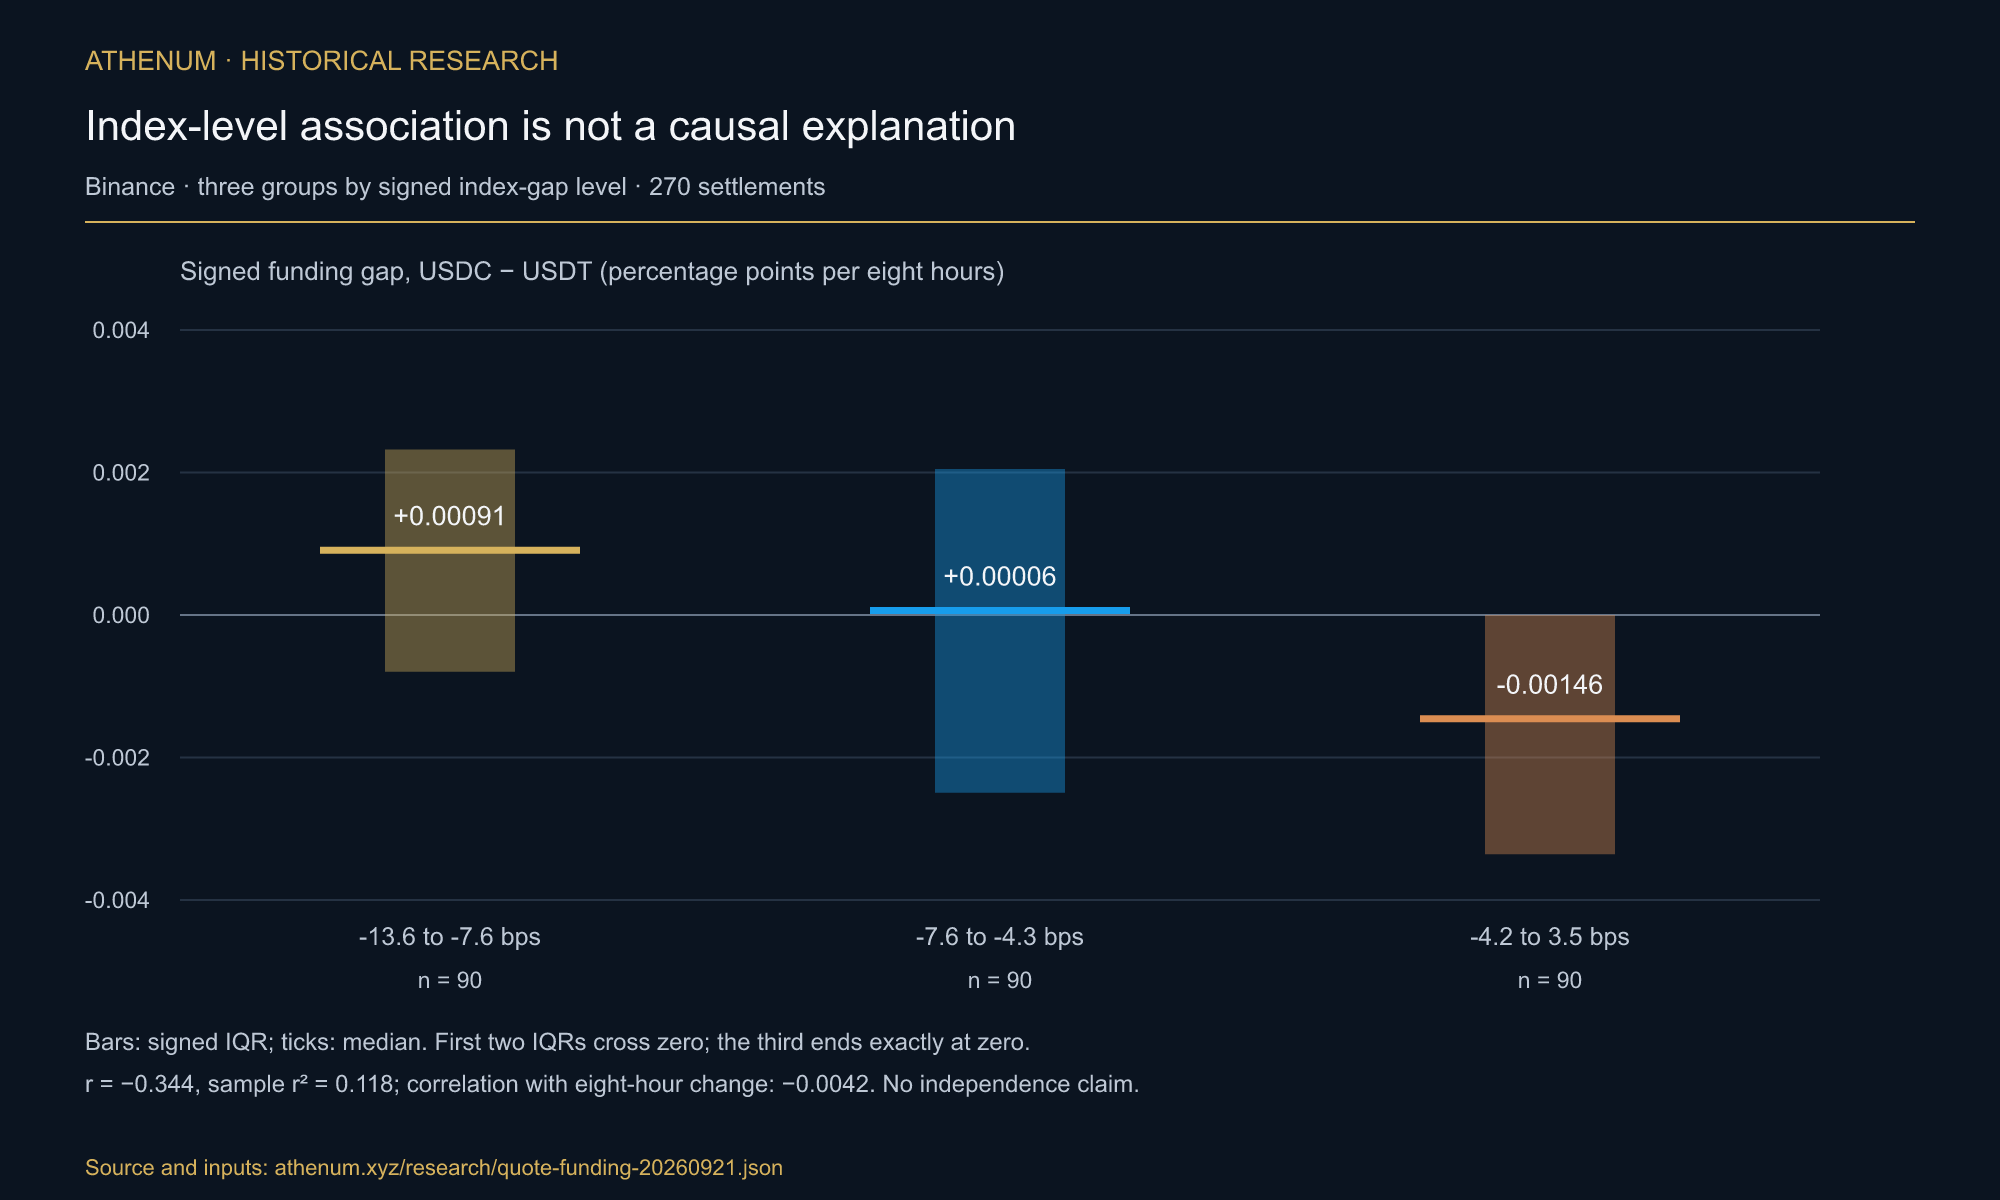
Sorting by signed index-gap level gives three groups of 90 settlements, with median funding gaps declining from +0.00091 to −0.00146 percentage points per eight hours. All three interquartile ranges include zero. This describes the sample, not a rule for the next settlement.
The three index-level groups each contain 90 settlements; median signed funding gaps are +0.00091, +0.00006 and −0.00146 percentage points per eight hours. The first two interquartile ranges cross zero; the third ends exactly at zero. Excluding 58 observations with at least one funding leg at 0.01% leaves 212 observations: r = −0.301 and group medians +0.00080, +0.00014 and −0.00150 across 70, 72 and 70 observations. This sensitivity check does not turn the association into a causal explanation.
What does the turnover comparison show?
The test sorts days by the USDC contract's share of reported quote-currency turnover. It does not observe displayed depth, spread, market impact or executable size, so it cannot confirm or reject an order-book-depth explanation.
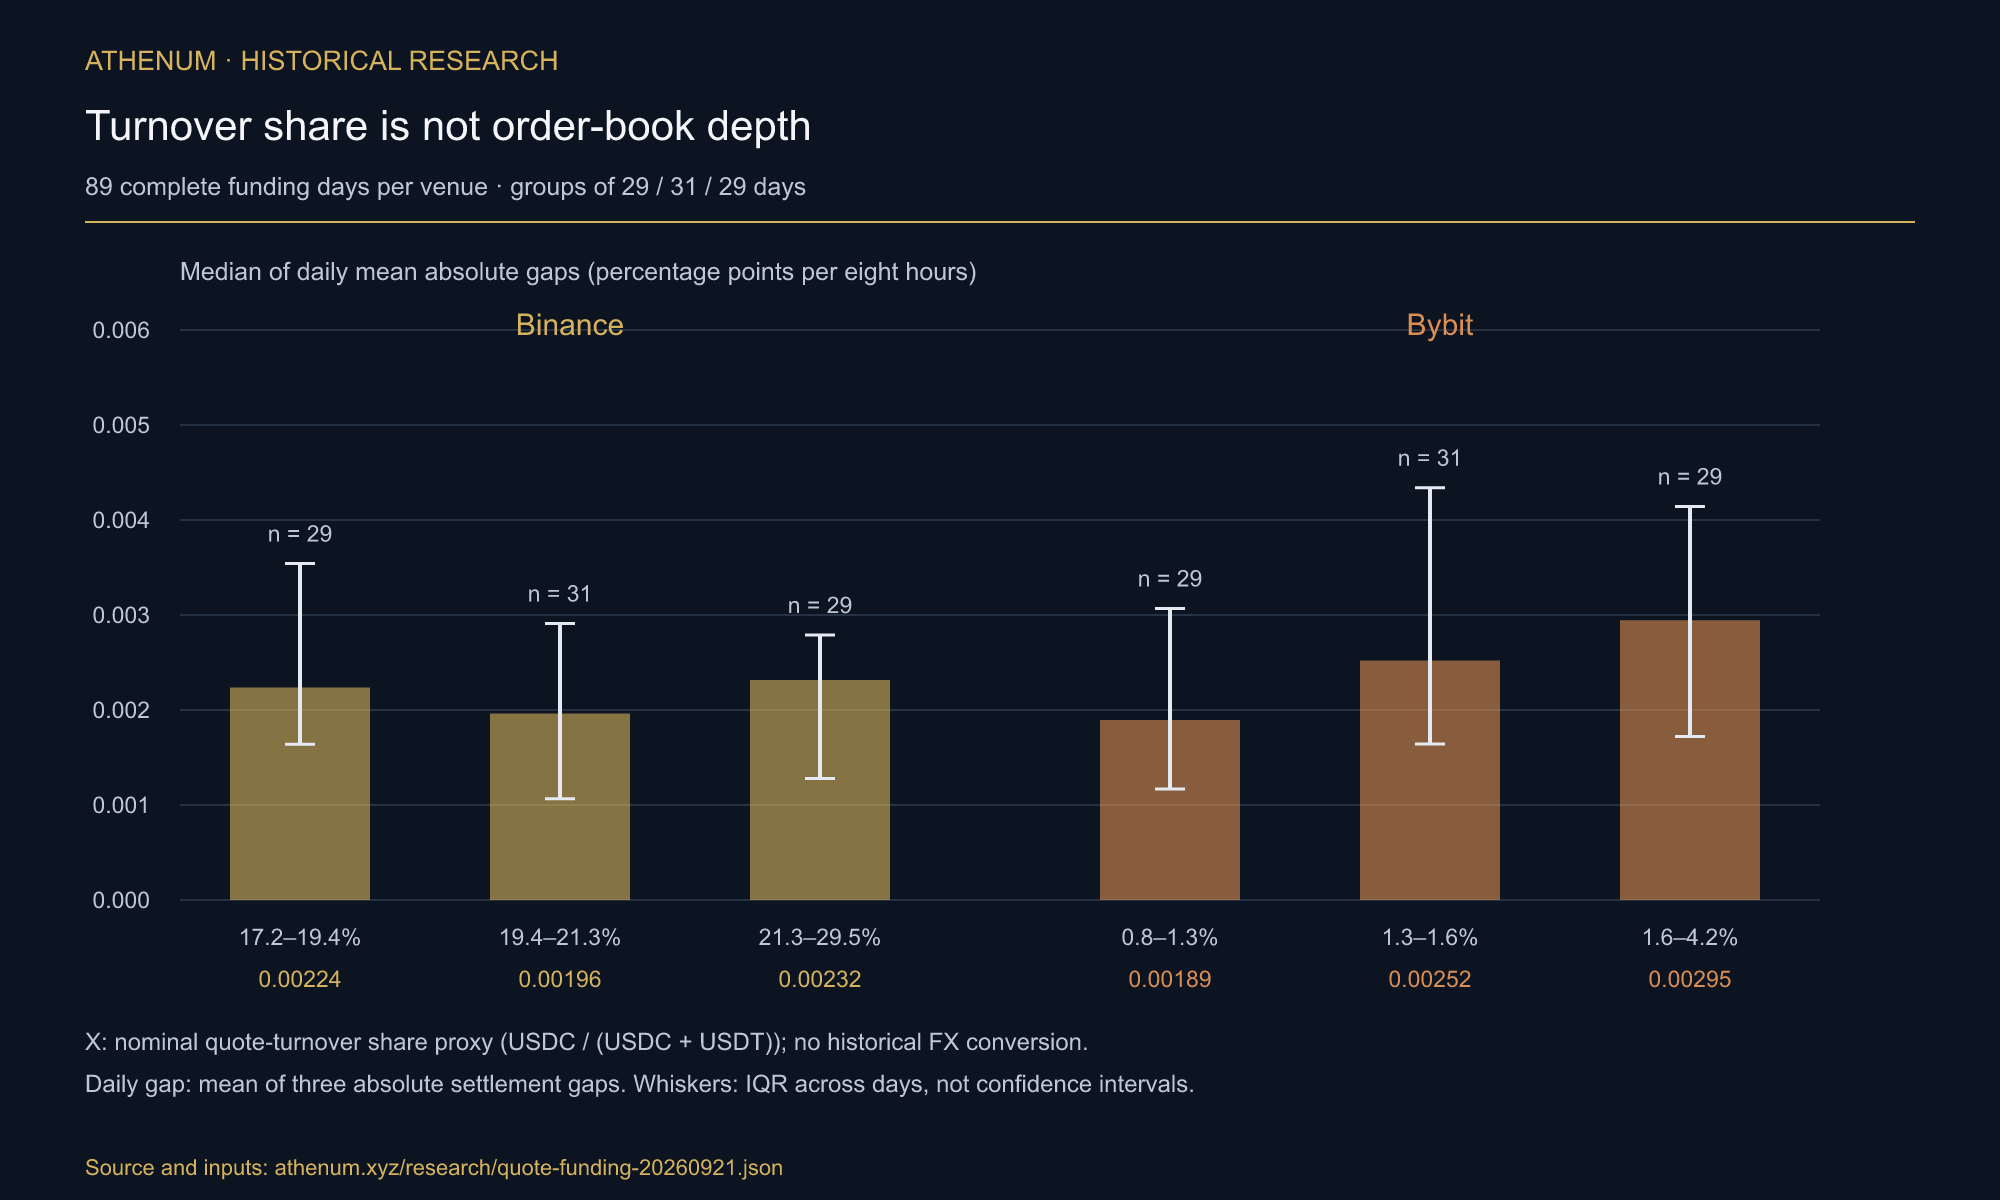
For each venue, 89 complete funding days are grouped into 29, 31 and 29 days by the turnover-share proxy. Each day's value is the mean of its three absolute funding gaps; bars show the median of those daily means and whiskers their interquartile range. Binance medians are 0.00224, 0.00196 and 0.00232 percentage points; Bybit medians are 0.00189, 0.00252 and 0.00295. The interquartile ranges overlap.
Binance's three daily-gap medians do not decrease monotonically with turnover share; Bybit's increase. This describes the turnover proxy in this window. It does not test order-book depth or isolate volatility, participant composition or other drivers. USDC and USDT turnover amounts were combined at nominal parity without historical FX conversion, so the share is a proxy rather than a normalized USD share.
What do the 270 settled rates sum to?
Summed rates are 1.634% for Binance USDT versus 1.516% for USDC, 1.145% versus 1.111% on Bybit, and 1.292% versus 1.479% on Bitget. For a hypothetical long with the same quote-currency notional at every settlement, the signed sums represent net funding paid before trading and rebalancing costs. They are not the payments on an unchanged coin quantity as its mark-price notional varies, nor directly comparable USD returns without FX conversion. The absolute differences are 0.118, 0.034 and 0.188 percentage points respectively. Signed differences can cancel across settlements; multiplying a median absolute gap by 270 does not recover the net cost difference. Short-side cash flows reverse sign. This window does not establish a persistent subsidy or a suitable holding period.
Our Athenum explainer on funding intervals names two reasons the same perpetual pays differently across exchanges, positioning and the length of the interval. On this evidence there is a third, and it operates without leaving the building. If you are sizing the cost of carrying a position, the Athenum funding rate calculator turns a rate into a holding cost, and the Athenum liquidation price calculator is the companion for the leverage side.
How can you reproduce this?
The archived inputs and independent recalculation are linked in the correction note. Public exchange endpoints supplied the original data, but their historical retention and current responses can differ. The capture included several steps; no one-minute reproduction guarantee is made.
1. Pull the funding history for both contracts on one venue over the same window: BTCUSDT and BTCUSDC on Binance, BTCUSDT and BTCPERP on Bybit and on Bitget. Keep the settlement timestamp with each rate.
2. Match settlement times, never list positions. Within Binance, the two raw timestamp sets match at all 270 settlements. Across Binance and Bybit, an exact millisecond join matches 150 and loses 120 of 270 (44.44%), because those Binance stamps are 1–26 ms after the hour. For this dataset, aligning to the nearest hour recovers 270 unique matches. Validate offsets, collisions and interval changes before applying any time normalization elsewhere.
3. Count three things before computing any average: how many settlements are identical, how many differ, and how many carry opposite signs. The third number is the one that changes how a reader should think.
4. Report the middle half alongside the median. A median gap of 0.00197 points across a middle half of 0.00088 to 0.00354 is a different claim from the same median on a tight distribution.
5. Keep turnover and order-book depth separate. Grouping days by turnover share tests that proxy only. A depth hypothesis needs contemporaneous depth, spread, size and market-impact observations, with other drivers considered.
What this does not show
Limits: one Bitcoin window and three venues; no inference to other assets or regimes. KuCoin was not sampled. The captured OKX SWAP listing contained no BTC-USDC-SWAP; this is a dated inventory observation, not a permanent listing claim. Index-gap analysis covers Binance; turnover groups cover Binance and Bybit. Neither establishes causality or measures depth. Quote currency travels with settlement and collateral rules. Bitget's full series is the original script's saved exchange-rate output, converted to percentages, not a model estimate; the original response envelopes are not retained; the 23 October re-fetch covers only 173 of its 270 earlier settlements per contract, all matching. Missing older API observations are not zero. Archived Athenum snapshot values are separately attributed, not independently verified exchange captures.
What is supported: the three quote pairs differed at all but 18–21 of 270 settlements, with strictly opposite signs at 12–45. Their median absolute gaps were of a comparable order to venue-pair USDT gaps. Binance's index-level association is descriptive (sample r² 0.118). Turnover observations do not resolve the role of depth or identify the cause of the funding differences.
Use the linked historical dataset to reproduce this study. A live funding grid describes current conditions and cannot reconstruct the archived window on its own. To explore the current cross-venue grid, start a free 7 day Pro+ trial.
One terminal. All the data.
Liquidations, orderbook depth, whale walls & open interest, all real-time, in one place. 29 supported exchanges; coverage differs by tool.
No credit card required

Athenum Analytics
Athenum Analytics is our three-person editorial team covering crypto derivatives, market data and macroeconomic context.